Process Optimization of Color Removal From an Industrial Azo Dye
←
→
Page content transcription
If your browser does not render page correctly, please read the page content below
International Journal of Innovative Technology and Exploring Engineering (IJITEE)
                                                                        ISSN: 2278-3075, Volume-8 Issue-4S, February 2019

                  Process Optimization of Color Removal
                       From an Industrial Azo Dye
                         P. Kingston Stanley, Sanjeevi Gandhi. A, K. Suresh Kumar, S. Kalidass

   Abstract: Pure and hygienic water is of great demand but most            Hence, it becomes necessary to convert the effluents in to
of the water sources are being contaminated by a variety of               non-toxic products, before its release in to water sources. As
pollutants on a daily basis. Effluents from textile industries is one     the azo dyes are stable and impervious to degradation, the
of the prominent causes of water pollution. They contain a                existing treatment procedures are unable to remove them
mixture of various aromatic and azo dyes, which are made of
                                                                          completely. Although different treatment methods are
complex structures and are highly recalcitrant. The dye color in
the water bodies become a major aesthetic problem along with              currently in use, they have their own shortcomings [7, 8, 9,
other ecological problems. A number of physical and chemical              10, 11]. So, it is highly essential for development of other
methods are available for dye removal apart from aerobic and              efficient and promising methods. Nano remediation is one of
anaerobic biological degradation. A majority of these methods             the current method which is being used for the remediation
have limitations and are less successful in the complete dye              of a variety of pollutants [12, 13, 14].
removal. Metal nanoparticles are recently being employed in the
decolorization of the textile dyes and they show promising results                 II. MATERIALS AND METHODS
in comparison to other conventional methods. The output of this
paper is to design a high efficient process with complete                 Preparation of Dye samples
automation. Instrumentation setup plays a major role in the                 The azo dye Red RR was obtained from a textile dyeing
automation of the process.                                                industry at Tirupur. Dye solutions of required concentration
  Keywords: Color removal, Nano particle, Color optical sensor.           were prepared by mixing the dye powder in distilled water
                                                                          and used for experiments.
                    I. INTRODUCTION
                                                                          Preparation of the Matrix
  In the recent times, water pollution has become an
important concern because of its direct intervention in the               Encapsulation of bacteria in Alginate Beads
human and animal lives. Due to rapid urbanization and                       The experimental bacterial strain (Aneurinibacillus
industrialization, the level of toxic and hazardous chemicals             aneurinilyticus) was isolated from effluent sludge of a
released from various industries are causing a threat to the              textile industry. The organism was immobilized in calcium
eco-system. Among the various industries that are causing                 alginate beads. For the immobilization process, bacterial
pollution, the textile dyeing and finishing industry plays a              cells were grown overnight in culture media and harvested
prominent role [1]. More than 100,000 commercially                        by centrifugation at 7000 rpm for 10 minutes. The cells were
available dyes are used in various processes of textile                   washed with saline and suspended in 2.0% sodium alginate.
industry. Most of the synthetic dyes from the textile industry            This slurry was then extruded drop-wise into 4.0% Calcium
are composed of complex structures which are toxic,                       chloride(CaCl2)solution. CaCl2 acts as a cross- linking agent
carcinogenic and are highly recalcitrant [2, 3]. Of all the               which stabilizes the beads. They were allowed to harden in
industrial dyes, azo dyes are versatile because of their easy             the CaCl2 solution for 10-12 hours at 4°C, after which they
use and varied applications [4]. As a result of it accounts for           were washed with saline to remove excess amount of free
the majority of all the textile effluent. These effluents, when           cells. The diameter of the beads were measured was found
released into water bodies, increase the turbidity and                    to be in the range of 2mm to 5mm. The whole procedure
colloidal nature of the water, thereby affecting biochemical              was carried out under aseptic conditions. The beads with the
oxygen demand (BOD) and chemical oxygen demand                            bacteria were then used for decolorization experiments.
(COD) and an alteration in the pH [5, 6].
                                                                          Immobilization of iron nanoparticles on the polymer
                                                                          substrate
                                                                             Carrier polymers of different pore sizes were purchased
                                                                          from a local supplier and were cut into uniform sizes of
                                                                          1x1x1 cm. The polymer was pretreated by soaking them in a
                                                                          dilute hydrochloric acid solution (4%) for a period of 8 – 12
                                                                          hours. All the mandatory reagents required for nanoparticle
Revised Manuscript Received on February 05 2019.                          synthesis viz., 1.0 M Ferric chloride (FeCl3), 1.6 M Sodium
   P. Kingston Stanley, Department of Instrumentation Engineering,        borohydride (NaBH4) and 0.1% Palladium acetate
Karunya Institute of Technology and Sciences, Coimbatore,
   Sanjeevi Gandhi. A, Electrical and Electronics Engineering, Karpagam
college of Engineering, Coimbatore,
   K. Suresh Kumar, Biotechnology, Karunya Institute of Technology and
Sciences, Coimbatore,
   S. Kalidass, Dept of Animal Sciences, Manonmaniam University

                                                                              Published By:
                                                                              Blue Eyes Intelligence Engineering
Retrieval Number: DS2902028419/19©BEIESP                              433     & Sciences Publication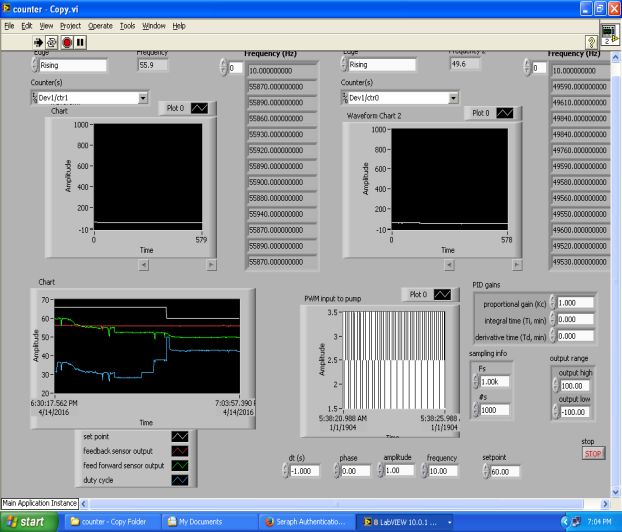
Process Optimization of Color Removal from an Industrial Azo Dye

[Pd(CH3COO)2] were prepared using 40% ethanol. Iron                solutions and measured with TCS3200 in all the four filter
nanoparticles were then synthesized onto the matrices by the       modes to obtain the output frequency of the known solution.
sodium borohydride reduction method [15]. Palladium                And the above procedure repeated for many solutions and
acetate was doped onto the synthesized nanoparticles to            tabulated. Figure.2 &Figure.3 shows the different filter
enhance the activity.                                              frequency results of various red & blue known
                                                                   concentrations. These results helped in choosing the right
Sensor Design and Calibration characteristics
                                                                   filter mode for designing the color removal process.
Color sensor
  The color sensor utilized in the proposed work is an IC -
TCS3200. This IC consists of 8 x 8 array with a total of 64
photodiodes which the light-to-frequency. Out of this 64
photodiodes, 16 are used as blue(B) filter mode, another 16
photodiodes are used as green(G) filter mode, next 16
photodiodes are deployed as red(R) filter mode, and the
remaining 16 photodiodes are used as white / no filter mode.
The pins S2 and S3 are used to select the particular filter
mode as per the tabulation made in table 1. To diminish the
effect of variation in incident irradiance the four filter modes
are combined together.

                                                                                  Fig. 2 Frequency vs Red Filter

            Fig. 1 Functional block of TCS3200
   The pins S0 and S1 are used to select the scaling factor for
frequency scaling as per the tabulation made in table 2. By
selecting the switches S0 and S1 value high, 100% scaling
can be achieved. For further reducing the scaling to 20% and
2%, the switches values can be 1 0 and 0 1 respectively.
                Table. 1 Photodiode modes                                         Fig. 3 Frequency vs Blue Filter
       S2      S3          PHOTODIODE TYPES                          Experiments were carried out in a batch mode to find out
       0       0             R FILTER MODE                         the decolorization efficiency of the immobilized bacteria
       0       1             B FILTER MODE                         and immobilized nanoparticles. The same experiment was
       1       0             No FILTER MODE                        carried out in a closed and open loop format.
       1       1             G FILTER MODE                         Fabrication of a pilot setup
            Table. 2 Output Frequency Scaling                        The Bio-Process setup was prepared by packing the
                                                                   synthesized PUF in a glass column as depicted as shown in
       S0      S1      FREQUENCY SCALING (fo)                      Figure.4. The prepared color dye solutions collected in the
       0       0            Power Down                             tank and pumped to the column with the flow rate of
       0       1                2%                                 20ml/min. To allow this minimum flow rate a bypass (T
       1       0               20%                                 junction) valve also were used. A similar set was made for
       1       1               100%                                the bacteria also replacing the polymer column with sodium
Sensor Standardization                                             alginate beads which had the bacteria immobilized in them.
  Calibration is the process of relating two unknown
measurable quantities. Any sensor should be calibrated
initially to meet the standards, provided by the manufacture
in the datasheet. The colored solutions were prepared at five
different known concentrations of Red dye & Blue dye

                                                                      Published By:
                                                                      Blue Eyes Intelligence Engineering
   Retrieval Number: DS2902028419/19©BEIESP                    434    & Sciences Publication
International Journal of Innovative Technology and Exploring Engineering (IJITEE)
                                                                   ISSN: 2278-3075, Volume-8 Issue-4S, February 2019

                                                                   The alginate beads is packed together to form a sodium
                                                                alginate filter. The construction of this experimental setup is
                                                                entirely different from the PUF setup, where in the outlet
                                                                flow rate is maintained constant and there is no inlet
                                                                continuously. The dye solution is passed in to the column
                                                                and the eluates (20ml) were collected at regular time
                                                                intervals (every hour). Percentage of degradation values
                                                                were calculated. The efficiency of the alginate beads is
                                                                proportional to the retention time of the dye solutions in the
                                                                presence of the bacteria. From the Figure.7, it is evident that
                                                                the decolorizing efficiency goes down after few rounds of
                                                                decolorization for alginate beads.

                 Fig. 4 Bio-Process setup

         III. RESULT AND DISCUSSION
Flow rate optimization
   The automated process of decolorization requires an
optimum flow rate for the colour removal process. Hence a
closed loop system with a TCS3200 as a colour sensor, a
pump as the actuator and the PWM signal as the control for
operating the pump. The controller was designed for the
above the process to remove the colour effectively. The
pump was tested with various input voltages to obtain the
flow rate and tabulated. Figure 5 shows the various
regulated output flow rate for different input voltages. For
the efficient decolourization, a flow rate of 20ml/min was
fixed and regulated by regulator under open loop test. For
the closed loop, PWM signals were generated by the                   Fig. 6 % of color degradation vs optical density
designed controller for the effective decolorization.                             from PUF experiment

        Fig. 5 Actuator Voltage vs regulated flow
Open Loop Test
  The system ran in open loop test and the decolorizing              Fig. 7 % of color degradation vs optical density
efficiency were calculated. Under open loop a constant flow                        from SA experiment
rate of dye solutions were pumped to column. From the
Figure.6, it is evident that the decolorizing efficiency goes
down after few rounds of decolorization for PUF matrix.
The shelf life of PUF matrix in decolorizing the dye is
estimated in this experiment.

                                                                    Published By:
                                                                    Blue Eyes Intelligence Engineering
Retrieval Number: DS2902028419/19©BEIESP                    435     & Sciences Publication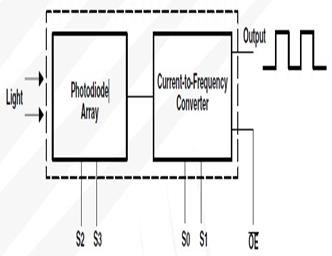
Process Optimization of Color Removal from an Industrial Azo Dye
Closed Loop Test
The entire setup is run in a closed loop with a suitable
controller. The experimental setup discussed in section 2.4
is run as closed loop system with a suitable control
algorithm implemented in LabVIEW. In the closed loop
system the output of the process tank which is expected be
decolorized solution is monitored using color sensors to
check for any amount of dye present in the solution. The
two sensors are arranged in such a way that it measures the
presence/absence of the color present in the dye solution.
The two sensor are placed before and after the process tank
and the datas are collected and compared to conclude on
how much of color is being removed from the dye solution.
Based on this data the PID controller algorithm is
implemented in LabVIEW and does the operation of the
pump is controlled. The output of the process tank is
collected in the settling tank if the dye is completely
decolorized else the dye solution is fed back into the process Fig. 10 Frequecny counter labview program
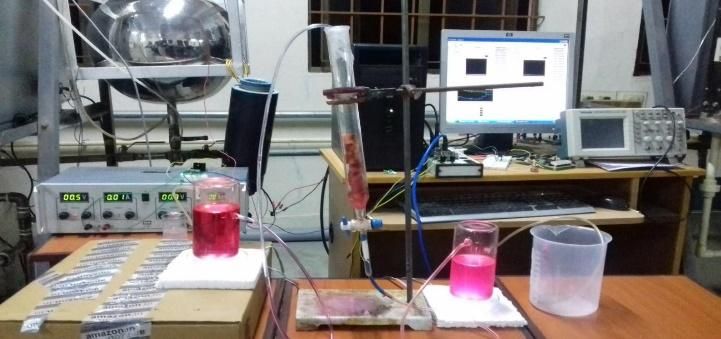
tank for the further decolorization. Figure. 8 (Closed loop (block diagram)
setup), Figure. 9, is the closed loop experimental setup for
the decolorization process. So the feedback as well as feed
forward control scheme implemented in the closed loop
process ensures maximum decolorizing efficiency.
Fig. 11 Frequecny counter labview program
(front panel)
Unlike the nanoparticles immobilized in PUF, alginate
immobilized bacteria take more time to decolorize because
Fig. 8 Closed loop setup the microbes require a doubling time. It is during this phase
that the microbial cells double and grow rapidly and release
enzymes which subsequently metabolize the dyes. Closed
loop color removal (Figure.9) in which the feedback as well
as the feed forward sensors are interfaced to the real-time
system. The flow rate is regulated by the pump which is
driven by PWM input. The setup was made to run as a
temporary system in order to obtain the gain values for the
controller. Figure.10 and Figure.11 are the Block Diagram
and the Front Panel design respectively in LabVIEW
Software.
IV. CONCLUSION
The sensor data is acquired via a NI-DAQ in LabVIEW
and the PID control algorithm is implemented to adjust the
flow rate by PWM circuit.
Fig. 9 Experimental setup
Published By:
Blue Eyes Intelligence Engineering
Retrieval Number: DS2902028419/19©BEIESP 436 & Sciences PublicationInternational Journal of Innovative Technology and Exploring Engineering (IJITEE)
ISSN: 2278-3075, Volume-8 Issue-4S, February 2019
The main objective of the proposed work to attain the
maximum color removal for the given solution is
successfully achieved. The effectiveness of the proposed
methodology is evaluated by using similar test offline. The
comparison study of PUF and SA test were carried out
successfully. Nano particle immobilized on the polymer
gives better decolorization when compared to the sodium
alginate immobilized microbes. In the above experiments,
only a standard volume (1 liter) of the dye solution was
tested against the immobilized bacteria and nanoparticles.
Further analysis with higher volumes of dye solutions
should be done in order to determine the saturation point for
the individual columns. Technologies are emerging towards
greater heights as such this conceptual model is made out to
give an efficient way in the decolorization aspect.
REFERENCES
1. Chequer FMD, de Oliveira GAR, Ferraz ERA, Cardoso JC, Zanoni
MVB, de Oliveira DP “Textile dyes: dyeing process and environmental
impact” In: Gunay M (ed) Eco friendly textile dyeing and finishing.
InTech Press, Crotia, 2013.
2. Fu, Y. and Viraraghavan, T., “Fungal decolorization of dye
wastewaters: a review”, Bioresour. Technol. 79, 251-262, (2001).
3. Campos R, Kandelbauer A, Robra KH, Cavaco-Paulo A, Gübitz GM.
Indigo degradation with purified laccases from Trametes hirsuta and
Sclerotium rolfsii. J Biotechnol. 2001 Aug 23; 89(2-3):131-9.
4. Brüschweiler, B.J., Küng, S., Bürgi, D., Muralt, L., Nyfeler, E., 2014.
Identification ofnon-regulated aromatic amines of toxicological concern
which can be cleavedfrom azo dyes used in clothing textiles. Regul.
Toxicol. Pharmacol. 69, 263e272.
5. Chung KT, Stevens SE Jr, Cerniglia CE. The reduction of azo dyes by
the intestinal microflora.Crit Rev Microbiol. 1992; 18(3):175-90
6. Dhanjal NIK, Mittu B, Chauhan A, Gupta S. Biodegradation of textile
dyes using fungal isolates. J Env Sci Technol. 2013;6(2):99–105
7. Robinson T, McMullan G, Marchant R, Nigam P. Remediation of dyes
in textile effluent: a critical review on current treatment technologies
with a proposed alternative. Bioresour Technol. 2001 May; 77(3):247-
55.
8. Claudinei S. Lima a,b, Karla A. Batista b, Armando Garcıa Rodrıguez
b, Jurandir R. Souza c, Katia F. Fernandes “Photodecomposition and
color removal of a real sample of textile wastewater using
heterogeneous photocatalysis with polypyrrole” science direct , 2015.
9. Kyung-Won Jung, Min-Jin Hwang, Dae-Seon Park, Kyu-Hong Ahn
“Combining fluidized metal-impregnated granular activated carbon in
three-imensional electrocoagulation system: Feasibility and
optimization test of color and COD removal from real cotton textile
wastewater” by science direct, 2 April 2015.
10. Amir Hajialia, Gevorg P. Pirumyanb “Evaluation of Turbidity and
Color Removal in Treatment of Wastewater Containing Resistant
Pollutants with Ozonation” science direct on December 2014
11. Turhan. K. and Turgut. Z “Decolorization of direct dye in textile
wastewater by ozonization in a semibatch bubble column reactor”,
Desalination 242, 256-263, (2009).
12. Zhang, K., Kemp, K. C., & Chandra, V. “Homogeneous
anchoring of TiO2 nanoparticles on graphene sheets for waste water
treatment” Materials Letters, 81, 127–130, (2012).
13. Yao, D., Chen, Z., Zhao, K., Yang, Q., & Zhang, W, “Limitation
and challenge faced to the researches on environmental risk of
nanotechnology” Procedia Environmental Sciences, 18, 149–156,
(2013).
14. Masciangioli, Tina, Wei-Xian Zhang. “Environmental Technologies at
the Nanoscale” Environmental Science and Technology 37(5), 102A-
108A, 2003
15. Crane, R.A and Scott, T.B. Nanoscale zero-valent iron: Future
prospects for an emerging water treatment technology. Journal of
Hazardous Materials, 211–212, 15, 2012, 112-125
Published By:
Blue Eyes Intelligence Engineering
Retrieval Number: DS2902028419/19©BEIESP 437 & Sciences PublicationYou can also read