Production of principal field crops, July 2021
←
→
Page content transcription
If your browser does not render page correctly, please read the page content below
Production of principal field crops,
July 2021
Released at 8:30 a.m. Eastern time in The Daily, Monday, August 30, 2021

Canadian farmers are projected to harvest more corn for grain, but less wheat, canola, soybeans, barley and oats,
according to recent yield models using satellite imagery. Lower production has been driven largely by ongoing
drought conditions in Western Canada, which could decrease yields.

Farmers across Western Canada have had to contend with a lack of rain and higher-than-average temperatures
throughout the growing season. This has exacerbated soil moisture conditions, which were already low at the start
of the year. These factors have negatively impacted crop growth and yield potential across much of the Prairies.

Statistics Canada has relied upon proven satellite technology to model preliminary crop yields and production
since 2016. These methods have successfully been used to produce September yield estimates since 2016, and
they replaced July yield estimates beginning in 2020. While dry conditions may lead to an increase in abandoned
acres, coarse resolution-based modelling relies on historical averages for harvested area. Final harvested area
estimates will be published on December 3, 2021, based on the November 2021 Field Crop Survey.

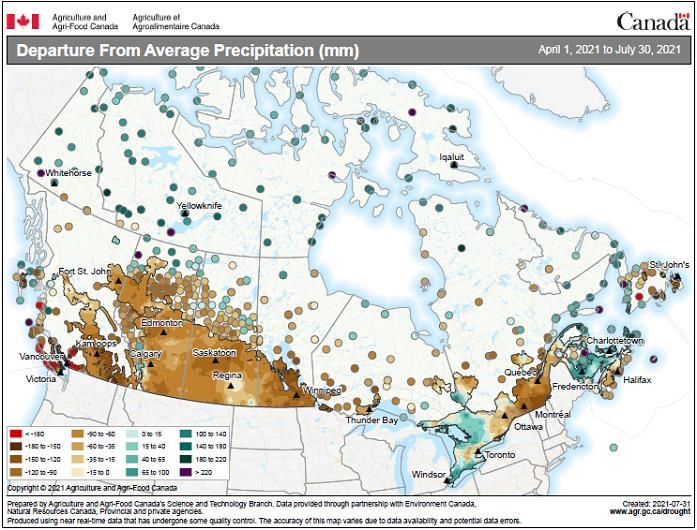
The Daily, Monday, August 30, 2021

Map 1 – Departure from average precipitation (in millimetres) from April 1 to July 30, 2021 (during
the growing season), compared with annual average, by province

2                             Component of Statistics Canada catalogue no. 11-001-X

The Daily, Monday, August 30, 2021

Map 2 – Mean temperature difference from normal (in degrees Celsius) from July 1 to
July 31, 2021 (during the growing season), compared with annual average, by province

The Crop Condition Assessment Program (CCAP) indicates that overall plant health in Western Canada was lower
to much lower than normal, having decreased considerably throughout the month of July. This indicates the
likelihood of lower-than-normal yields.

An assessment of Normalized Difference Vegetation Index (NDVI) curves, which are a measure of plant health,
indicated that in almost all parts of the Prairies, crops reached peak health well ahead of normal. In some instances,
peak NDVI occurred up to four weeks earlier, before decreasing rapidly as a lack of moisture and high temperatures
took a toll on plant health.

This is the first time since 1987, when Statistics Canada began monitoring crop conditions using coarse resolution
satellite images, that NDVI curves have peaked so early in the growing season. The CCAP also indicates that dry
conditions have impacted almost all of Western Canada. By comparison, other notable droughts such as
in 2002—while difficult for many—were less widespread than this year's. In Eastern Canada, the CCAP is similar to
average, as parts of Ontario and the Maritimes received higher-than-normal rainfall, while most of Quebec remains
drier than average.

                                   Component of Statistics Canada catalogue no. 11-001-X                            3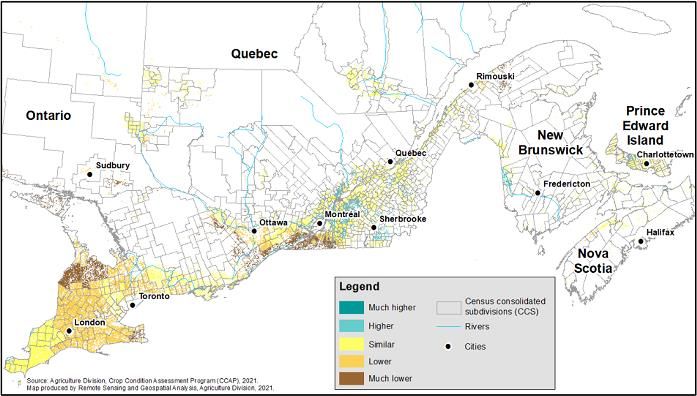
The Daily, Monday, August 30, 2021

Map 3 – Vegetation growth index as of the week July 26, 2021 compared with normal, by census
consolidated subdivision for Western Canada

4                           Component of Statistics Canada catalogue no. 11-001-X
The Daily, Monday, August 30, 2021

Map 4 – Vegetation growth index as of the week July 26, 2021 compared with normal, by census
consolidated subdivision for Eastern Canada

Wheat production expected to decrease on lower harvested area and yields
Nationally, wheat production is projected to decrease 34.8% year over year to 22.9 million tonnes in 2021, on lower
anticipated yields (-28.7% to 37.2 bushels per acre) and less harvested area (-8.5% to 22.7 million acres).

The decrease in wheat area was largely attributable to spring wheat, which in addition to having less seeded area
in 2021, has been impacted by drought conditions in Western Canada.

Durum wheat yields are also expected to fall considerably, while winter wheat, which is predominantly grown in
Ontario, is expected to yield in line with historical averages thanks to better growing conditions within the province.

In Saskatchewan, wheat harvested area is expected to fall 7.9% to 11.8 million acres, while yields are anticipated to
decrease 33.8% to 30.4 bushels per acre to bring total wheat production down 39.1% year over year to 9.7 million
tonnes.

Wheat yield in Alberta is expected to decrease 41.0% to 32.9 bushels per acre in 2021, while harvested area is
projected to fall 7.0%, resulting in a 45.2% production decrease to 6.1 million tonnes.

Wheat production in Manitoba is projected to fall 24.1% to 4.0 million tonnes in 2021, the result of lower harvested
area (-17.2% to 2.6 million acres) and lower yields (-8.3% to 56.2 bushels per acre).

Wheat production in Ontario (the majority of which is winter wheat) is projected to rise 8.9% to 2.7 million tonnes
year over year, on increased harvested acres (+2.3%) and yields (+6.4%).

                                    Component of Statistics Canada catalogue no. 11-001-X                            5
The Daily, Monday, August 30, 2021 Lower anticipated yields push canola production to lowest level since 2012 Nationally, canola production is expected to fall 24.3% to 14.7 million tonnes in 2021, as drought conditions on the Prairies drove yields to their lowest level in a decade (-30.1% to 29.2 bushels per acre), offsetting higher harvested area (+8.1% to 22.2 million acres). If this were to happen, this would be the lowest canola production since 2012. Canola production in Saskatchewan is expected to decrease 32.8% to 7.4 million tonnes. Lower yields (-36.8% to 27.0 bushels per acre) are expected to offset the increase in harvested area (+6.3% to 12.0 million acres). In 2021, Alberta is expected to produce 14.0% less canola for a total of 4.5 million tonnes. Yields are projected to decrease 25.9% to 29.8 bushels per acre, while harvested area is expected to rise 16.0% to 6.6 million acres. In Manitoba, yield is expected to fall 14.5% to 35.4 bushels per acre and harvested area to edge up 0.1% to 3.4 million acres, resulting in a 14.4% production decrease. Corn for grain production projected to increase on higher yields Nationally, corn for grain production is projected to increase 0.8% to 13.7 million tonnes in 2021, with yields anticipated to rise to 158.4 bushels per acre. Meanwhile, harvested area is expected to fall 2.3% to 3.4 million acres. In Ontario, the largest corn for grain–producing province, production is expected to rise 1.7% to 9.1 million tonnes, on higher yields (+3.4% to 169.4 bushels per acre). This would offset lower harvested area, which is expected to fall 1.6% to 2.1 million acres. Corn for grain production in Quebec is projected to rise 7.8% to 3.5 million tonnes. Yields are expected to increase 8.8% to 157.4 bushels per acres, while harvested area is expected to decline 0.8% to 880,300 acres. Soybean production expected to fall despite greater harvested area At the national level, soybean production is projected to decrease 8.4% year over year to 5.8 million tonnes in 2021. The main source of this decline is lower yields, which are expected to decrease 12.5% to 40.5 bushels per acre, while harvested area is anticipated to rise 4.8% to 5.3 million acres. Farmers in Ontario are projected to produce 1.6% fewer soybeans in 2021 for a total of 3.8 million tonnes. Harvested area is expected to rise 3.2% to 2.9 million acres, while yield is anticipated to decrease 4.7% to 48.3 bushels per acre. In Manitoba, soybean production is projected to decrease 30.8% to 804 700 tonnes in 2021, while harvested area is expected to increase 13.5% to 1.3 million acres. However, yields are projected to fall 39.1% year over year to 22.7 bushels per acre this year, due to dry conditions in the province. In Quebec, soybean production is projected to decrease 8.0% to 1.1 million tonnes on lower yields (-12.0% to 42.6 bushels per acre), which will more than offset the projected 4.5% increase in harvested area. Barley and oat production projected to fall due to dry conditions Barley production is expected to fall 27.0% year over year to 7.8 million tonnes in 2021. Despite higher anticipated harvested area (+7.8% to 7.5 million acres), lower yields (-32.3% to 48.1 bushels per acre) due to hot, dry conditions are expected to push national production lower. Oat production is projected to fall 32.9% to 3.1 million tonnes. Harvested area is expected to decrease 14.2% to 2.8 million acres and yields are expected to drop 21.8% year over year to 71.4 bushels per acre in 2021. 6 Component of Statistics Canada catalogue no. 11-001-X
The Daily, Monday, August 30, 2021

   Note to readers
   This release provides the preliminary production estimates for 2021, as well as revised production data for 2020, if applicable. The
   estimates are produced using model-based data.

   The approaches used to produce these estimates are in line with the AgZero initiative underway at Statistics Canada, which aims to
   produce high-quality estimates using modelling, administrative data, and other non-traditional, survey-based approaches.

   The Field Crop Reporting Series collects data from Quebec, Ontario, Manitoba, Saskatchewan and Alberta for all occasions during the
   crop year (from March to December). However, data are collected twice a year (in the June Field Crop Survey on seeded areas and in the
   November Field Crop Survey on final crop production) for Newfoundland and Labrador, Prince Edward Island, Nova Scotia, New
   Brunswick and British Columbia, which represent between 2% and 4% of national totals.

   As of July 2014, July production estimates for these provinces are calculated using the final estimates of the last three crop years. The
   harvested area is first estimated based on the ratio obtained from the sum of harvested areas of the last three years to the sum of the
   seeded areas of the last three years. This average ratio is applied to their current year's seeded acreage from the June survey. This
   harvested area is then multiplied by the average yield of the last three years to estimate production.

   Final production estimates for 2021 will be released on December 3, 2021, and are subject to revision for two years.

   On September 14, 2021, Statistics Canada will release updated modelled yield and production estimates for field crops in Canada as of
   August 31, 2021. These data are derived from remote sensing, survey and agroclimatic data sources.

   July model-based data were used to produce estimates of crop yield and production in Manitoba and Saskatchewan using parcel-level
   crop insurance data, while Alberta, Ontario and Quebec are modelled at the census agricultural region level. For more information on
   July's model-based data, please visit An Integrated Crop Yield Model Using Remote Sensing, Agroclimatic Data and Crop Insurance Data.

   Additional data sources

   Readers are invited to visit the Crop Condition Assessment Program web application, which is an additional tool to assess the growing
   conditions of field crops during the crop year. Readers can monitor a vegetation index of crop land on a weekly basis.

   "Crop Reporting Survey at a Glance," an easy-to-print chart that provides an overview of the survey cycle, is now available.

Table 1
July estimates of production of principal field crops
                                                               2019                   2020                   2021         2019 to 2020         2020 to 2021

                                                                      thousands of tonnes                                           % change
Totalwheat1                                                  32 670                 35 183                 22 948                    7.7              -34.8
  Durum wheat                                                 5 017                  6 571                  3 998                   31.0              -39.2
  Spring wheat                                               25 952                 25 842                 16 102                   -0.4              -37.7
  Winter wheat                                                1 701                  2 770                  2 847                   62.9                2.8
Barley                                                       10 383                 10 741                  7 836                    3.4              -27.0
Canola                                                       19 912                 19 485                 14 749                   -2.1              -24.3
Chick peas                                                      252                    214                     63                  -14.8              -70.6
Corn for grain                                               13 404                 13 563                 13 677                    1.2                0.8
Dry field peas                                                4 237                  4 594                  2 627                    8.4              -42.8
Fall rye                                                        326                    475                    433                   45.9               -8.9
Flaxseed                                                        486                    578                    416                   18.9              -28.1
Lentils                                                       2 382                  2 868                  1 979                   20.4              -31.0
Mustard seed                                                    135                     99                     79                  -26.6              -20.1
Oats                                                          4 227                  4 576                  3 070                    8.2              -32.9
Soybeans                                                      6 145                  6 359                  5 823                    3.5               -8.4
1. The "Total wheat" category represents the sum of winter wheat, spring wheat and durum wheat.
Note(s):
  The estimates in this table have been rounded to the nearest thousand. The percentage changes reflect the unrounded estimates.
  Wheat types may not add up to total wheat as a result of rounding.
Source(s): Table 32-10-0359-01.

                                                Component of Statistics Canada catalogue no. 11-001-X                                                    7
The Daily, Monday, August 30, 2021
Available tables: table 32-10-0359-01.
Definitions, data sources and methods: survey number 3401.
For more information, or to enquire about the concepts, methods or data quality of this release, contact us
(toll-free 1-800-263-1136; 514-283-8300; STATCAN.infostats-infostats.STATCAN@canada.ca) or Media
Relations (613-951-4636; STATCAN.mediahotline-ligneinfomedias.STATCAN@canada.ca).
8 Component of Statistics Canada catalogue no. 11-001-XYou can also read