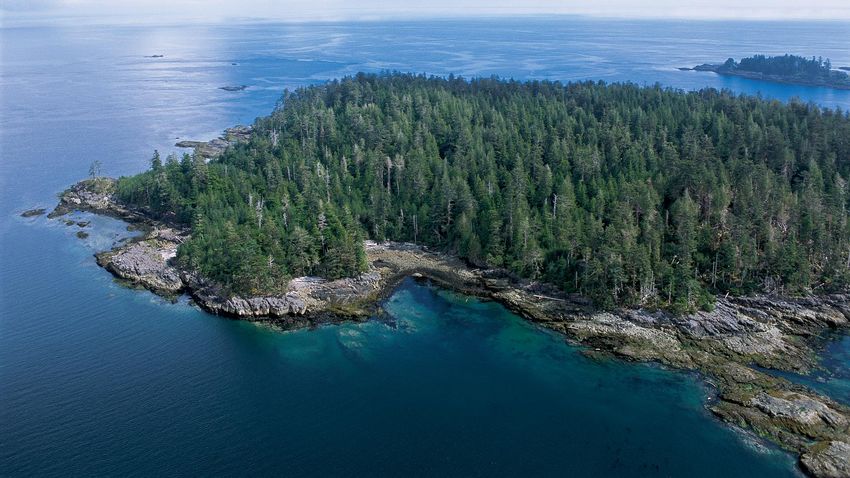
COVID-19 Research Roundup - June 21, 2021 Haida Gwaii, Northern British Columbia - Destination BC
←
→
Page content transcription
If your browser does not render page correctly, please read the page content below
COVID-19 Research Roundup
June 21, 2021

                                                           1
                        Haida Gwaii, Northern British Columbia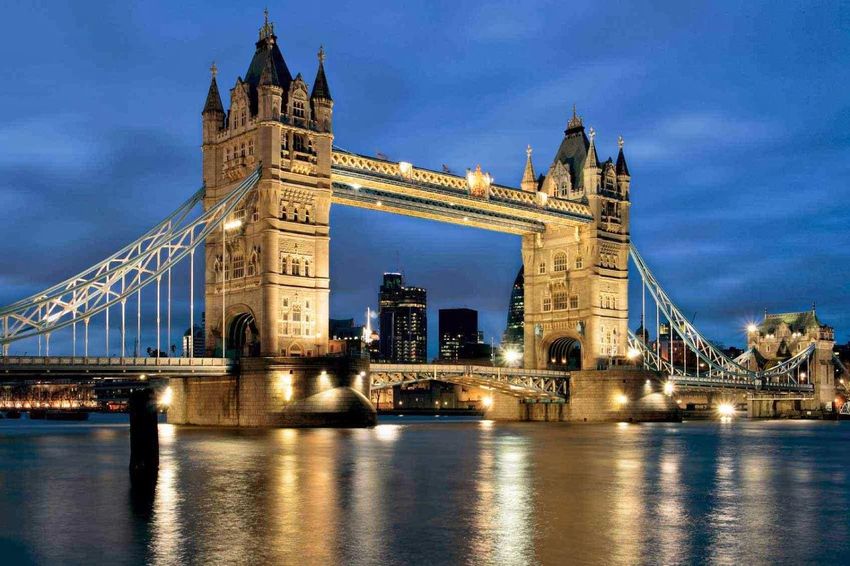
Destination BC is rounding up relevant research and articles each week related to
the travel and tourism industry and COVID-19.
Last week in brief:
•   Destination Canada reports 76% of BC residents feel safe travelling to other communities in their
    province
•   30% of BC residents say they intend to travel elsewhere in the province in the next 4 weeks
•   BC weekly domestic overnight visitation is up +3.4% from the previous week
•   BC sees a decrease of -4.6% in weekly domestic overnight visitation compared to the same period in
    2020
•   Environics Visitor View reports total visitor nights spent in BC in April 2021 up +33.7% compared to
    April 2020
•   BC’s occupancy rate (38.7%) up +0.7 points from the previous week
•   BC’s average daily rate ($141.10) up +1.1% from the previous week
•   BC’s RevPAR ($54.56) up +3.1% from the previous week
•   Tourism HR Canada shows that tourism employment in BC in May 2021 was up +36.1% from May 2020
•   Leger shows that 78% of Americans support reopening the US / Canada border this summer
•   Destination Analysts shows that 53.8% of US travellers do not intend to change the way they travel
    after the pandemic
•   Skift reveals that 38% of Americans say their vaccination status will not affect their travel plans
•   UNWTO reports that Canada has vaccinated 66.4 out of every 100 people
•   A summary of compelling tourism headlines from around the world
                                                                                                          2
•   Tourism and COVID-19 dashboard and reporting resources
BC’s Restart Plan

We are in Step 2 of BC’s Restart Plan, a 4-               On May 18, 2021, Canadian and US
                                                          officials agreed to extend the closure
step plan launched on May 25, 2021. The                   of the border between the two
earliest date to progress to Step 3 is July 1.            countries to non-essential travel until
                                                          at least July 21, 2021.
Province-wide restrictions
Step 2 of BC’s Restart Plan marks the return of
provincial travel for BC residents. Restrictions on       Information provided in this Research
                                                          Roundup Report highlights not only
interprovincial travel and health and safety
                                                          local insights, but global insights which
protocols, such as mask wearing and physical              may be applicable to BC now.
distancing, remain in place until Step 3 (July 1 at the
earliest). Many of the insights noted in this
Research Roundup were gathered before the
beginning of Step 2 on June 15, 2021.

                                                                                                      3
Destination Canada reports 76% of BC residents feel safe travelling to other
communities in their province

• In Destination Canada’s latest Resident Sentiment
  report (June 15, 2021), 76% of BC residents said
  they would feel safe travelling to other
  communities in their province. This is lower than
  Alberta (85%), Atlantic Canada (83%) and Quebec
  (79%), but higher than Ontario (72%) and
  Saskatchewan/Manitoba (70%).

• 85% of BC residents would feel safe travelling to
  nearby communities. This is below Alberta (88%)
  and Atlantic Canada (89%).

• 47% of BC residents stated they would feel safe
  travelling to other provinces or territories in
  Canada. This is lower than Alberta (66%), Quebec
  (58%), Saskatchewan/Manitoba (54%), and               Green = Significant Increase From Previous Wave
                                                        Red = Significant Decrease From Previous Wave
  Ontario (54%), but higher than Atlantic Canada
  (40%).

                                                      Source: Destination Canada’s Weekly COVID-19 Resident Sentiment, June 15, 2021

                                                                                                                                       4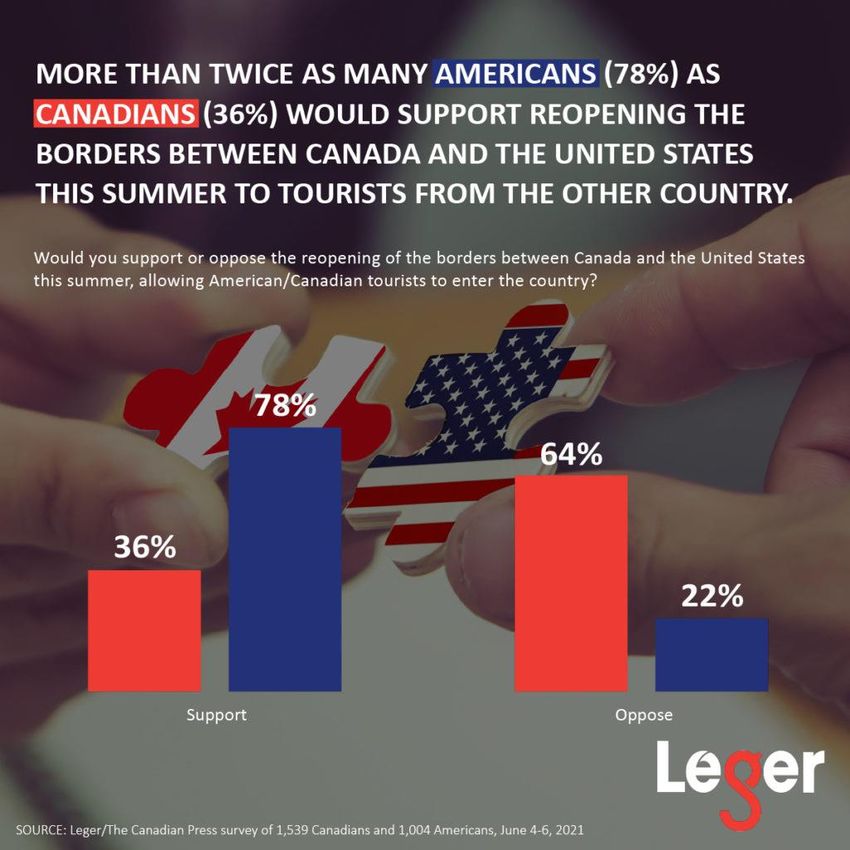
30% of BC residents say they intend to travel elsewhere in the province in
the next 4 weeks
• In Destination BC’s latest BC
  Residents’ Public Perceptions Wave
  27 (June 10, 2021) report, 30% of BC
  residents said they intend to travel
  elsewhere in the province in the next
  4 weeks, up +4% from the previous
  wave (May 26).

• 68% of BC resident said they intend
  to travel to nearby communities in
  the next 4 weeks (+7% from previous
  wave) and 6% of BC residents said
  they intend to travel to other parts of
  Canada (+1% from previous wave).

                                            Source: Destination BC’s Residents’ Public Perceptions: COVID-19 Travel and Tourism Wave 27,
                                            Insights West, June 10, 2021                                                                   5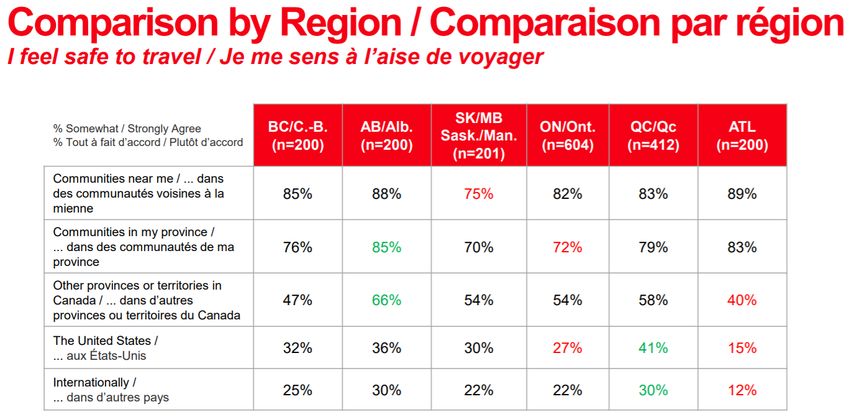
BC weekly domestic overnight visitation is up +3.4% from the previous week

                                                                                       BC's Domestic Overnight Visitation
• According to Environics Analytics Weekly COVID                                       Week-over-Week Percent Change
  Tracker Report, during the week ending June 13,
  2021, BC experienced a week-over-week             80%
  increase of +3.4% in weekly domestic overnight
  visitation.                                       60%

• Week-over-week increases in domestic overnight
  visitation were seen in three tourism regions     40%

  across the province:
                                                    20%
      •   Thompson Okanagan (+13.7%)
                                                                                                                                                     +3.4%
      •   Northern BC (+8.0%)
                                                     0%
      •   Vancouver Island (+8.0%)

•   Week-over-week decreases in domestic            -20%

    overnight visitation were seen in the other
    three tourism regions:                          -40%
                                                           24-Jan   07-Feb   21-Feb   07-Mar   21-Mar   04-Apr   18-Apr   02-May   16-May   30-May   13-Jun
      •   Vancouver, Coast & Mountains (-3.4%)
      •   Kootenay Rockies (-11.1%)
      •   Cariboo Chilcotin Coast (-12.9%)
                                                      Source: Environics Analytics Weekly COVID Tracker Report, June 13, 2021                                 6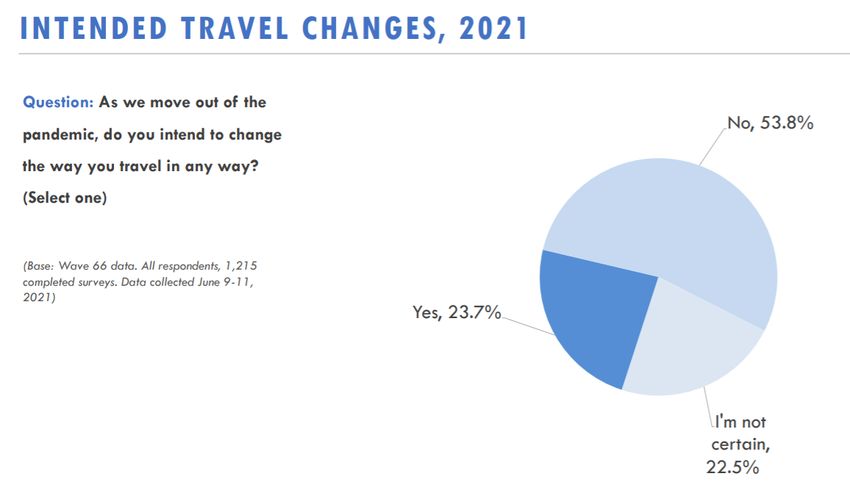
BC and Regional Domestic Overnight Visitation Week-over-Week Percent Change
120%                                                      British Columbia               120%   British Columbia
 90%                                                      Vancouver, Coast & Mountains    90%   Cariboo Chilcotin Coast

 60%                                                                                      60%
 30%                                                                                      30%
  0%                                                                                       0%
-30%                                                                                     -30%
-60%                                                                                     -60%

120%                                                       British Columbia                     British Columbia
                                                           Vancouver Island              120%   Kootenay Rockies
90%
                                                                                         90%
60%
                                                                                         60%
30%
                                                                                         30%
 0%                                                                                       0%
-30%                                                                                     -30%

-60%                                                                                     -60%

120%                                                      British Columbia               120%   British Columbia
 90%                                                      Thompson Okanagan
                                                                                          90%   Northern BC
 60%
                                                                                          60%
 30%
                                                                                          30%
  0%
                                                                                           0%
-30%
                                                                                         -30%
-60%
                                                                                         -60%

                                                                                                                          7
 Source: Environics Analytics Weekly COVID Tracker Report, June 13, 2021
BC sees a decrease of -4.6% in weekly domestic overnight visitation
compared to the same period in 2020
BC's Domestic Overnight Visitation
Year-over-Year Percent Change
150%
• For the week ending June 13, 2021, Environics Analytics reported % change from 2020
that weekly domestic overnight visitation was down -4.6% % change from 2019
compared to the same week in 2020. Compared to the same week 100%
in 2019, weekly domestic overnight visitation was down -39.5%.
50%
• In two of the tourism regions across the province, year-over-year
increases in weekly visitation were seen when compared to the
same period in 2020. All regions saw a decreases in weekly 0%
visitation when compared to the same period in 2019. -4.6%
• Northern BC (+10.6% over 2020; -23.2% over 2019) -50% -39.5%
• Vancouver Island (+1.8%; -44.9%)
• Kootenay Rockies (-4.9%; -1.1%)
-100%
• Vancouver, Coast & Mountains (-6.1%; -52.2%)
• Thompson Okanagan (-10.8%; -40.3%)
• Cariboo Chilcotin Coast (-33.7%; -34.4%)
Source: Environics Analytics Weekly COVID Tracker Report, June 13, 2021
8Regional Domestic Overnight Visitation Year-over-Year Percent Change
300% Vancouver, Coast & Mountains 300% Cariboo Chilcotin Coast
% change from 2020 % change from 2020
200% % change from 2019 200%
% change from 2019
100% 100%
0% 0%
-100% -100%
300% Vancouver Island 300% Kootenay Rockies % change from 2020
% change from 2019
% change from 2020 200%
200%
% change from 2019
100% 100%
0% 0%
-100% -100%
Thompson Okanagan 300%
Northern BC
300% % change from 2020
% change from 2020
% change from 2019 200% % change from 2019
200%
100% 100%
0% 0%
-100% -100%
9
Source: Environics Analytics Weekly COVID Tracker Report, June 13, 2021Environics Visitor View reports total visitor nights spent in BC in April
2021 was up +33.7% compared to April 2020
• According to Environics Analytics Visitor Total Nights Spent In BC
British Columbia
View, total visitor nights spent in BC by % Change Over 2019 By Visitor Origin
Canadians in April 2021 was up +33.7% Alberta
compared to April 2020, but down -49.2% Ontario
compared to April 2019. 20%
All Canada
• BC visitor nights are counted as anyone 0%
who is more than 60 kilometres from their
BC home for an overnight trip, and was up -20%
+49.7% compared to April 2020, but down
-34.4%
-43.1% compared to April 2019. -40%
-43.1%
• Ontario visitors nights was down -63.7% -49.2%
-60%
compared to April 2019, whereas Alberta
-63.7%
visitor nights was down -34.4%.
-80%
-100%
Source: Environics Analytics VisitorView , April 2021 10BC’s occupancy rate (38.7%) up +0.7 points from the previous week
• STR, an agency which reports BC’s Provincial Weekly Occupancy
hotel performance, shows the average Mar 27, 2021 - Jun 12, 2021
weekly occupancy for BC was 38.7% 90%
for the week of June 6 – 12, 2021. This
80% 79.8%
represents an increase of +0.7 points
from the previous week. 70%
60%
• It also represents an increase of +11.5
50%
points compared to a similar period in
2020 and a decrease of -41.1 points 40% 38.7%
compared to 2019. 30%
27.2%
20%
10%
0%
27-Mar 3-Apr 10-Apr 17-Apr 24-Apr 1-May 8-May 15-May 22-May 29-May 5-Jun 12-Jun
2021 2020 2019
*Please note data for 2019 is only available starting for the week April 7 - 13, 2019
Source: 2021 STR, STR Global Ltd - STR Jun 6 – 12, 2021 11British Columbia’s Hotel Occupancy Rate Week-over-Week
Week-over-Week 2021 vs. 2020 2021 vs. 2019
Jun 6 - 12, 2021
Jun 6 - 12, 2021 vs. Jun 6 - 12, 2021 vs. Jun 6 - 12, 2021 vs.
May 30 – Jun 5, 2021 Jun 7 - 13, 2020 Jun 9 - 15, 2019
Occupancy Rate
Occupancy Point Change Occupancy Point Change Occupancy Point Change
British Columbia 38.7% +0.7 +11.4 -41.1
Vancouver
(City of)
24.8% +1.3 +11.9 -68.1
Whistler 15.1% +2.6 +0.3 -53.0
Victoria 24.9% -0.1 +2.1 -53.6
Kelowna 38.5% +2.0 +13.6 -41.5
Kamloops 55.3% -1.0 +26.1 -28.6
Richmond 63.9% -2.2 +23.1 -22.4
Revelstoke 26.2% -0.5 -6.9 -34.9
12
Source: 2021 STR, STR Global Ltd - STR Jun 6 – 12, 2021BC’s average daily rate ($141.10) up +1.1% from the previous week
• STR, an agency which reports BC’s Provincial Weekly ADR
hotel performance, shows BC’s Mar 27, 2021 - Jun 12, 2021
average daily rate (ADR) was $141.10 $250
for the week of June 6 – 12, 2021. This
represents an increase of +1.1% from $223.05
the previous week. $200
• It also represents an increase of
$150
+17.6% compared to a similar period $141.10
in 2020 and a decrease of -36.7% $120.00
compared to 2019. $100
$50
$-
27-Mar 3-Apr 10-Apr 17-Apr 24-Apr 1-May 8-May 15-May 22-May 29-May 5-Jun 12-Jun
2021 2020 2019
*Please note data for 2019 is only available starting for the week April 7 - 13, 2019
Source: 2021 STR, STR Global Ltd - STR Jun 6 – 12, 2021 13British Columbia’s Hotel Average Daily Rate (ADR) Week-over-Week
Week-over-Week 2021 vs. 2020 2021 vs. 2019
Jun 6 - 12, 2021
Jun 6 - 12, 2021 vs. Jun 6 - 12, 2021 vs. Jun 6 - 12, 2021 vs.
May 30 – Jun 5, 2021 Jun 7 - 13, 2020 Jun 9 - 15, 2019
ADR
ADR Percent Change ADR Percent Change ADR Percent Change
British Columbia $141.10 +1.1% +17.6% -36.7%
Vancouver
(City of)
$182.54 -1.6% +34.2% -45.7%
Whistler $227.14 +6.4% +33.6% +2.5%
Victoria $154.02 +5.0% +30.3% -32.3%
Kelowna $139.21 +1.9% +11.8% -18.9%
Kamloops $104.02 +2.3% +9.9% -16.1%
Richmond $165.67 -1.5% +20.9% -23.2%
Revelstoke $107.15 +2.3% +3.6% -8.6%
14
Source: 2021 STR, STR Global Ltd - STR Jun 6 – 12, 2021BC’s RevPAR ($54.56) up +3.1% from the previous week
• STR, an agency which reports BC’s hotel
performance, shows BC’s revenue per Week-over-Week 2021 vs. 2020
available room (RevPAR) was $54.56 for Jun 6 - 12, 2021
Jun 6 - 12, 2021 vs. Jun 6 - 12, 2021 vs.
the week of June 6 – 12, 2021. This
May 30 – Jun 5, 2021 Jun 7 - 13, 2020
represents an increase of +3.1% from the RevPAR
previous week. RevPAR Percent Change RevPAR Percent Change
• BC’s RevPAR showed an increase British Columbia $54.56 +3.1% +67.0%
(+67.0%) for the week of June 6 – 12,
Vancouver
2021 compared to a similar period in (City of)
$45.21 +3.7% +158.6%
2020 and a decrease (-69.4%) compared
to 2019.
Whistler $34.26 +29.0% +36.5%
Victoria $38.41 +4.7% +42.4%
• RevPAR substantially increased for all Kelowna $53.59 +7.4% +72.6%
reported cities (except Revelstoke)
compared to a similar period in 2020 but Kamloops $57.52 +0.6% +108.4%
remain below 2019 levels. Richmond $105.93 -4.8% +89.2%
Revelstoke $28.12 +0.5% -18.0%
Source: 2021 STR, STR Global Ltd - STR Jun 6 – 12, 2021
15Tourism HR Canada shows that tourism employment in BC in May 2021 was
up +36.1% from May 2020
• According to Tourism HR Canada, tourism
employment in BC in May 2021 grew to
278,500, up +4.0% from April 2021, and up
+36.1% from May 2020.
• The same dashboard shows that the
unemployment rate in the tourism industry in
Canada shrank to 9.8% in May 2021, down from
29.8% in May 2020.
• More information can be found here: Tourism
Employment Tracker
Source: Tourism HR Canada, Tourism Employment Tracker, June 21, 2021
16Leger shows that 78% of Americans support reopening the US / Canada
border this summer
• According to Leger, more than twice as
many Americans (78%) as Canadians (36%)
would support reopening the US / Canada
border this summer to visitors from the
other country.
• Support amongst Canadians for opening the
border is highest in Alberta (51% support)
and BC (40% support). Support is lowest in
Atlantic Canada (21% support) and
Manitoba/Saskatchewan (33% support).
• View the full survey here: Leger’s North
American Tracker
Source: Leger, North American Tracker, June 8, 2021
17Destination Analysts shows that 53.8% of US travellers do not intend to
change the way they travel after the pandemic
• The latest webinar by Destination Analysts,
a US-based tourism research company,
showed that 23.7% of American travellers
intend to change the way they travel after
the pandemic compared to 53.8% who do
not. 22.5% of American travellers are
unsure if the pandemic will change the way
they travel.
• The same webinar reported that 18.2% of
all Americans made travel reservations in
the last week.
• View the full webinar here: Update on
COVID-19’s Impact on American Travel
Source: Destination Analysts, Update on American Travel Trends & Sentiment, June 14, 2021
18Skift reveals that 38% of Americans say their vaccination status will not affect
their travel plans
• The June release of Skift’s Travel Tracker
revealed that 38% of Americans said their
vaccination status won’t affect their travel
plans whatsoever (up +20% from April 2021).
17% of Americans said their vaccination status
won’t affect their travel plans until case
numbers go down to a very safe level (down -
14%).
• 22% of Americans say they will travel a lot
more after getting the vaccine (up +7% from
April 2021) , while 23% said they will travel
somewhat more (down -13%).
Source: Skift US Travel Tracker, June 2021
19UNWTO reports that Canada has vaccinated 66.4 out of every 100 people
• According to the UNWTO, as of June 19, Canada has
vaccinated (with at least one dose) 66.4 out of every
100 people, compared to the US which has
vaccinated 52.9 out of every 100 people. Japan has
vaccinated 16.4 out of every 100 people.
• The same dashboard shows that the global average
for vaccination rates (with at least one dose) is now
at 21.7 per 100 people.
• For up-to-date information on health indicators, air
travel, and destination regulations, visit the
UNWTO/IATA Destination Tracker dashboard.
Source: UNWTO/IATA, June 19, 2021
20A summary of compelling tourism headlines from around the world
We’ve included some of the most compelling tourism
headlines from around the world:
• Tourism growth contributes to UK economic
recovery (Breaking Travel News)
• US updates travel advisory levels for destinations
in Mexico (Travel Pulse)
• Israel welcomes first post-Covid-19 tour group
(Breaking Travel News)
• Germany reopening to vaccinated American
tourists from June 25 (Travel Pulse)
21Tourism and COVID-19 dashboard and reporting resources
• Destination BC’s Tourism Industry Dashboard tracks statistics across tourism-related industries
including accommodations, food and beverage, and transportation.
• Destination BC conducts and commissions general research and insights related to travel and
tourism in British Columbia, as well as COVID-19 Research and Insights.
• The UNWTO has a tourism recovery tracker, the most comprehensive tourism dashboard to
date. The UNWTO also has an online dashboard of international statistics on the impact of
COVID-19 on the tourism sector.
• MPI has created a coronavirus resource page that compiles meetings and events information as
well as links to several other resources helpful to the Business Events segment in our industry.
• The BC Tourism Resiliency Network hosts tourism impact reports and travel pattern studies.
• The Travel and Tourism Research Association links to many research and analytics companies on
their COVID-19 Resource Centre.
• The Business Council of BC Dashboard allows users to quickly understand the economic toll,
recovery, and economic climate of BC.
• The Ipsos Consolidated Economic Indicators dashboard displays economic indicators across the
globe including investment, employment, and GDP.
• Phocuswire has restarted their COVID-19 liveblog, covering the pandemic’s impact and recovery
22
in the tourism industry.This report can be found online on the
Destination BC Research & Insights COVID-19 webpage
Research & Analytics
TourismResearch@DestinationBC.ca
23You can also read