PROPOSED PROJECTS TO EXPORT US LNG BY SHIP ARE STUCK WITH A SHALLOW POOL OF INVESTORS - Global Energy Monitor
←
→
Page content transcription
If your browser does not render page correctly, please read the page content below
Global
          Energy
          Monitor

Gas Run Aground

2022             TC 8, E
                             D
PROPOSED PROJECTS TO EXPORT US LNG BY SHIP

                     ho 2
                           s
                   –5 02
ARE STUCK WITH A SHALLOW POOL OF INVESTORS
              . U ch O

                        ur
             m r G

                      2
           a. Ma R

                         Robert Rozansky
         00 til B
                   A
   EM
un      6:

 GLOBAL ENERGY MONITOR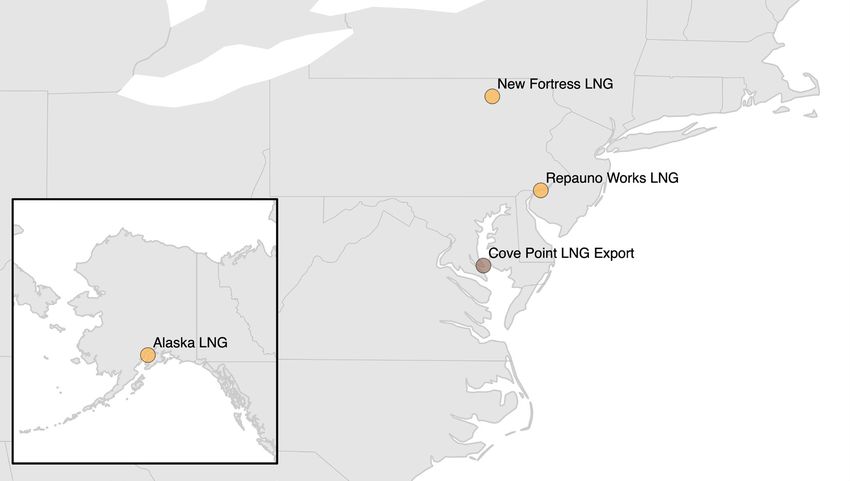
GAS RUN AGROUND

           Global                                                 ABOUT THE COVER
           Energy                                                 The cover photo shows an unloading LNG tanker. Image
           Monitor                                                from Adobe Stock.
 ABOUT GLOBAL ENERGY MONITOR
 Global Energy Monitor (GEM) develops and shares informa-         AUTHOR
 tion on energy projects in support of the worldwide move-        Robert Rozansky is a research analyst at Global Energy
 ment for clean energy. Current projects include the Global       Monitor.
 Coal Mine Tracker, Global Coal Plant Tracker, Global Gas

                                 D
 Infrastructure Tracker, Global Fossil Infrastructure Tracker,    EDITING, PRODUCTION, AND OTHER CONTRIBUTIONS
 Europe Gas Tracker, CoalWire newsletter, Global Gas Plant
                                                                  Editing and/or writing contributions from Ted Nace, Greig
 Tracker, Global Registry of Fossil Fuels, Global Steel Plant
                                                                  Aitken, James Browning, Mason Inman, Julie Joly, and

                     TC 8, E
 Tracker, Latin America Energy Portal, and GEM.wiki.

                         ho 2
                                                                  Kasandra O’Malia. Design and page layout by David Van Ness.

                               s
                                                                  Maps created by Scott Zimmerman. Environmental justice
 ABOUT THE GLOBAL GAS

                       –5 02
                  . U ch O
                                                                  analysis (Figure 9) conducted by Kasandra O’Malia. Pro-

                            ur
 INFRASTRUCTURE TRACKER (GGIT)                                    fundo’s financial analysis led by Léa Pham Van and Ward
 The Global Gas Infrastructure Tracker (GGIT) is an online        Warmerdam. The author would also like to acknowledge the
 database that identifies, maps, describes, and categorizes       contributions of Clark Williams-Derry, Brad Williams, Naomi
                 m r G

                          2
 natural gas transmission pipelines and LNG terminals.            Yoder, Robin Saha, and Paul Mohai.
 Originally released by GEM in January 2018 as the Global
 Fossil Infrastructure Tracker (GFIT), the pipelines and          PERMISSIONS/COPYRIGHT
               a. Ma R
 terminals data are now within GGIT and are updated twice         This publication may be reproduced in whole or in part and
 annually. The tracker uses footnoted wiki pages to document      in any form for educational or nonprofit purposes without
 each pipeline or terminal. For further details see the tracker   special permission from the copyright holders, provided
                       A

 landing page and methodology overview.                           that acknowledgement of the source is made. No use of this
                                                                  publication may be made for resale or other commercial
                                                                  purpose without the written permission of the copyright
             00 til B

                                                                  holders. Copyright © March 2022 by Global Energy Monitor.

                                                                  FURTHER RESOURCES
   EM

                                                                  For additional data on proposed and existing LNG terminals
                                                                  and natural gas pipelines, see Summary Tables. For links
                                                                  to reports based on GGIT data, see Reports & Briefings.
                                                                  To obtain primary data from the GGIT, visit the Download
                                                                  Data page.
un         6:

 GLOBAL ENERGY MONITOR                                                                           REPORT | MARCH 2022 | 2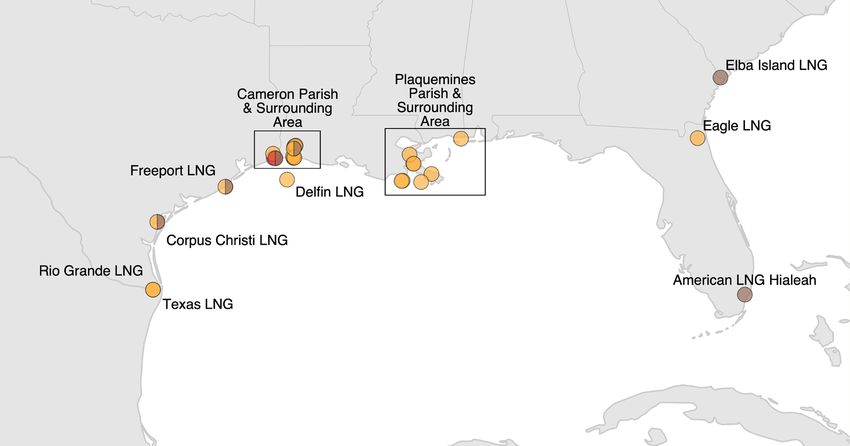
Global
                                                                                                         Energy
                                                                                                         Monitor

 Gas Run Aground
 PROPOSED PROJECTS TO EXPORT US LNG BY SHIP
 ARE STUCK WITH A SHALLOW POOL OF INVESTORS

                             D
 Robert Rozansky

                 TC 8, E

                     ho 2
                           s
                   –5 02
              . U ch O

                        ur
             EXECUTIVE SUMMARY
             m r G

                      2
             The United States has seen a new wave of proposed facilities to export liquefied nat-
             ural gas (LNG) to international markets, but these projects face daunting challenges.
           a. Ma R

             Of 21 proposed export terminals in the United States, nearly all have struggled to
             secure the offtake contracts and financing needed to get built. New US LNG export
                   A

             terminals are confronting economic headwinds on multiple fronts including com-
             petition from lower-priced producers, a volatile gas market, and skepticism from cli-
             mate-conscious governments and investors. These forces threaten to deter investors
         00 til B

             outright or, if projects are built, increase the risk that they will be unable to recover
             long-term returns on investment.
   EM

             This report focuses on 21 LNG export terminals that are currently proposed in the
             United States, none of which have yet reached a final investment decision (FID). The
             report draws on an annual survey of midstream gas infrastructure conducted by
             Global Energy Monitor (GEM) along with research of financial databases. It includes
             the following highlights:

             ■   No proposed US LNG export terminals reached FID or advanced to the con-
un

                 struction phase in 2021.

             ■   New LNG export projects have received few of the purchasing commitments
                 needed to demonstrate to potential financiers and investors that their prod-
                 uct will find buyers. Securing offtake contracts from oil and gas traders, utility
                 companies, and other entities is a prerequisite to attracting financing. Companies
                 have only secured purchasing agreements publicly linked to four new projects,
        6:

                 out of 21 total. Of the four projects with offtake contracts, two are still far from
                 demonstrating that a substantial share of production will be anchored with long-
                 term commitments.

             ■   Few institutions are directly financing proposed LNG export terminals. Of the
                 21 proposed terminals, GEM has identified only three that have received direct

 GLOBAL ENERGY MONITOR                                                                     REPORT | MARCH 2022 | 3
GAS RUN AGROUND
project finance. Total project finance identified for these terminals amounts to
US$1.6 billion, a drop in the bucket compared to the total cost of all projects esti-
mated at around US$244 billion.
■ US and Japanese institutions are leading financiers in the US LNG buildout. An
in-depth financial analysis of six proposed terminals that are considered to have
a higher chance of moving forward finds that Japan’s SMBC Group, Mitsubishi
UFJ Financial, and Mizuho Financial are leading creditors for these US LNG proj-
D
ects. The United States’ BlackRock and Vanguard are leading bond and sharehold-
ers in the projects and their sponsors.
TC 8, E
ho 2
■ US LNG projects face stiff market headwinds and regulatory challenges. New
s
LNG projects now face a daunting set of challenges including (1) competition
–5 02
. U ch O
from lower priced producers such as Qatar; (2) domestic concerns over LNG
ur
exports raising gas prices; (3) recognition of the disproportionate impact of LNG
terminals on low income communities and communities of color; (4) increased
m r G
2
scrutiny from regulators and permitting challenges over environmental and
community impacts; (5) international climate commitments inconsistent with
increased LNG exports; (6) loss of social license internationally due to growing
a. Ma R
alarm over climate change; (7) volatile gas prices; (8) uncertain demand among
Asian and European buyers; (9) a shift away from long-term LNG contracts across
international gas markets; and (10) investors concerned that gas projects will be
A
economically and environmentally untenable in the long run.
00 til B
■ Increased US LNG exports are incompatible with efforts to avoid dangerous
climate change. The International Energy Agency and others have called for
global LNG exports to peak in the mid-2020s for the world to remain on an emis-
EM
sions pathway consistent with limiting global warming to 1.5°C. An analysis by
Oil Change International found that the combined lifecycle emissions of 19 of the
proposed terminals would be 1 gigatonne of carbon dioxide equivalent per year,
approximately the annual emissions of 250 coal plants.
■ Many new US LNG terminals are proposed near communities that are already
struggling with industrial pollution. Export terminals could further impact
un
these communities, many of which have high proportions of low-income people
and people of color, due to air pollution, fire and explosion risks, harm to local
industries such as fishing and tourism, and other impacts. Of proposed termi-
nal sites near populated areas, the majority have pre-existing air quality issues
according to the U.S. Environmental Protection Agency.
■ Despite recent spikes in international LNG prices, new US LNG projects still
6:
face significant headwinds. International demand is uncertain, high prices have
highlighted financial risks for developing economies, and many governments
are questioning LNG due to its climate impacts. An undersupplied market today
may carry a few US projects to completion, but even then, recovering billions in
investment over the coming decades is a risky proposition. Ultimately, invest-
ments in clean energy are likely to be less risky and more sustainable.
GLOBAL ENERGY MONITOR REPORT | MARCH 2022 | 4GAS RUN AGROUND
INTRODUCTION
Surging domestic gas production and high interna- short of what is needed to begin construction. These
tional demand have encouraged US LNG developers proposed projects face serious economic and regula-
to propose dozens of new export LNG facilities largely tory challenges, including competition from cheaper
concentrated along the Gulf Coast. Yet for the last producers such as Qatar; domestic and international
year, US LNG export projects have failed to secure policy concerns with the economic, climate, and
the sales commitments and financing needed to environmental justice impacts of LNG exports; and
D
move toward construction. Of 21 major LNG export uncertain and shifting market conditions that increase
projects proposed in the United States, none reached the risk of long-term investment. Even if projects are
a final investment decision (FID) in 2021. Only two built, these headwinds are indicative of the risks that
TC 8, E
ho 2
have publicly announced firm commitments from LNG projects will face as they attempt to recover bil-
s
buyers for a substantial share of production, and only lions in capital costs selling an economically volatile,
–5 02
. U ch O
ur
three have secured initial direct project financing, in emissions intensive fuel during the transition to a
deals (taken pre-FID) totaling just US$1.6 billion—far low-carbon global economy.
m r G
2
BACKGROUND
The past two decades have seen a rapid transformation While the US LNG industry has demonstrated growth,
a. Ma R
of the United States’ gas industry. Advances in hydrau- new projects remain a risky bet. Even if a few pro-
lic fracturing, or fracking, have enabled producers posed projects advance to construction, they will
A
to ramp up gas production to the highest levels in US face significant economic challenges, not the least of
history. Seeing an opportunity in international mar- which will be recovering billions in construction costs
kets, the gas industry—with extensive support from the by selling fossil fuel over the coming decades as the
00 til B
US government—pushed for expanding the produc- world transitions to clean energy.
tion of liquefied natural gas, or LNG: a supercooled,
Figure 1: US Imports and Exports of Gas and LNG
EM
liquefied form of gas that can be loaded onto tankers
and shipped to more than 130 import terminals now
operating in dozens of countries around the world.1 In
2016, the United States began exporting LNG out of one
terminal in Louisiana. By 2020, the United States was
the third-largest LNG exporter after Qatar and Austra-
lia (EIA 2021f). That year, the United States exported 50
un
million tonnes of LNG, enough to fuel India’s annual
gas consumption and, if burned there, to produce over
150 million tonnes of carbon dioxide equivalent (Mt
CO2e)(EIA 2021c; EIA 2021d).2,3 By December 2021, the
United States was the leading global exporter of LNG,
at least for that month, and it is expected to solidify its
lead this year as facilities already in construction come Source: U.S. Energy Information Administration (2021b, 2021d)
6:
online (IHS Markit 2022).
1. At its destination, LNG can be regasified and burned for electric power or heat, used as a feedstock for industrial processes, or put to other uses.
2. For comparison, 150 Mt CO2 is approximately the annual emissions of 40 coal plants (EPA 2021b).
3. This estimate calculates lifecycle emissions of LNG delivered to Asia using a 100-year global warming potential, following the emissions
calculation methodology in GEM’s briefing “Asia’s Coal Bust Risks Being Followed by a Gas Boom” (GEM 2021a).
GLOBAL ENERGY MONITOR REPORT | MARCH 2022 | 5GAS RUN AGROUND
A New Global Gas Market
US investment in LNG is part of a broader evolution coal power, and turning to gas imports to fuel electric
of the global gas market. Historically, most gas has power, residential and commercial heating, industrial
been traded regionally. Until 2000, the United States processes, and other applications (GEM 2021a). China,
exported only small amounts of gas by pipeline to the world’s leading importer of LNG, is expected
Canada and Mexico (EIA 2021a). The gas industry views to increase its gas demand by over 50% in the next
LNG as an opportunity to develop a more global and decade, from 370 billion cubic meters (bcm) in 2021 to
D
integrated trade, and to lock in higher consumption 600 bcm by 2030, according to analysts at investment
throughout the 21st century. High global LNG con- research house Bernstein (Evans 2021). Asian coun-
sumption well into the middle of the 21st century is at tries are willing—or forced by supply shortages—to
TC 8, E
ho 2
odds with many governments’ stated climate policies pay high prices for gas. In 2020 and 2021, monthly spot
s
and would intensify climate change (See the sidebar prices for LNG in Asia ranged between $2 and $36 per
–5 02
. U ch O
ur
“The Climate Impacts of LNG” on the next page). million British thermal units (MMBtu), compared to
spot prices of $2 to $5.50 on the US market that same
LNG exports, rather than imports, are the factor lim- time period (S&P Global 2021, EIA 2021b).4
m r G
iting the market’s growth. Global LNG export capacity
2
is smaller than global LNG import capacity, and LNG US producers and the US government have identified
export terminals have higher rates of utilization (GEM other strategic opportunities arising from exports. The
a. Ma R
2019). The world has faced a tight gas market for part gas industry sees exports as an opportunity to keep
of 2020 and all of 2021, following a brief supply glut at domestic gas supplies tight, so that producers can
the beginning of the Covid-19 pandemic. Supply short- increase profits selling to US consumers. It’s working.
A
ages have caused gas prices to spike to record levels, LNG exports have made gas more expensive for Ameri-
all while US export facilities have operated at close cans in 2021. In the fall of 2021, the U.S. Energy Infor-
00 til B
to full capacity. Given the United States’ standing as a mation Administration (EIA) forecast that Americans
major gas exporter and its potential for growth, the US would pay 30% more on their heating bills that winter
LNG buildout is especially consequential: the amount due to high gas prices (Eaton et al. 2021). An analyst
EM
of LNG infrastructure built in the United States will with the Institute for Energy Economics and Financial
influence how much gas countries around the world Analysis (IEEFA), Clark Williams-Derry, wrote, “For
can import, and burn, for decades. If proposed US LNG America’s fossil fuel industry, high natural gas prices
facilities move forward, the United States could remain are a feature, not a bug. In fact, fossil fuel interests
the world’s leading exporter of gas through much of predicted long ago that rising LNG exports would boost
the 2020s, even as Qatar is expected to commission a domestic gas prices” (IEEFA 2021b). Coal magnate Bob
un
massive export project in 2025 (DiSavino 2021). Murray reportedly lobbied President Trump to promote
LNG exports so that high gas prices would allow coal
Several factors are driving the US effort to expand LNG to compete (Silverstein 2016). Trump in turn pressed
exports. First, there are some market conditions favor- Japan to invest in LNG expansion projects, threatening
ing exports. The United States has extra gas to sell. In to take punitive action over Japan’s trade surplus. In
2020, the United States produced about 10% more gas response, Japan increased LNG purchases, committed
than it consumed (EIA 2021e). There is also increas- US$10 billion in new financing for Pacific Rim LNG
ing demand for gas abroad, especially in Asia. Many projects, and entered into a formal energy cooperation
6:
Asian economies are growing, shifting away from agreement with the United States (GEM 2020).
4. Spot markets are trading arrangements under which LNG purchasers may buy one-off, near-term shipments of LNG outside of long-term
contracts. Spot price benchmarks such as the Henry Hub Spot Price for the United States and the S&P Global Platts’ JKM marker for Asia are
indicators of the current regional cost of LNG based on demand and availability. About 30% of LNG in Asia is sold on the spot market, compared to
70% in Europe. The remainder of gas is sold through fixed-term contracts, traditionally linked to oil prices.
GLOBAL ENERGY MONITOR REPORT | MARCH 2022 | 6GAS RUN AGROUND
THE CLIMATE IMPACTS OF LNG
The global economy cannot expand the LNG trade without IEA states, “No new natural gas fields are needed in the [Net
derailing international efforts to curb dangerous global Zero by 2050 Scenario] beyond those already under devel-
warming. An analysis by Oil Change International (OCI) opment. Also not needed are many of the [LNG] liquefaction
found that the combined lifecycle emissions of 19 proposed facilities currently under construction or at the planning
US terminals would be 1 gigatonne of carbon dioxide equiv- stage. Between 2020 and 2050, natural gas traded as LNG
alent (Gt CO2e) per year, approximately the annual emissions falls by 60%...” (IEA 2021a).
D
of 250 coal plants, when evaluated on a 20-year time frame
Developers of LNG export facilities have proposed carbon
(OCI 2021).5
capture and storage (CCS) plants alongside liquefaction
TC 8, E
LNG production, transportation, and consumption is highly facilities to make LNG more “green.”7 CCS paired with LNG
ho 2
emissions intensive. The primary component in gas, meth- is a red herring from a climate perspective (GEM 2021b).
s
ane, has a short atmospheric residency of about a decade, For example, Venture Global’s proposed CCS facility would
–5 02
. U ch O
ur
compared to carbon dioxide, which lasts in the atmosphere capture 500,000 tonnes CO2 annually from its Calcasieu
for centuries. However, during the time it remains in the Pass facility (under construction) and its Plaquemines
atmosphere, methane’s warming potential is far higher than facility (proposed), whereas these facilities are permitted to
m r G
2
that of CO2. Evaluated over a century period, a tonne of emit up to 12 million tonnes of CO2e combined (evaluated
methane is estimated to have 34 times the warming effect on a 100-year time frame) (Venture Global 2021, EIP 2021a).
of CO2; evaluated over a 20-year period, it is estimated Furthermore, capturing CO2 produced during the liquefaction
a. Ma R
to have 86 times the warming effect of CO2 (Myhre et al. process can only address, at maximum, about 8–10% of the
2014).6 The LNG supply chain leaks methane all along the full life-cycle emissions of LNG (BNEF 2021).
fuel’s journey from gas fields to pipelines, processing facili-
A
ties, liquefaction terminals, tankers traversing oceans, regas-
ification terminals, regional and local distribution networks, Figure 2: LNG Exports under the International Energy Agency’s
and ultimately homes, industrial facilities, power plants, and Net Zero by 2050 Scenario
00 til B
other buildings. And when gas is burned at its final destina-
400
tion, CO2 is emitted. The near-term climate impacts of US
Other
LNG rival that of coal, according to the Natural Resources
EM
350 Africa
Defense Council (NRDC), because of associated CO2 and Middle East
methane emissions and the energy requirements of lique- 300 Southeast Asia
faction, shipping, and regasification (NRDC 2020). Australia
million tonnes per year
250 Russia
The US LNG supply chain is particularly emissions intensive, North America
starting at the source. Nearly 4% of all gas extracted from 200
the Permian Basin leaks into the atmosphere (Zhang et al.
150
un
2020). Evaluated on a 20-year time frame, these fugitive
emissions alone could total over 9.5 Gt CO2e by 2050. The 100
Permian Climate Bomb project compares this rate of emis-
sions to burning 50 standard mile-long trains of coal every 50
day (PCB 2021).
0
The International Energy Agency (IEA) has called for LNG
70
75
80
85
90
95
00
05
10
15
20
25
30
35
40
45
50
19
19
19
19
19
19
20
20
20
20
20
20
20
20
20
20
20
exports to peak this decade for the world to have a 50%
chance of limiting global warming to 1.5°C (see Figure 2). Source: IEA 2021a
6:
5. OCI’s emissions analysis includes one proposed project that was not analyzed for this report: the 13 mtpa G2 LNG Terminal in Louisiana. Of
the terminals discussed in this report, OCI’s analysis omits CP2, Delta, and West Delta LNG Terminals.
6. Methane has a greater global warming potential when evaluated over a 20-year time frame than over a 100-year time frame.
7. Developers have proposed CCS facilities for Rio Grande, G2, Calcasieu Pass, Plaquemines, CP2, and Freeport LNG Terminals.
GLOBAL ENERGY MONITOR REPORT | MARCH 2022 | 7GAS RUN AGROUND
The fervor to build more US LNG export facilities determining whether new U.S. LNG production capac-
may also reflect LNG companies’ recognition that, ity will make it to the construction stage. The global
for many of the reasons discussed further in this gas market appears likely to continue its recovery
report, they have a limited window to get projects off from pandemic-driven disruptions that muted inves-
the ground. In particular, Qatar and Russia are set to tors’ appetite for new multibillion-dollar LNG infra-
commission low-cost LNG export facilities later this structure. But this may also be a time when projects
decade that may dominate the market with low-cost that have struggled for a long time finally fade away”
gas (Thompson 2021). As one reporter with S&P Global (Paul 2021).
D
wrote, “The next several months could be pivotal for
The US LNG Buildout
TC 8, E
ho 2
s
The United States is home to six major operating LNG The fleet of proposed US LNG export terminals is,
–5 02
. U ch O
ur
export terminals with a combined capacity of 76.6 by comparison, enormous. This report focuses on
million tonnes per annum (mtpa) of LNG (see Table 1). 21 major proposed projects that together comprise
Four are on the Gulf Coast in Texas and Louisiana, the 255 mtpa of new export capacity (Note: this report
m r G
2
epicenter of the proposed LNG buildout due to its prox- does not analyze a few other proposed US LNG export
imity to the Permian Basin. Under construction are two facilities that have been largely dormant or made
new export terminals, Golden Pass and Calcasieu Pass limited progress toward construction). If all of these
a. Ma R
LNG Terminals, which straddle the Texas-Louisiana 21 terminals were built, the United States would more
border, and an expansion to the existing Sabine Pass than triple its export capacity. However, it is unlikely
A
LNG Terminal in Louisiana.8 Their completion will there would be market capacity or investor interest in
increase US export capacity to 106.7 mtpa, at which bringing all of these projects to fruition.
point the United States is expected to have the largest
00 til B
LNG export capacity in the world.
EM
Table 1: Major US LNG Export Terminals Operating and in Construction
Operating
Project State Capacity (mtpa)
Cameron LNG Terminal Louisiana 13.5
Corpus Christi LNG Terminal Texas 15
Cove Point LNG Terminal Maryland 5.25
un
Elba Island LNG Terminal Georgia 2.5
Freeport LNG Terminal Texas 15.3
Sabine Pass LNG Terminal Louisiana 25
Construction
Calcasieu Pass LNG Terminal Louisiana 10
Golden Pass LNG Terminal Texas 15.6
Sabine Pass LNG Terminal, Train 6 Louisiana 4.5
6:
8. Calcasieu Pass and Sabine Pass LNG Terminals are expected to come fully online this year.
GLOBAL ENERGY MONITOR REPORT | MARCH 2022 | 8GAS RUN AGROUND
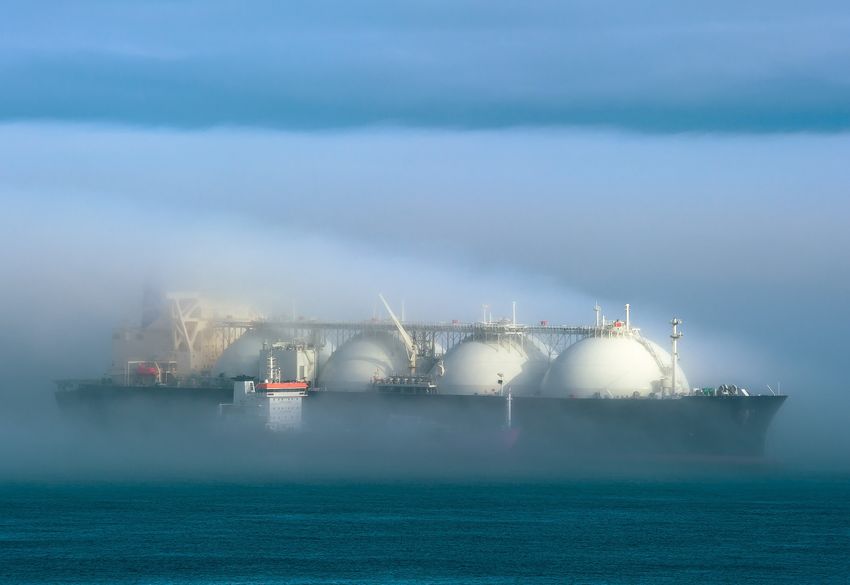
Figures 3 through 6 show the location and status of The majority of these terminals have obtained their
LNG export terminals that are operating or in various required permits from the Federal Energy Regulatory
stages of development . Commission (FERC). With FERC approval, the next
major challenge for companies is finding buyers and
investors.
Figure 3: LNG Export Terminals in the Northern United States (Northeast & Alaska)
D
TC 8, E
ho 2
s
–5 02
. U ch O
ur
m r G
2
a. Ma R
Operating
A
In Construction
Proposed
00 til B
Source: Global Gas Infrastructure Tracker, Global Energy Monitor
EM
Figure 4: LNG Export Terminals in the Southern United States
Operating
In Construction
Proposed
un 6:
Source: Global Gas Infrastructure Tracker, Global Energy Monitor
GLOBAL ENERGY MONITOR REPORT | MARCH 2022 | 9GAS RUN AGROUND
Figure 5: LNG Export Terminals in Cameron Parish (LA) and the Surrounding Area
D
Operating
In Construction
Proposed
TC 8, E
ho 2
s
–5 02
. U ch O
ur
m r G
2
a. Ma R
Source: Global Gas Infrastructure Tracker, Global Energy Monitor
A
Figure 6: LNG Export Terminals in Plaquemines Parish (LA) and the Surrounding Area
00 til B
EM
un
Operating
In Construction
Proposed
6:
Source: Global Gas Infrastructure Tracker, Global Energy Monitor
GLOBAL ENERGY MONITOR REPORT | MARCH 2022 | 10GAS RUN AGROUND
US LNG FINANCE: A SHALLOW POOL
GEM’s research on offtake contracts and financing of production will be anchored with long-term
for the proposed US LNG export terminals indicates a commitments.
weak financing environment: ■ Financing: Of the 21 proposed terminals, GEM has
■ Final investment decisions: No proposed US LNG identified only three terminals that have received
export terminals advanced to the construction direct project finance. Total project finance identi-
phase in 2021. fied for these terminals amounts to US$1.6 billion,
D
■ Offtake contracts: Project owners have only a drop in the bucket compared to the total cost of
secured purchasing agreements publicly linked all projects estimated around US$244 billion.
TC 8, E
to four new projects, out of 21 total. Of the Table 2 shows major proposed US LNG export termi-
ho 2
s
four projects with contracts, two are still far nals in the United States along with contracted output
–5 02
from demonstrating that a substantial share
. U ch O
and project financing identified by GEM.
ur
Table 2: Contracted Output and Project Financing of Proposed US LNG Export Terminals
m r G
2
Project Capacity Contracted Output Cost Project Financing FID
Alaska LNG Terminal 20.1 mtpa – $32.2 billion – 2021 (delayed)
Cameron LNG Export Terminal Phase 2 6 mtpa – $2.7 billion – Late 2022
a. Ma R
Commonwealth LNG Terminal 8.4 mtpa – $4.8 billion – Early 2023
Corpus Christi LNG Terminal Stage 3 11.5 mtpa 0–6 mtpaa $5.3 billion – 2022
A
CP2 LNG Terminal 20 mtpa – $9.2 billion – –
Delfin LNG Terminal 12 mtpa – $7 billion – 2021 (delayed)
Delta LNG Terminal 22.6 mtpa – $33.9 billion – –
00 til B
Driftwood LNG Terminal 27.6 mtpa 9 mtpa $30 billionb US$0.075 billion (debt) 2022
Eagle LNG Terminal 1 mtpa – $0.542 billion – –
Fourchon LNG Terminal 5 mtpa – $2.3 billionc
– –
EM
Freeport LNG Terminal Train 4 5.1 mtpa – $2.3 billion US$1 billion (debt) mid-2022
Gulf LNG Terminal 10.86 mtpa – $8 billion – –
Lake Charles LNG Terminal 17.8 mtpa – $10.9 billion – 2021 (delayed)
Magnolia LNG Terminal 8.8 mtpa – $13.2 billion – Late 2023
Plaquemines LNG Terminal 20 mtpa 11 mtpa $13.1 billiond US$0.5 billion (debt) 2021 (delayed)
Pointe LNG Terminal 6 mtpa – $4 billion – 2022
un
Port Arthur LNG Terminal 13.5 mtpa – $8–9 billion – 2023
Repauno Works LNG Terminal 1.5 mtpa – $0.45 billion – –
Rio Grande LNG Terminal 27 mtpa 2 mtpa $40.5 billion – Late 2022
Texas LNG Terminal 4 mtpa – $6 billion – Late 2022
West Delta LNG Terminal 6.1 mtpa – $9.2 billion – –
Source: Global Energy Monitor. Costs in US$ are based on official projections where available or otherwise are GEM estimates. See methodology for more
details. Contracted output includes only firm sale and purchase agreements (not preliminary agreements, memoranda of understanding, etc.) for 10 or more
6:
years of service. For references, see GEM.wiki pages.
a. Cheniere Energy has secured recent offtake agreements totaling 6 mtpa, but it is unclear which of its projects will fulfill these contracts. Cheniere is the
owner of Sabine Pass LNG Terminal (operating/construction) in addition to Corpus Christi LNG Terminal.
b. The cost of Driftwood LNG Terminal’s first 5.52 mtpa phase is US$12 billion.
c. The cost of Fourchon LNG Terminal’s first 2 mtpa phase is US$888 million.
d. The cost of Plaquemines LNG Terminal’s first 10 mtpa phase is US$8.5 billion.
GLOBAL ENERGY MONITOR REPORT | MARCH 2022 | 11GAS RUN AGROUND
ROLE OF OFFTAKE AGREEMENTS AND FINANCING
IN TERMINAL DEVELOPMENT
LNG terminal developers must overcome multiple hurdles finance projects, primarily through debt. Commercial banks
to prepare a project for a positive final investment decision are often the financiers of LNG projects, and they typically
(FID), i.e., deciding to build the project. Developers must provide financing in syndicates to minimize individual insti-
apply for permits from regulators such as the Federal tutions’ exposure to risk. Potential financiers evaluate these
Energy Regulatory Commission (FERC); secure gas supply contracts, relationships, and permits, along with factors
D
agreements from producers so they have access to gas for such as the developers’ credit rating and equity stake in the
liquefaction; arrange for an engineering, procurement, and project (Williams-Derry 2022).
construction (EPC) contractor to build the project; and find
TC 8, E
While all of these factors are important for a project’s FID,
ho 2
committed buyers for the LNG. Long-term sale and pur-
s
the abilities to secure financing and find committed buyers
chase agreements (SPAs) with buyers such as oil and gas
–5 02
(a prerequisite for bank financing) are usually the two most
. U ch O
ur
companies, trading companies, or utilities demonstrate that
challenging hurdles, and those that are likely to determine
a project will generate cash flow.
which projects are viable.
Crucially, because LNG export terminals are so expensive
m r G
2
to build and operate, developers must find parties willing to
a. Ma R
Final Investment Decisions
A
No US export terminals reached FID in 2021. The project’s delays. And in October 2021, FERC canceled
global picture for export terminal development is its permitting review of Pointe LNG Terminal because
similarly grim. GEM’s June 2021 update on the LNG of the project’s inactivity.
00 til B
industry “Nervous Money” found that only one
terminal globally had reached FID over the previous If any projects do arrive at FIDs in 2022, it may be those
year (GEM 2021c). The dates for FIDs are based on that have secured ample offtake contracts, such as
EM
project developers’ own expectations, and delayed Plaquemines LNG Terminal, or those that are expan-
FIDs indicate that terminal owners are not finding the sions to existing terminals operated by well-established
investors and buyers needed to move forward. In 2021, companies, such as Corpus Christi Stage 3 or Free-
the owners of Rio Grande, Driftwood, and Port Arthur port Train 4. Although Driftwood LNG Terminal has
LNG Terminals all delayed projects’ intended FIDs attracted attention from media and analysts, the terms
from that year to 2022. of its offtake agreements dare investors to take a major
un
gamble on future cash flow (more on this below).
Slow progress has consequences for projects. Port
Arthur LNG Terminal lost contract agreements Any projects that do proceed to construction will
with Saudi Aramco and Polish Oil Mining and Gas face significant challenges over the coming years,
Extraction (PGNiG) after both companies cited the described further in Challenges Ahead for US LNG.
6:
GLOBAL ENERGY MONITOR REPORT | MARCH 2022 | 12GAS RUN AGROUND
Offtake Contracts
For an LNG terminal company to reach FID, firm, it has about 6 mtpa of contracted capacity available for
long-term contracts are typically required for about the project (Cheniere 2021).
80% of a terminal’s capacity (DOE et al. 2017). Only
four LNG companies have secured offtake contracts Tellurian, the owner of Driftwood LNG Terminal, has
linked to new projects: Driftwood, Plaquemines, and announced 9 mtpa worth of contracts with Shell and
Rio Grande LNG Terminals and Corpus Christi Stage 3. international commodity traders Vitol and Gunvor
Group, but these agreements are relatively short term
D
Of those, only Plaquemines LNG Terminal and Corpus
Christi Stage 3 likely have substantial shares of their (10 years) and tied to spot market benchmark prices
capacities grounded in firm, long-term commitments. for LNG. These agreements leave investors at the
TC 8, E
whim of future prices in the volatile LNG market and
ho 2
Plaquemines LNG Terminal has 20-year SPAs signed
s
with PGNiG, Electricité de France, Sinopec, and future agreements with unknown buyers on unknown
–5 02
terms, long before the terminal’s capital costs are
. U ch O
ur
CNOOC, accounting for 11 mtpa of output (Phase 1 is
only planned to be 10 mtpa). Cheniere has recently paid off (IEEFA 2021a). The fact that Tellurian is using
finalized 6 mtpa of offtake agreements, but it has these contract terms to entice financiers suggests it
m r G
was unable to find buyers on more advantageous and
2
not been publicly specified whether this capacity
will come from its proposed Corpus Christi Stage 3 traditional terms.
expansion, or other segments of its Corpus Christi
a. Ma R
Finally, Rio Grande LNG Terminal only has 2 mtpa of
LNG Terminal (operating) or Sabine Pass LNG Termi-
capacity contracted out to Shell, which is little of the
nal (operating/construction). Cheniere has stated that
terminal’s full planned 27 mtpa of capacity.
A
Financing
00 til B
LNG export terminals are some of the most expensive time, it does not indicate a complete lack of interest.
projects ever built. The projects in Table 2 range from Projects typically do not receive much direct financing
EM
half a billion to 30 billion dollars, averaging about prior to FID, and there are other avenues of financing
US$0.8 billion per mtpa of capacity. It is for this reason projects indirectly, for instance, supporting projects
that there are typically many financiers involved in a via general corporate finance and supporting the
given project, and that the risk in executing projects is owners of LNG projects. The next section, Financing
so high. the Leading Proposed US LNG Projects, examines
corporate financing and financing of projects’ owners
In a survey of IJGlobal Project Finance and Infrastruc- in greater detail for several of the projects.
un
ture Journal, GEM identified relatively few financing
deals directly for LNG projects. In total, three loans Table 3 (on the next page) lists financial institutions
granted to Driftwood, Freeport, and Plaquemines and companies that are or have been involved in
LNG Terminals add up to about US$1.6 billion. This is proposed US LNG export terminals as financiers,
not a positive sign for US LNG financing. At the same financial advisors, and buyers.
6:
GLOBAL ENERGY MONITOR REPORT | MARCH 2022 | 13GAS RUN AGROUND
Table 3: Financial Institutions and Companies Involved in Proposed US LNG Export Terminals as Financiers, Financial Advisors, and Buyers
Financial Institutions Companies and Traders
Project Institution Role Company Role
Alaska LNG Terminal Goldman Sachs Financial advisor Sinopec Potential offtaker
Bank of China Financial advisor and
potential creditor
CIC Capital Potential equity
Cameron LNG Export Terminal Phase 2 JP Morgan Chase Financial advisor TotalEnergies Potential equity or offtaker
D
Mitsui & Co. Potential equity or offtaker
Mitsubishi Corporation Potential equity or offtaker
Commonwealth LNG Terminal SMBC Group Financial advisor Gunvor Group Potential offtaker
TC 8, E
ho 2
Summit Oil & Shipping Potential offtaker
s
Woodside Energy Potential offtaker
–5 02
. U ch O
ur
Corpus Christi LNG Terminal Stage 3 – – Glencore Potential offtaker
ENN Natural Gas Potential offtaker
Engie Potential offtaker
m r G
2
Foran Energy Group Potential offtaker
Sinochem Group Potential offtaker
NFE North Trading Potential offtaker
a. Ma R
Posco Potential offtaker
CP2 LNG Terminal – – – –
A
Delfin LNG Terminal – – – –
Delta LNG Terminal – – – –
Driftwood LNG Terminal Goldman Sachs Financial advisor Gunvor Group Offtaker
00 til B
Société Générale Financial advisor Vitol Offtaker
UBS Loan (US$75 M) Shell Offtaker
Eagle LNG Terminal – – – –
EM
Fourchon LNG Terminal – – – –
Freeport LNG Terminal Train 4 Westbourne Capital Loan (US$1 B) JERA Equity and potential offtaker
SMBC Group Potential offtaker
Gulf LNG Terminal – – – –
Lake Charles LNG Terminal JP Morgan Chase Financial advisor – –
Magnolia LNG Terminal – – – –
un
Plaquemines LNG Terminal Bank of America Loan (US$1.25 M) PGNiG Offtaker
JP Morgan Chase Loan (US$1.25 M) Electricité de France Offtaker
Mizuho Financial Loan (US$1.25 M) Mizuho Financial Offtaker
Morgan Stanley Loan (US$1.25 M) CNOOC Offtaker
Pointe LNG Terminal Whitehall & Co Financial Advisor – –
Port Arthur LNG Terminal JP Morgan Chase Financial Advisor – –
Repauno Works LNG Terminal – – – –
Rio Grande LNG Terminal Macquarie Capital Financial Advisor Shell Offtaker
6:
Société Générale Financial Advisor
Texas LNG Terminal – – – –
West Delta LNG Terminal – – – –
Source: Global Energy Monitor. Note: potential offtaker indicates that a company has expressed interest in being an offtaker but not signed a formal purchas-
ing agreement. For more information, see terminal profiles in the Appendix and GEM.wiki.
GLOBAL ENERGY MONITOR REPORT | MARCH 2022 | 14GAS RUN AGROUND
Financing the Leading Proposed US LNG Projects: A Deep Dive
GEM commissioned Profundo, a not-for-profit participation in the project companies, and are the
research organization, to conduct an in-depth study ultimate owners of the project)(see Table 4); and
of financing for six projects that are considered
3. These transactions over the time frame 2016 to
relatively likely candidates to move forward: CP2,
2021.
Driftwood, and Plaquemines LNG Terminals and
expansions at Cameron, Corpus Christi, and Free- This data can help identify other financiers who have
D
port LNG Terminals (see Table 4). supported LNG projects, if less directly than through
recent project finance. By examining historical financ-
Whereas the analysis on pages 11–14 focuses on
ing and project sponsors’ financing, it is also possible
TC 8, E
project finance deals, which represent debt or equity
ho 2
to identify institutions that might support LNG proj-
s
financing extended directly to LNG project companies,
ects in the future.
–5 02
Profundo’s study cast a wider net on LNG terminal
. U ch O
ur
financing by examining This study is split in two parts by the type of relation-
ship financiers have with the projects: (1) creditors
1. General corporate finance transactions (i.e., finan-
m r G
2
and (2) bond and shareholders. Data is presented in
cial support for a company not earmarked for a
aggregate for the six projects. For more information
particular project);9
on the top financiers of each of these six projects indi-
a. Ma R
2. Financing of LNG project companies and their vidually, see the supplementary document Financing
sponsors (i.e., the companies that own or have the Leading Proposed US LNG Projects (Individual
A
Project Analyses).
Table 4: LNG Projects Analyzed by Profundo, with Associated Project Companies and Sponsors
00 til B
Project name Project company Sponsors
Cameron LNG Export Terminal Cameron LNG Sempra LNG
Mitsui & Co.
EM
TotalEnergies
Mitsubishi Corporation
Nippon Yūsen Kabushiki Kaisha
Corpus Christi Liquefaction Stage 3 Cheniere Energy Cheniere Energy
CP2 LNG Terminal (Phase 1 & 2) Venture Global LNG, Inc. Venture Global LNG, Inc.
Driftwood LNG Terminal Driftwood LNG, LLC Tellurian Inc.
Freeport LNG Terminal Freeport LNG Development Zachry Hastings
un
Osaka Gas
Dow Chemical Company
Global Infrastructure Partners
Freeport LNG
Plaquemines LNG Terminal Venture Global Plaquemines LNG, LLC Venture Global LNG, Inc.
6:
9. Corporate financing includes financial support for a company that, as opposed to project finance, is not isolated within the structure of a
particular project. Corporate financing is less clearly linked to a particular project, especially if its recipient has a diversified business. It is,
however, relevant because corporate financing supports terminal sponsors’ operations and may be invested directly in LNG projects via companies’
balance sheets.
GLOBAL ENERGY MONITOR REPORT | MARCH 2022 | 15GAS RUN AGROUND
Creditor Analysis Mitsubishi UFJ Financial, and Mizuho Financial. Japan
has long been among the top supporters of LNG inter-
The creditor analysis focuses on financiers that have
nationally; in 2020, GEM found that Japan’s institutions
extended loans to LNG project companies and their
had provided at least US$23.4 billion to LNG projects
sponsors, or underwritten bond or share issuances
globally over the previous three years (GEM 2020). The
for these entities. Figure 7 lists the top creditors
next two creditors on the ranking are French: Société
of five LNG projects in terms of the total value of
Générale and Crédit Agricole. Goldman Sachs, JP Mor-
loans and underwriting services offered. To identify
gan Chase, Citigroup, and Bank of America were also
loans and underwriting services affiliated with the
D
among the top 20 creditors. Rainforest Action Network
LNG projects, this data set only includes transactions
(RAN) found these banks were among the top finan-
directly attributable to the projects in Table 4, via their
ciers of LNG globally in its 2021 Banking on Climate
TC 8, E
project companies and sponsors (CP2 was excluded
ho 2
Chaos report. Citigroup, JP Morgan Chase, and Bank
s
here—see footnote).10
of America held the second through fourth places on
–5 02
. U ch O
ur
The top three creditors of these LNG projects and RAN’s list, respectively (RAN 2021).
their sponsors are Japanese institutions: SMBC Group,
m r G
2
Figure 7: Loans and Underwriting Services Directly Attributable to Select LNG Projects,
by Financier, 2016–2021 (million US dollars)
a. Ma R
0 500 1,000 1,500 2,000 2,500 3,000
SMBC Group (Japan)
A
Mitsubishi UFJ Financial (Japan)
Mizuho Financial (Japan)
Société Générale (France)
00 til B
Crédit Agricole (France)
Royal Bank of Canada (Canada)
ING Group (Netherlands)
EM
Goldman Sachs (United States)
HSBC (United Kingdom)
Santander (Spain)
Credit Suisse (Switzerland)
JPMorgan Chase (United States)
Banco Bilbao Vizcaya Argentaria (BBVA) (Spain)
CIBC (Canada)
Scotiabank (Canada)
un
Intesa Sanpaolo (Italy)
Westbourne Capital (Australia)
Citigroup (United States)
Groupe BPCE (France)
Bank of America (United States) Loans Underwriting
Source: Profundo. This figure includes loans and underwriting services directed to the project companies
and sponsors of Cameron, Corpus Christi, Driftwood, Freeport, and Plaquemines LNG Terminals.
6:
10. The creditor analysis only included transactions that could be directly attributed to the six LNG projects. It was not possible to include data for
CP2 LNG Terminal among financing deals attributable to these projects, because the project company for CP2, which is Venture Global, has two
other LNG terminal projects: Calcasieu Pass (under construction) and Delta LNG (proposed) LNG Terminals. Therefore, loans and underwriting
services for Venture Global could have been directed to either of these other projects.
GLOBAL ENERGY MONITOR REPORT | MARCH 2022 | 16GAS RUN AGROUND
Bond and Shareholder Analysis The US investment groups BlackRock and Vanguard
are the two leading bond and shareholders in the proj-
The bond and shareholder analysis focuses on finan-
ect companies and their sponsors. Both announced
ciers that have purchased bonds or shares issued by
in March 2021 that they would join an international
the project companies or sponsors. Figure 8 lists the
investors’ initiative to drive portfolio companies’
top financiers of all six LNG projects in terms of the
emissions to net-zero by 2050 (Kerber 2021). These
total value of bonds and shares owned.
asset managers’ outsize role in LNG is also notewor-
This data set includes financial transactions that are thy because much of their investments come from
D
associated with the project companies and spon- personal retirement funds, pension funds, and other
sors, but may not be directly attributable to a project retail investments. Share price volatility of oil and gas
companies puts these savings and pension funds at
TC 8, E
because of companies’ other operations. For instance,
ho 2
risk, and the growing popularity of sustainable invest-
s
it includes financiers that own bonds or shares of
ing will inevitably make such investments less tenable
–5 02
Cheniere, even though Cheniere owns other LNG ter-
. U ch O
ur
minals beyond Corpus Christi, and it includes finan- over time. In late 2021, the world’s 8th largest pension
ciers that own bonds or shares of TotalEnergies, even fund, ABP, announced it would divest from fossil fuel
producers completely in response to climate concerns
m r G
though TotalEnergies has assets beyond LNG facilities.
2
Investors in the project companies and sponsors also (ABP 2021).
indirectly own the LNG projects and can therefore be
a. Ma R
considered accountable for them.
A
Figure 8: Bond and Shareholding Directly and Indirectly Attributable to Select LNG Projects,
by Financier, 2021 (million US dollars)
0 5,000 10,000 15,000 20,000
00 til B
BlackRock (United States)
Vanguard (United States)
EM
Crédit Agricole (France)
Capital Group (United States)
T. Rowe Price (United States)
State Street (United States)
Government Pension Fund Global (Norway)
Wellington Management (United States)
Nomura (Japan)
Sumitomo Mitsui Trust (Japan)
un
Deutsche Bank (Germany)
Fidelity Investments (United States)
Berkshire Hathaway (United States)
JPMorgan Chase (United States)
Geode Capital Holdings (United States)
Franklin Resources (United States)
Mizuho Financial (Japan)
Meiji Yasuda Life Insurance (Japan)
Allianz (Germany)
6:
UBS (Switzerland) Bondholding Shareholding
Source: Profundo. This figure includes bond and shareholding directed to the project companies and
sponsors of Cameron, Corpus Christi, CP2, Driftwood, Freeport, and Plaquemines LNG Terminals.
GLOBAL ENERGY MONITOR REPORT | MARCH 2022 | 17GAS RUN AGROUND
CHALLENGES AHEAD FOR US LNG
In the 2010s, the United States was experiencing rapid impact of LNG terminals on low income communities
expansion of cheap, domestic shale gas, while LNG and communities of color; (4) increased regulatory
markets were growing in Europe and Asia. Major scrutiny and permitting challenges over environmental
investments in LNG could be seen as low-risk propo- and community impacts; (5) international climate com-
sitions offering decades of business. Today, although mitments inconsistent with increased LNG exports;
Asian and European buyers are paying exorbitant (6) loss of social license internationally due to grow-
D
prices for US LNG, the calculus for long-term invest- ing alarm over climate change; (7) volatile gas prices;
ments in LNG has changed. US LNG export projects (8) uncertain demand among Asian and European
TC 8, E
now face challenges on multiple fronts, including buyers; (9) a shift away from long-term LNG contracts
ho 2
s
(1) competition from lower priced producers such as across international gas markets; and (10) investors
–5 02
Qatar; (2) domestic concerns over LNG exports rais- concerned that gas projects will be economically and
. U ch O
ur
ing gas prices; (3) recognition of the disproportionate environmentally untenable in the long run.
International Competition
m r G
2
According to Wood Mackenzie’s forecasts, by 2030, project at 48 mtpa. Bloomberg New Energy Finance
global LNG demand will grow to 560 mtpa, and lique- has projected that 10 US projects, including Rio
a. Ma R
faction facilities that are operating or in construction Grande and Texas LNG Terminals could be unable to
today around the world could account for 515 mtpa of secure financing because of competition with Qatar
A
this demand (Jaganathan 2021). That leaves a rela- (Shiryaevskaya et al. 2021). Russia, another cheap gas
tively small shortfall between supply and demand, producer, supplies over one third of Europe’s gas, and
45 mtpa, which—for scale—is about the combined its Arctic LNG 2 project under construction will have
00 til B
size of the operating and in construction phases of almost 20 mtpa of capacity to supply Chinese state
Corpus Christi and Sabine Pass LNG Terminals in the oil companies CNPC and CNOOC as well as others
EM
United States. The 21 proposed LNG export facilities (Twidale 2021).
discussed in this report, totaling 255 mtpa of capacity,
will be competing with one another for this share of When these projects and others are commissioned
global production. They will also be competing with in the middle of the decade, they could challenge US
the rest of the world. producers’ ability to turn a profit. A Wood Mackenzie
Vice Chairman noted that there will be “abundant LNG
Qatar and other countries can undercut US LNG pro- supply coming to market in the 2026–2028 period …
un
ducers on price. A 2019 analysis by Rystad found that setting the scene for renewed price pressure” (Thomp-
new projects in Qatar, Russia, and Mozambique would son 2021). In a February 2022 research note, Bank
be able to provide LNG to East Asia more cheaply than of America wrote of Driftwood LNG Terminal that
new US projects such as Driftwood LNG Terminal “An excess of U.S. LNG export capacity over the next
and the expansion at Freeport LNG Terminal (Rystad several years could result in lower pricing or delays/
2019). Qatar has historically been the world’s leading cancellations of incremental expansion plans” (BofA
LNG exporter, with easily accessible gas and proximity 2022). Planning new US LNG projects that would enter
6:
to Asia (Shiryaevskaya et al. 2021). Qatar’s proposed the market in a gas supply glut is risky, to say the least.
North Field LNG Terminal would be the world’s largest
GLOBAL ENERGY MONITOR REPORT | MARCH 2022 | 18GAS RUN AGROUND
Domestic and International Policy Concerns
US plans to export LNG are confronting domestic and new certificate policy] will be wielded against every
international policy concerns. In the United States, single natural gas project, making the cost and uncer-
industries that rely on natural gas and domestic con- tainties of even pursuing a project exponentially more
sumers are experiencing high gas prices due to low daunting” (Knight 2022). BNN Bloomberg has reported
supplies from exports. In September 2021, the Indus- that many US gas projects will be immediately affected
trial Energy Consumers of America wrote a letter to by the changes, including Driftwood LNG Terminal
D
U.S. Department of Energy (DOE) Secretary Jennifer (Freitas Jr. 2022). These policy changes follow losses
Granholm encouraging DOE to require LNG exporters in court for FERC over its failures to critically eval-
to reduce export rates (IECA 2021). A group of Dem- uate project impacts. In August 2021, a court ruled
TC 8, E
ho 2
ocratic US senators led by Jack Reed and Angus King that FERC must redo its environmental analyses for
s
also wrote to Secretary Granholm in February 2022 Rio Grande and Texas LNG Terminals because it did
–5 02
. U ch O
ur
urging DOE to reconsider whether LNG exports are in not sufficiently take into account the projects’ green-
the public interest (Office of Jack Reed 2022). Australia house gas emissions and impacts on low-income and
experienced the same phenomenon, and a similar minority communities (Malo 2021).
m r G
2
public backlash, when exports of Australian gas raised
domestic prices from AUS$3-$4 per gigajoule in 2013 With respect to international policy concerns,
to AUS$10 per gigajoule in 2019 (Denniss 2020). increased production and consumption of LNG is at
a. Ma R
odds with global commitments to confront climate
The proposed US LNG terminals are increasingly change. As discussed in the sidebar on The Climate
seen as an environmental justice issue because many Impacts of LNG, increased LNG exports throughout
A
of them would exacerbate pollution in low-income the coming decades are incompatible with scenarios
communities and communities of color. There is a consistent with limiting global warming to 1.5°C, such
00 til B
long history of industrial pollution disproportionately as IEA’s Net Zero by 2050 Scenario (IEA 2021a). A US
harming marginalized communities, especially along buildout of LNG would undermine its commitment
the Gulf Coast. Only in recent years have environ- to limiting global warming ideally to 1.5°C under the
EM
mental justice concerns begun to hold more sway in Paris Agreement and its agreement under the Global
the top levels of government, with the Biden Admin- Methane Pledge to reduce methane emissions by 30%
istration committing to ensuring that 40 percent of over the coming decade.
relevant federal climate investments benefit disad-
vantaged communities (White House 2021). For more International buyers are also becoming more con-
information, see the sidebar on LNG Terminals & cerned with the climate impacts of their fuel imports.
In October 2021, India’s oil minister said the country
un
Environmental Justice.
would seek emissions data for each imported cargo of
LNG and other gas projects have faced challenges LNG (Verma 2021). The LNG industry has responded
to the permitting process on environmental justice to such interest by establishing a framework for
and environmental grounds, and in response, FERC declaring LNG cargoes “carbon-neutral.” However,
instituted a new, more stringent review process for gas “carbon-neutral” shipments represent less than 1%
projects in February 2022. Policy changes include an of total global shipments and have been criticized by
elevated threshold for demonstrating that projects are environmental advocates as greenwashing (Twidale
6:
in the public interest and new criteria for evaluating et al. 2021; Stapczynski et al. 2021). Whether buyers
projects’ impacts on nearby communities and climate will accept the idea that LNG can be low-emissions or
change. In his dissent, Republican commissioner carbon-neutral remains to be seen.
Mark Christie said, “There is no question that [this
GLOBAL ENERGY MONITOR REPORT | MARCH 2022 | 19GAS RUN AGROUND
A factor recently invoked in support of expanded US underlying resilience of the existing European system.
LNG export capacity is the ongoing crisis in Ukraine. An analysis released in 2020 by the energy analytics
The crisis has come at a time when Russia, which firm Artelys considered the specific “stress test” for
supplies more than a third of Europe’s gas, had already that system of a full-year disruption in all gas transit
cut its piped gas to Europe by 23 percent in Q4 2021 through Ukraine (Artelys 2020). Due to the availability
compared to Q4 2020, while global gas spot prices are of alternative suppliers including Norway, Azerbaijan,
at record highs due to pandemic-related supply imbal- and Turkey, as well as additional LNG supplies from
ances (Holder et al. 2022). other global LNG suppliers, the analysis found “no
D
additional loss of load” compared to the case without
Such rationales tend to conflate short-term and long- disruption. As discussed throughout this section, new
term considerations. While increased US LNG exports projects that come online in the mid-2020s are likely
TC 8, E
ho 2
to Europe have helped provide a stopgap in the short to face fierce competition from lower-cost producers,
s
term, the Ukraine crisis does not provide a strong and the rapid fall in the cost of renewables makes gas
–5 02
. U ch O
ur
justification for increasing US LNG export capacity demand less certain. Indeed, a key takeaway from the
on a long-term basis. One reason is that proposed European gas crisis is that imported fossil fuels are
terminals will not be able to export gas for three to not more inherently secure than a robust renewable
m r G
2
five years, at which point the geopolitical landscape power and storage sector.
may not be favorable for US producers. A second is the
a. Ma R
Shifting Market Conditions
New US LNG projects face market conditions that may need to build up energy markets to absorb LNG faces
A
make it difficult to find buyers or recover upfront obstacles due to the complex coordination that would
costs. First, the global LNG market is extremely be required among governments, capital markets,
00 til B
volatile. Between 2020 and 2021, Asian spot prices and LNG developers. In Europe, ambitious climate
fluctuated by a factor of 18 (S&P Global 2021). The objectives and increasing skepticism of gas could cool
year of 2020 was disastrous for LNG producers as interest in importing US LNG (IEEFA 2021c). US LNG
EM
demand and prices cratered, and costly for contractu- is relatively dirty even compared to Europe’s other
ally obliged LNG purchasers; customers of Cheniere gas options; data from the UK government shows that
paid US$708 million to cancel LNG cargoes between LNG from the US was more emissions intensive than
April and June. As energy analyst Seb Kennedy has gas from Qatar, Algeria, Norway, and other countries
written, “ ‘Going long on LNG’ means betting against (UK Oil & Gas Authority)
another black swan-type event that tanks the global
There is evidence that high gas prices have soft-
un
economy and energy demand” (Kennedy 2022). While
Asian and European buyers are willing to pay high ened demand for gas in Asia and Europe. In India,
prices for LNG today, there is no guarantee that these where spot prices soared to US$49.35 per MMBtu
advantageous conditions for US suppliers will persist. late last year, LNG imports in January 2022 were
Proposed US terminals may not be commissioned for down by 9.4% with respect to the previous month
three to five years, at which point US LNG may not be and 6.5% with respect to January 2021 (Russell 2022).
as profitable. In Europe, where benchmark gas prices tripled last
year, gas demand is forecast to drop 4.5% this year
6:
Future Asian and European demand for gas is also after increasing 5.5% last year (Shiryaevskaya et al.
uncertain. Even before the start of the pandemic, 2022). A report by Ember found that over the second
Japan and South Korea had begun reducing LNG half of 2021 renewables primarily replaced gas-fired
imports. In China, LNG power has been unprofitable power generation in Europe, a deviation from the
for gas utilities, and in India and Southeast Asia the coal-to-renewable switching that dominated the 2010s
GLOBAL ENERGY MONITOR REPORT | MARCH 2022 | 20You can also read