Prospects for Financial and Capital Markets 2nd quarter 2021 - Zurich, 07 April 2021
←
→
Page content transcription
If your browser does not render page correctly, please read the page content below
Prospects for Financial and
     Capital Markets
    2nd quarter 2021

        Zurich, 07 April 2021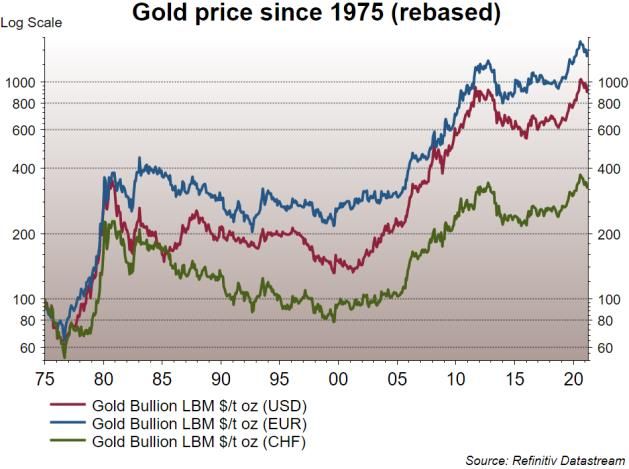
Foreword
The first quarter of 2021 ended more posi-         from a very low level, almost doubling, and
tively than many expected. It seems that the       within a very short time. Overall, the financial
economy has weathered 2020 less badly than         and capital markets have been able to cope
feared and has been able to master the first       with the effects well so far. The stock mar-
three months with strength despite continued       kets continued their upward trend. But some
uncertainty from the pandemic. The purchas-        cracks in the markets are becoming visible.
ing managers' indices (PMI) for the manufac-       For example, the stock markets experienced
turing sector in the US and Europe are cur-        the "Robinhooders" who, in the case of
rently on excellent levels. The service sector     GameStop, drove the price up in an organised
still shows a divided picture depending on the     manner, triggering a so-called "short-
regional progress in vaccinating the popula-       squeeze" and inflicting material losses on
tion. While the US and the UK are advancing        some short sellers. Trading in call options
rather rapidly, vaccination campaigns in con-      reached record volumes in the US in February
tinental Europe seem to be struggling. Rela-       and towards the end of March a very large
tive to other regions of the world, progress is    hedge fund/family office (Archegos) col-
nevertheless notable and likely to gain mo-        lapsed, causing billions in losses for some in-
mentum. The Chinese economy took a pause           vestment banks. What the three cases have
and the recovery of the global economy is still    in common are, in our view, signs of a bull
facing headwinds from struggling supply            market that is in its final phase: Concentrated
chains and scarce commodities as a result of       positions, very high use of leverage, forced
underinvestment in the previous years. As a        liquidation into an illiquid market. Another
result, producer prices are rising sharply.        warning sign are the eternally rising real es-
                                                   tate prices in the USA.
The political noise has clearly become quieter
since November. Nevertheless, much is hap-         For the second quarter, we expect interest
pening. Fiscal policy continues to hold the        rates to rise at a significantly slower pace.
wheel firmly in its hands. The US government       The higher interest rate level will keep volatil-
is in the process of launching a total of two to   ity rather high on the markets. However, the
three substantial programmes with a volume         pressure on the fault lines in the system will
of up to USD 6 trillion. The trade conflict be-    remain too low for the time being. Thus, the
tween China and the West is increasingly           equity markets should manage to hang on for
turning into a conflict over financial and capi-   another positive quarter. In the case of gold,
tal markets. Although liquidity seems to be        we assume that the bottom will finally be
available more than enough, the battle for in-     reached in the next three months.
vestment money has been launched. Mone-
tary policy is currently staying in the back-      Bank von Roll Ltd
ground and seems to be letting things run          Bleicherweg 37
their course for the time being.                   CH-8027 Zurich

Economic recovery, rising producer prices
and inflation expectations as well as in-
creased demand for money lead to rising in-
terest rates. In particular, 10-year US interest
rates experienced an increase of around 0.8%

                                                                                        Foreword 2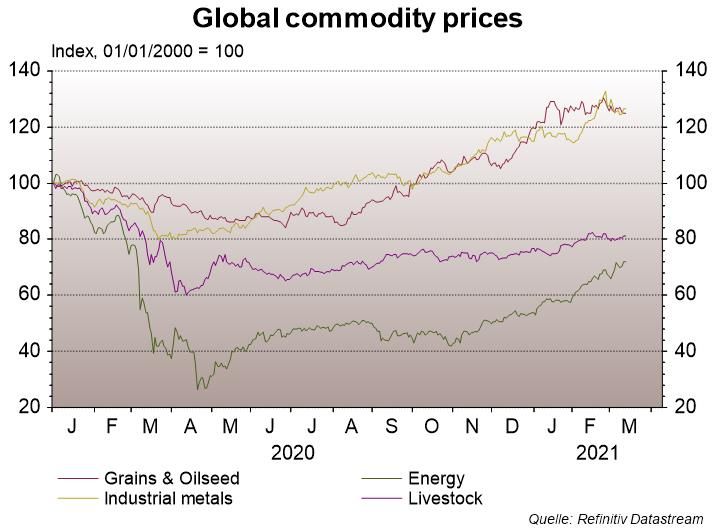
Strategic cornerstones - Q2 2021
For the 2nd quarter of 2021, our investment policy is guided by the following key points:
The fourth quarter of 2020 performed less poorly than expected and the first quarter of
2021 also surprised positively. Growth estimates were subsequently increased. The
Economy
purchasing managers' indices can also boast excellent values. We expect the strongest
growth in the Asian regions. But the USA should also grow strongly, as vaccine distri-
bution is clearly progressing the fastest there. In Europe, the upswing in services and
consumption is delayed again, but will be more than compensated by a very positive
development in the manufacturing sector.
The focus in the second quarter will continue to be on fiscal policy and thus debt is
Monetary policy
expected to continue to rise. Monetary policy will remain rather passive and reactive.
They will keep an eye on the long-term interest rates determined by market forces. Ac-
tive intervention is only likely to take place if there are signs of a break in the financial
and capital markets, which we do not expect in the second quarter.
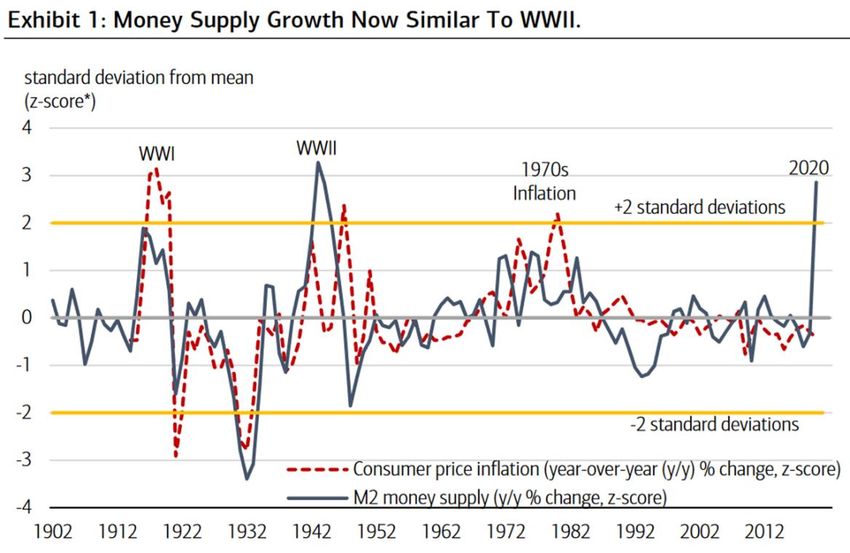
The inflation potential is enormous due to the ultra-expansive monetary policy and rec-
ord high debt. Inflation rates have already picked up quite significantly, as we expected,
Inflation
and as a result nominal interest rates have also risen. In the second quarter we expect
the trend to continue in a weakened form. Whether inflation is sustainable will only be-
come clear in the second half of the year.
We expect the following asset class development in the second quarter:
• Equities with positive trend, but higher volatility
Markets
• Commodities should continue to perform positively
• Only slightly rising interest rates after the jump in the first quarter and a wait -and-
see attitude with regard to the further development of inflation. Corporate bonds
should perform slightly better than government bonds.
The long-term drivers are intact and gold continues to be underrepresented in institu-
tional investors' portfolios. We expect a sideways trend and the final phase of the con-
Gold
solidation that has already lasted 8 months. Real interest rates should continue to fall
and support the gold price. We expect prices to be well above USD 2,000 per ounce
when the bottoming phase is complete.
With an increasingly better economic outlook, we had again slightly increased the equity
allocation in the first quarter. Our preference for "old economy" sectors is correct and
Investment strategy
the trend is likely to continue. We consider the weakness of Asian equities to be tempo-
rary.
We are holding on to the overweighting of gold with conviction. The correlation to equi-
ties is negative, which brings diversification effects. Despite the underperformance in
the first quarter, we are positive for the rest of the year.
Bonds offer hardly any earnings prospects. We remain underweighted, focusing on
solid quality and inflation-protected bonds.
We leave foreign currency risks at a relatively low level.
Strategic cornerstones - Q2 2021 3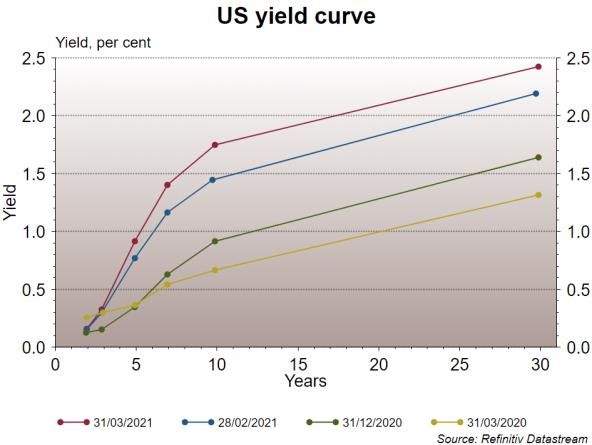
Strategic asset allocation
                                              Balanced CHF
Asset Class
Liquidity                               7%
Fixed Income                                              30%
Corporate Bonds BBB                           15%
Inflation-Protected Government Bonds          15%
Highy Yield Bonds                       0%

Equities                                                         48%
Switzerland                                   15%
Europe                                        14%
USA                                           10%
Emerging Markets                        6%
Gold Mines                              4%

Precious Metals                               15%

Currencies
CHF                                                                                          80%
EUR                                           10%
USD                                     5%
Other Currencies                        5%

                         in percent %    10     20   30     40     50   60       70     80     90    100

Our focus for the second quarter of 2021
    • We are underweighting this segment. Solid quality and inflation-protected bonds are
       preferred.
    • We remain positive about the equity markets and keep an overweight position. Value
       should continue to outperform growth. We do not expect a major correction yet, but
       volatility is likely to increase.
    • Growth in expected earnings is highest in Europe. With a relatively late opening of the
       economy during the second quarter, stock market advances should be supported. Eu-
       ropean equities remain attractive.
    • Emerging markets and Asia remain favourites despite a setback in the first quarter after
       a strong start, as demographics, rising consumption, an expected weaker USD and tech-
       nology/digitisation will provide increased positive momentum.
    • The infrastructure sector continues to look positive, especially in the USA. The sector
       includes: basic materials, industrial metals, mechanical engineering and capital goods
       as well as energy and data infrastructure ("cybersecurity").
    • We are maintaining our overweight allocation in gold and gold mining stocks.

Risk factors
    • A stronger than expected economic development leads to a rapid rise in interest rates ,
        which brings down the highly valued asset classes.
    • Uneven distribution of vaccines leads to geopolitical tensions.
    • A new strain of the virus emerges that destroys any progress.
    • Major social tensions in the USA, political assassination.
    • Insolvency phase in the context of the pandemic crisis.
    • Food shortages, rising prices of agricultural goods, distribution struggles.
    • Large-scale cyberattacks with negative consequences for the internet.

                                                                             Strategic asset allocation 4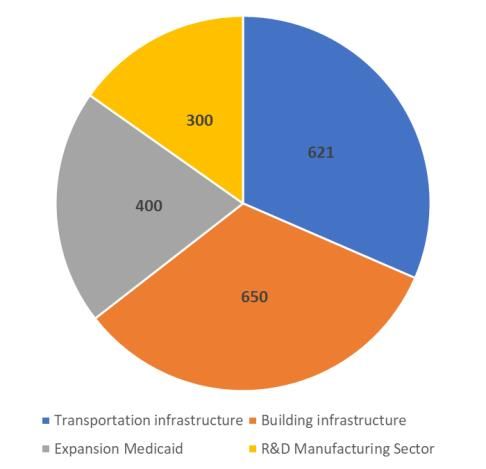
Economic environment
Asynchronous upswing
Covid-19 - Advancing vaccination campaigns, new waves and mutants

                                         While the pandemic has lost influence in the financial
  Overall, the situation is improving
                                         and capital markets, it continues to dominate politics,
  from month to month. Vaccina-
                                         news and the real economy. The focus is on the pro-
  tion campaigns are picking up
                                         gress of vaccines and the seasonal waves. Globally, 10
  speed, but new waves of infection
                                         vaccines are currently available, of which 2 are from Eu-
  cannot yet be prevented. Herd im-
                                         rope/USA, 2 from USA, 3 from China, 2 from Russia and
  munity is illusory for the time
                                         1 from India. From the distribution of approvals, one can
  being.
                                         get to some degree the impression of vaccine national-
ism (see graphs and tables in the appendix). Of the large economic blocs, the USA is currently
making the fastest progress. The first states are already beginning to make vaccinations avail-
able to all adults. Although three vaccines are licensed in Europe, vaccination progress is much
                                                           slower than in the USA. Relative to the
                                                           rest of the world, however, the situa-
                                                           tion in Europe is better than it might
                                                           appear. There are no figures from
                                                           China, but the goal seems to reach a
                                                           vaccination coverage of 40% by the
                                                           end of June. As expected, the estab-
                                                           lished methods (i.e. lock-downs) are
                                                           needed for the time being to keep the
                                                           risk of new waves and further muta-
                                                           tions reasonably under control. In Eu-
                                                           rope, but also in India, we can assume
                                                           that the spring wave is underway, while
                                                          in the southern hemisphere the corre-
                                                          sponding autumn wave is underway. It
                                                          will be interesting to see whether and
                                                          how a new wave will form in the USA in
                                                          view of the vaccination progress on the
                                                          one hand and a complete opening in a
                                                          number of states on the other. The big-
                                                          gest and not really tangible risk factor
                                                          remains the virus mutations, most re-
                                                          cently reported from Brazil and India.
Source: Our World in Data

Overall, the pandemic situation is improving from month to month. The logistical and political
challenges remain high, a pandemic-weary population must be kept happy and risks of more
dangerous mutations exist. For the time being, the goal of vaccination campaigns will have to
be limited to quickly returning people and the economy to a normal life and at the same time

                                                                         Economic environment 5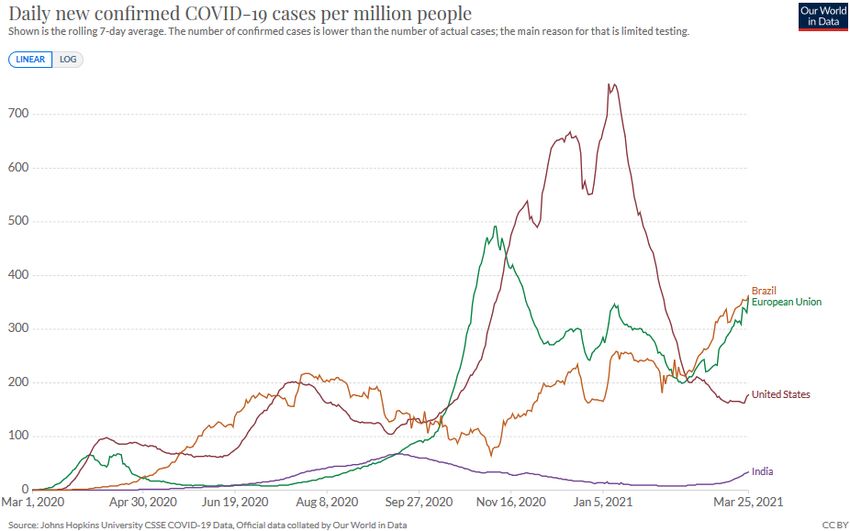
drastically reducing the negative aspects (deaths, long-term consequences, burden on the
health system). So-called herd immunity is illusory for the time being.

Economy - Manufacturing as driving factor / Rising producer prices

                                           The latest Purchasing Managers' Indices (PMIs) sug-
 The economy continues to sur-
                                           gest that the economy is looking beyond any remaining
 prise in the first quarter. Globally
                                           short-term difficulties due to the pandemic. The manu-
 oriented manufacturing as a
                                           facturing sector is proving to be the driving force. For
 bright spot and consumption im-
                                           example, the German manufacturing PMI in March
 proving. Producer prices rise
                                           reached its best value since the financial crisis and the
 more than having seen in a long
                                           third best value since the index was calculated. The PMI
 time due to several factors.
                                           for the Eurozone as a whole was also convincing and
exceeded expectations for March. In the US, unlike in Europe, the service sector now also seems
to be performing very well. This is likely to be an impact of the faster progress on vaccinations
described above. The weather-related setback in the USA in February was temporary at best.
So-called "nowcast" estimates suggest that
the US is at the beginning of a very strong
growth phase. The PMIs for China currently
signal that the Chinese economy needs to di-
gest the recovery ahead of the other blocs.
Overall, growth in the first quarter is likely to
be better than expected. The difference in the
pace of recovery between manufacturing and
services is due to the more global nature of
the former and the more local nature of the
latter. The trend in the household savings rate
was striking, particularly in the US and Europe,
where it had risen sharply during the pan-
demic. Some of this is expected to flow into
consumption and additionally drive the econ-
omy (so-called pent-up demand). But compa-
nies globally have also built up substantial
savings cushions that offer considerable in-
vestment potential. Better-than-expected
growth is increasingly leading to an imbal-
ance between the supply of and demand for
goods. The PMI reports are peppered with
statements about rising commodity prices,
                                                     Source: Refinitiv / Own representation
sharply higher transportation costs, disrupted
supply chains, slower delivery times and increasing backlogs in order processing. The current
shortage of semiconductors (chips) also falls into this context, which is a consequence of the
technologisation during the pandemic and the trade war between the US and China. It will take
some time before additional capacity in all this segments is created. This could inhibit the speed
of the recovery and cause producer prices to rise further.

Overall, we assess the economic outlook as positive. The US economy is currently developing
very dynamically across the board. The planned economic stimulus p rogrammes could even

                                                                           Economic environment 6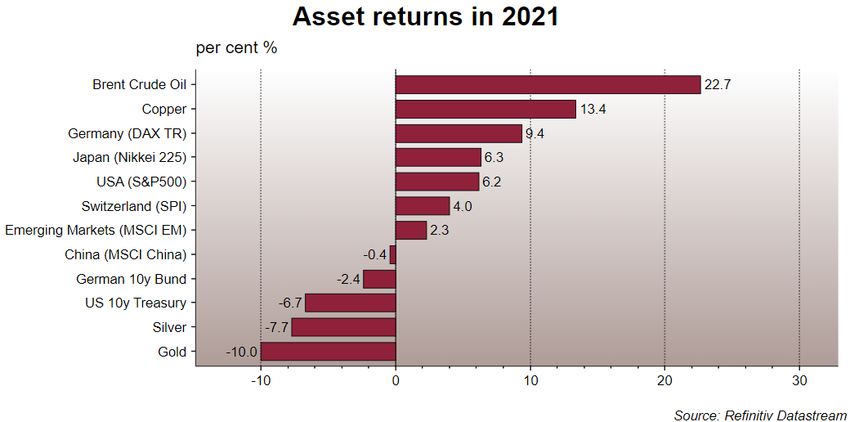
lead to temporarily stronger growth than in China. With the upcoming opening of the economy
in Europe, the consumer segment in this region, which has so far lagged behind, should finally
contribute to growth in the course of the second quarter. The asynchronous upswing should
then turn into a synchronous one. Whether the economy has already fully emerged from reces-
sion is a matter of interpretation. Looking at the current levels of growth and forward-looking
indicators, one can declare the recession over. On the other hand, unemployment figures are
still at a high level in many regions, which is why there is still some way to go before a full
recovery can be achieved. It is therefore not surprising that monetary policy continues to be
supportive and fiscal policy remains expansionary. For the financial and capital markets, a de-
cisive factor will be whether companies can pass on the increased input prices to consumers.
The development of the pandemic remains the biggest risk factor for our positive assessment.

Monetary and Fiscal Policy - Active fiscal policy and reactive monetary policy

                                          Despite declining importance, US monetary policy is still
 Biden administration could launch
                                          a globally determining factor due to the USD's position
 programmes totalling up to USD 6
                                          as the current leading trade and credit currency.
 trillion this year. Monetary policy
                                          Changes in monetary policy or in the interest rate struc-
 will have to deal with increasing
                                          ture in the USA also have a certain guiding character.
 challenges.
                                          The Biden administration is intensifying efforts to imple-
                                          ment further economic stimulus programmes. Pan-
demic aid to the tune of USD 1.9 trillion was pushed through the Democratic chambers at the
beginning of March. Next up are infrastructure programmes worth at least another USD 2 trillion,
which are likely to have a somewhat tougher time. It is
also possible that student loan debt forgiveness of          Biden infrastructure programme in
                                                             billion USD
USD 1 trillion could follow. Such substantial pro-
grammes were last launched in the years after World
War II. Today, as then, the primary goal of monetary
and fiscal policy is a quick recovery of the labour mar-
ket and the economy. However, these new pro-
grammes must be financed. At present, the US gov-
ernment is still reducing the available balances at the
US-Fed. But by the third quarter at the latest, it will
have to turn increasingly to the financial and capital
markets again to find financing sources to cover the
immense new debt. There, it will encounter declining
foreign interest in US government securities, thus it
can be assumed that higher interest rates will be
                                                             Source: USA Today / Own representation
needed to make the new debt more attractive. Compli-
cating matters are the above-mentioned development of rising prices (inflation), which could be
fuelled by an economic boom at least in the short term, as well as the existing yield curve with
short-term interest rates close to zero and a general rejection in the USA of negative interest
rates. This mix could lead to sharply rising long-term interest rates and undermine the sustain-
ability of government debt, which in turn could lead to rating cuts and even higher interest rates.
As in the 1940s, the key will lie with the US Fed. To counteract this development, the Fed will
probably have to resort to so-called yield curve control ("YCC"), as it did back then, to counteract

                                                                           Economic environment 7
too sharp a rise at the so-called long end of the yield curve. This means a far-reaching abandon-
ment of Fed independence, further growth of the central bank balance sheet (probably to over
USD 10 trillion) and a shift in investments from short- to long-term US government bonds. Since
YCC is unpopular, it will probably take an event of some kind (bond market crash, stock market
crash, US Treasury buyer's strike, etc.) to justify a next level of intervention. Despite its current
strength, the USD is likely to suffer the most from such a possible development. Whether other
economic blocs will stand idly by and watch a collapse in the value of the USD, as was the case
in the past, remains to be seen.
The European Central Bank has so far made no change in its basic monetary policy stance. Of
note was the statement that higher market interest rates could jeopardise the recovery of the
economy, which puts the ECB in a similar position to the US Fed. In addition, fiscal policy has
so far been much less aggressive than in the US, which keeps the pressure on the central bank
high in the short term. As a result, the planned bond purchases for the second quarter were
increased. As a company whose shares are listed on the stock exchange, the Swiss National
Bank presented its balance sheet. Foreign currency reserves increased by another CHF 110 bil-
lion and the balance sheet total is expected to exceed the CHF 1 trillion threshold in the current
year. The annual profit, the provisions for currency reserves and the reserves for distributions
to the Confederation and the cantons, which reached a volume of CHF 84 billion, also rose
sharply. Remarkable for a country with just over 8.7 million inhabitants.
Despite a visibly improving economic situation, the US government under Biden is seizing the
moment to implement further substantial programmes. The infrastructure package of a planned
USD 2 trillion will probably be the subject of much discussion in the second quarter. The focus
will be on possible consequences for taxation. The second half of the year will be more im-
portant, when the US government will have to tap the bond markets again to raise the necessary
money. The first quarter saw the first disappointing auctions of US government bonds, which is
not necessarily positive in view of the enormous need for financing.
Economic environment 8Financial and capital markets
Rising volatility due to interest rates
Financial and Capital Markets - Rising interest rates and rising stock markets
Factors shaping the financial and capital markets in the
Economic hope makes the stock
first quarter were economic hopes and fears of inflation,
markets rise. Rising inflation ex-
rapidly rising long-term interest rates in the USA as well
pectations cause interest rates to
as sector rotation and episodes reminiscent of ex-
rise. Rising interest rates increase
cesses on the stock markets. Especially on the US eq-
volatility in the financial and capi-
uity markets, the performance of the last four quarters
tal markets.
up until the end of March was among the best since the
relevant equity indices came into existence. For example, the current performance from
1.4.2020 to 31.3.2021 of the Dow Jones Industrial of almost 51% was only surpassed in 1899,
1915, 1929 and 1936. A similar 12-month performance was last achieved in 1983, when the
economy was also recovering from a deep recession. Furthermore, there was a lot of talk about
the so-called "Wallstreetbets" (or "Robinhooders", derived from the corresponding free finance
portal), who significantly influenced individual stocks and triggered juicy price jumps, even c aus-
ing hefty losses for one or the other hedge fund. The massive use of options by the "Robinhood-
ers" is remarkable. At the end of the quarter, the focus shifted to a hedge fund (or family office)
that, according to current knowledge, had to engage in a forced liquidation of its equity portfolio
due to record-high margin
calls. The portfolio was appar-
ently built up on highly lever-
aged derivatives with various
banks as counterparties. This
led to sharp corrections in in-
dividual stocks that had previ-
ously seen its prices being
driven upwards and probably
to large losses at at least two
banks (Nomura and Credit
Suisse). But also, in the area of fixed income investments, there was a collapse in a fund that
was active in the area of "supply chain finance", i.e. the financing of short-term trade transac-
tions. All three examples have in common the partly excessive use of either debt or derivative
based financial products, which are the same thing from an economic point of view (so-called
"leverage").
Fixed income
The dominant topic in the first quarter was the development of long-term interest rates in the
USA. In the last quarterly report, we had already pointed out that the yield curve had begun to
steepen due to rising economic optimism and rising inflation expectations. The speed of the
rise in the first three months surprised not only us. In absolute terms, interest rates are still at a
very low level and only the pandemic gap has been filled. However, the consequences of the
higher market interest rates have left clear traces in certain market segments. Long-dated
Financial and capital markets 9bonds in the USD area have suffered signifi-
cant losses. For example, the performance of
the so-called "TLT", an ETF (exchange-traded
fund) on US government bonds with an
average maturity of 20 years, is almost -10%
ytd. Interest rate markets are quite closely
coupled with each other. It is therefore not
surprising that long-term interest rates in
Europe also followed this rise, albeit to a
much lesser extent. The effects were
correspondingly smaller. Nevertheless, the
ultra-long 100-year Austrian government
bond, for example, suffered a loss in value of 26% in the current year. Short-term interest rates
diverged slightly between Europe (slightly higher) and the US (slightly lower) due to the different
pace of pandemic development and vaccine distribution. The dilemma central banks face is the
steepness of the yield curve, which can be seen in the difference between 2-year and 10-year
US-Treasury bonds. In past economic upswings, the difference reached a level of up to 2.5%.
Currently the difference is 1.55%. Since it is no longer possible to lower interest rates at the
short end, the steepening can only occur
due to higher long-term interest rates. Yield difference USD 10yrs
Renditedifferenz USD– 10j
2yrs- 2j
Moreover, long-term interest rates are 4 1
0.9
mainly influenced by market forces, 3
0.8
whereas short-term interest rates can be 2 0.7
controlled more directly by monetary 1 0.6
0.5
policy (see the remarks on "yield curve 0 0.4
control"). In summary, this means that in -1 0.3
light of the current economic upswing a -2 0.2
0.1
level of 10-year US interest rates of around -3 0
2.6% would be quite opportune, i.e.
another 1% higher than at present. We
grey areas = recessions in the USA
doubt that the financial and capital Source: Refinitiv / Own representation
markets can absorb such an increase
without complications.
Despite the recent rise, interest rates in the largest economic areas are likely to remain at a low
level. For the second quarter, we expect only slight further progress in interest rates, as we wait
for the first indications about the further development of inflation and its sustainability. Whether
inflation will also be sustainably higher, which we currently assume, will become clear in the
second half of the year when the year-on-year base effects will subside. The US government's
enormous financing needs will be accentuated from the second quarter onwards. Thus, nothing
should stand in the way of interest rates rising again more strongly in the third quarter. Overall,
it will remain difficult to generate reasonable returns with bonds in 2021. Corporate bonds are
likely to outperform government bonds, and in our view inflati on-linked bonds belong in well-
diversified portfolios. Keep duration short.
Financial and capital markets 10Equities
Overall, the positive trend on the Annual performance of the sectors in the Stoxx Eu-
global stock markets, which has rope 600 as at 29.3.2021
been ongoing since last November, STOXX Europe 600 Automobiles & Parts EUR Price Index 20.50
STOXX Europe 600 Travel & Leisure EUR Price Index 17.79
continued. The rather high volatility in
STOXX Europe 600 Banks EUR Price Index 17.48
individual market segments and STOXX Europe 600 Basic Resources EUR Price Index 12.86
shares was striking. From the STOXX Europe 600 Telecommunications EUR Price Index 11.91
STOXX Europe 600 Insurance EUR Price Index 11.66
perspective of both regions and STOXX Europe 600 Construction & Materials EUR Price Index 11.46
sectors, there was a change in STOXX Europe 600 Technology EUR Price Index 10.88
STOXX Europe 600 Media EUR Price Index 10.42
leadership and economic optimism
STOXX Europe 600 Oil & Gas EUR Price Index 9.92
and rising interest rates left their STOXX Europe 600 Industrial Goods & Services EUR Price Index 8.11
mark. Cyclically sensitive equity STOXX Europe 600 Chemicals EUR Price Index 7.27
STOXX Europe 600 Financial Services EUR Price Index 6.03
markets and sectors were able to STOXX Europe 600 Retail EUR Price Index 5.38
outperform the more defensive and STOXX Europe 600 Personal & Household Goods EUR Price Index 3.72
STOXX Europe 600 Food & Beverage EUR Price Index 2.21
interest rate sensitive sectors quite STOXX Europe 600 Health Care EUR Price Index 1.20
clearly. Shares from the "old STOXX Europe 600 Utilities EUR Price Index -0.67
economy" segment performed STOXX Europe 600 Real Estate EUR Price Index -2.69
Source: Refinitiv / Own representation
significantly better than the
previous stock market favourite, technology. In other words, the value stocks were able to beat
the growth stocks. Furthermore, the shares of small and medium-sized stocks performed better
on average than the shares of the so-called "large caps". In the emerging markets, the high
volatility of Chinese equities stood out. Financial market sanctions by the USA and the Chinese
government's influence on large companies have been weighing on share prices since mid -
February. The problems at the hedge fund/family office mentioned above may also have played
a certain role.
Many equity markets have already been able to outperform an average annual performance in
the first quarter. Historically, it is not particularly unusual for equity markets that are in a strong
upward trend to achieve positive performance for more than 4 quarters in a row; especially when
the economy was in a phase of growth after a recession. We therefore see a good chance for
another positive quarter. However,
rising interest rates meeting high val-
uations will lead to an environment of
continued high volatility especially for
growth stocks. Some technical indi-
cators point to certain signs of fa-
tigue in the equity markets in the
short term. Nevertheless, we do not
expect a possible hot phase on the
equity markets until the course of the
third quarter. We are not making any
significant adjustments to our sector Source: Refinitiv / Own representation
preference. We continue to favour companies from the "old economy", especially those related
to infrastructure. In the meantime, European stocks exhibit the strongest earnings growth ex-
pectations. We consider the Asian economic area to be the region with the strongest sustaina-
ble growth. Despite generally rather high valuations In the USA, attractive investments can still
be found in the value segment. However, our regional focus is on Europe and the emerging
Financial and capital markets 11markets. In financials, we prefer insurance companies. Rising interest rates and steep yield
curves argue for a stronger exposure to banks. However, recent events once again impressively
showed that the risks in banks are hardly discernible and can strike out of nowhere. Inflationary
trends are usually a good environment for equities, as profits, unlike interest rates, are variable.
However, one challenge for companies will be to pass on rising costs to consumers. Those that
fail to do so will have to live with lower margins. Quality companies usuall y find it easier to pass
on higher costs.
Precious metals and commodities
The better-than-expected development of
the economy and the shift to more sus-
tainable forms of energy production, that
is consuming a lot of basic resources and
industrial metals, is coming up against a
commodity sector that has had to shrink
in recent years at the expense of new in-
vestments. It takes years for new capacity
(mining projects) to come to market. The
result is a supply deficit and consequently
rising prices. Especially in lesser-known
metals, there have already been substan-
tial price increases. Even copper is showing signs of a supply deficit. Some argue that US Pres-
ident Biden was the best thing that could have happened to the oil price. Here they point to the
fact that under Biden oil supply is going to be restricted, which benefits the oil price. The Suez
Canal accident also made us realise the fragility of the already strained global supply chains
after the pandemic. Overall, commodity prices continued the upward trend of the fourth quarter,
led by oil and copper.
The recent decline in gold's relative attractiveness due to rising interest rates, a stronger USD
and economic optimism currently still outweighs the above-described prospects of rising infla-
tion, further growing central bank balance sheets, negative real interest rat es and a potentially
prolonged loss of confidence in paper currencies. Physical gold continues to play a very im-
portant role in maintaining the real purchasing power of a portfolio over the long term. Not only
inflation can destroy the real purchasing power of assets, but also a wave of bankruptcies
caused by deflation. Gold has proven its
worth in both cases. However, there is no
denying that this positioning is currently
weighing on the performance of a portfolio.
We see this as a temporary development; it
remains to be seen when it will end, but
sentiment and capital flows suggest that
we are nearing the end of this phase, which
has already lasted more than seven
months. For us, the situation with inflation
and gold is comparable to the tsunami ef-
fect, where the sea recedes before the tidal
wave reaches land.
Financial and capital markets 12Commodities have already performed much stronger than we anticipated at the beginning of
the year. Increasing supply deficits should continue to support prices. We therefore expect the
positive trend to continue. After a difficult phase, precious metals – gold and silver – should
soon start to perform better again. From a longer-term perspective, we consider the still ongoing
downward movement to be a trend-confirming consolidation. The next wave is likely to be the
most pronounced and longest, carrying the gold price well above USD 2,000 per ounce. With a
downside risk to the USD 1,650 per ounce range, this seems to us a very attractive risk -return
ratio. The negative correlation of gold to equities should also be mentioned positively, as bonds
now only offer limited protection in view of the existing low interest rates, the inflation outlook
and losses in value when interest rates rise. We also have not changed our opinion on silver and
see this metal as even more attractive due to its industrial use. But silver will not follow a linear
path either.
Currencies
An extremely one-sided attitude in the financial markets often brings the opposite of what was
expected. This is what happened with the USD. We were not alone in thinking that the USD would
depreciate in the face of twin deficits and new debt. Short positions reached record levels. In
addition to purchases due to short-covering, investors were probably also convinced by the ex-
cellent growth prospects, the comparatively rapid progress on vaccinations and rising interest
rates. Thus, USD weakness suddenly turned into USD strength. However, the "strength" mainly
refers to the EUR and some emerging market currencies that are struggling with specific prob-
lems (Turkey and Brazil). One of the weaker currencies was the Swiss franc, which is again less
in demand in an environment supported by economic optimism. In the case of the JPY, inves-
tors must increasingly ask themselves to what extent this currency can still be considered a
safe haven.
We assume that the USD strength is of temporary nature and that with the improvement of the
pandemic situation in Europe, the twin deficits of the USA will come to the fore again. The cur-
rencies will therefore return to the familiar ranges. We see a range of 0.87-0.92 for the USD
against the CHF, 1.07-1.09 for the EUR against the CHF and 1.19-1.25 for the USD against the
EUR. We are fundamentally positive about emerging market currencies due to the long-term
growth advantages, especially in Asia.
Financial and capital markets 13Graphics and tables
Key economic expectations for the year 2021
Source: M.M.Warburg Bank, IMF, ECB, US Fed, KOF, own estimates
Vaccine approvals
globally - April 2021
Source: N.Y.Times
Graphics and tables 14Development of house prices in the USA measured by the S&P Case-Shiller Home Price Index
Development of the GameStop and ViacomCBS shares - To the moon and back again
GameStop ViacomCBS
Source: Refinitiv / Own representation
Money supply development and inflation in the USA in long-term comparison
Source: Merrill Lynch
Graphics and tables 15Market Overview 2020
So urce: Reuters per 31.03.2021/ Equity M arkets in lo cal currency
Economic Indicators per Close Close prev. Year YTD
University o f M ichigan Co nsumer Sentiment Index 30.09.2020 79.0 80.7 -1.7
ISM M anufacturing P M I SA 31.03.2021 64.7 60.5 4.2
ISM No n-M anufacturing NM I 31.03.2021 63.7 57.7 6.0
US Leading Indicato r Index 28.02.2021 110.5 109.7 0.8
ZEW Euro zo ne Expectatio n o f Eco no mic Gro wth 31.03.2021 74.0 54.4 19.6
Ifo P an Germany B usiness Climate 31.03.2021 100.4 93.1 7.3
S&P Co reLo gic Case-Shiller 20-City Co mp. Ho me P rice NSA Index
31.01.2021 243.0 240.9 2.1
Currency vs. CHF per Close Close prev. Year YTD
EUR 31.03.2021 1.1070 1.0807 +2.4%
USD 31.03.2021 0.9434 0.8851 +6.6%
GB P 31.03.2021 1.3000 1.2102 +7.4%
SEK 31.03.2021 10.8000 10.7400 +0.6%
JP Y 31.03.2021 0.8520 0.8571 -0.6%
A UD 31.03.2021 0.7168 0.6806 +5.3%
Currency vs. EUR YTD
USD 31.03.2021 1.1732 1.2217 -4.0%
CHF 31.03.2021 0.9038 0.9251 -2.3%
GB P 31.03.2021 1.1751 1.1189 +5.0%
SEK 31.03.2021 0.0977 0.0995 -1.8%
JP Y 31.03.2021 0.7700 0.7926 -2.9%
A UD 31.03.2021 0.6477 0.6298 +2.8%
Equity Markets in local currency per Close Close prev. Year YTD
M SCI Wo rld Index (USD) 31.03.2021 2’ 811.7 2’ 690.0 +4.5%
M SCI Emerging M arkets Index (USD) 31.03.2021 1’ 316.4 1’ 291.3 +1.9%
Do w Jo nes (USD) 31.03.2021 32’ 981.6 30’ 606.5 +7.8%
S&P 500 (USD) 31.03.2021 3’ 972.9 3’ 756.1 +5.8%
Nasdaq Co mpo site (USD) 31.03.2021 13’ 246.9 12’ 888.3 +2.8%
Russell 3000 (USD) 31.03.2021 2’ 382.7 2’ 248.4 +6.0%
B razil B OVESP A (B RL) 31.03.2021 116’ 633.7 119’ 017.2 -2.0%
DA X (EUR) 31.03.2021 15’ 008.3 13’ 718.8 +9.4%
Euro Sto xx50 (EUR) 31.03.2021 3’ 919.2 3’ 552.6 +10.3%
IB EX 35 (EUR) 31.03.2021 8’ 580.0 8’ 073.7 +6.3%
SP I (CHF) 31.03.2021 14’ 015.0 13’ 327.9 +5.2%
SM I (CHF) 31.03.2021 11’ 047.4 10’ 703.5 +3.2%
FTSE (GB P ) 31.03.2021 6’ 713.6 6’ 460.5 +3.9%
RTS (USD) 31.03.2021 1’ 477.1 1’ 424.8 +3.7%
Nikkei 225 (JP Y) 31.03.2021 29’ 178.8 27’ 258.4 +7.0%
China Shanghai Co mp. (CYN) 31.03.2021 3’ 441.9 3’ 473.1 -0.9%
India B SE 30 (INR) 31.03.2021 49’ 509.2 47’ 751.3 +3.7%
A ustralia S&P /A SX200 (A UD) 31.03.2021 6’ 790.7 6’ 587.1 +3.1%
Interest Rates and Bond Markets per Close Close prev. Year YTD
3-M o nth Euribo r 30.03.2021 -0.54% -0.55% 0.00%
10-Years Germany Generic Go vernment 31.03.2021 -0.29% -0.58% 0.28%
10-Years EUR Swap 31.03.2021 0.07% -0.27% 0.34%
3-M o nth ICE USD-Libo r 30.03.2021 0.20% 0.24% -0.04%
10-Years US Generic Go vernment 31.03.2021 1.75% 0.91% 0.83%
10-Years USD Swap 31.03.2021 1.77% 0.92% 0.85%
3-M o nth ICE CHF-Libo r 30.03.2021 -0.76% -0.76% 0.00%
10-Years Switzerland Generic Go vernment 31.03.2021 -0.28% -0.52% 0.24%
10-Years CHF Swap 31.03.2021 0.04% -0.29% 0.33%
IB OXX Euro Go vernment 3-5 Jahre 31.03.2021 211.6 212.5 -0.4%
REX P erfo rmance Index (German Go vernment B o nds) 31.03.2021 493.7 499.2 -1.1%
IB OXX Euro Co rpo rates 3-5 Jahre 31.03.2021 242.3 244.2 -0.8%
Swiss B o nd Index A A A -B B B 31.03.2021 143.2 144.8 -1.1%
Emerging M arkets Hard Currency in USD (ETF) 31.03.2021 108.9 115.9 -6.1%
Emerging M arkets Lo cal Currency in USD (ETF) 31.03.2021 42.6 45.3 -5.9%
CS High Yield Index II 31.03.2021 1’ 512.0 1’ 498.4 +0.9%
Alternative Investments per Close Close prev. Year YTD
VIX-Index (Vo latility S&P 500) 31.03.2021 19.4 22.8 -14.7%
RICI Co mmo dity Index (To tal Return, USD) 31.03.2021 196.6 178.3 +10.2%
Go ld in USD/Oz 31.03.2021 1’ 707.0 1’ 896.5 -10.0%
Go ld in CHF/kg 31.03.2021 1’ 610.6 1’ 680.0 -4.1%
Go ld in EUR/Oz 31.03.2021 1’ 455.2 1’ 553.7 -6.3%
Silver in USD/Oz 31.03.2021 24.4 26.4 -7.5%
Crude Oil B rent USD (Future) 31.03.2021 63.5 51.8 +22.7%
Co pper (Future) 31.03.2021 400.3 351.4 +13.9%
B altic Dry Index 31.03.2021 2’ 046.0 1’ 366.0 +49.8%
HFRX Glo bal Hedge Fund Index (USD) 31.03.2021 1’ 377.9 1’ 292.5 +6.6%
LP X50 (P rivate Equity) 31.03.2021 3’ 420.6 2’ 913.0 +17.4%
Market 16You can also read