Q1 2015 Company Presentation - Media Corporate IR Net
←
→
Page content transcription
If your browser does not render page correctly, please read the page content below
Q1 2015 Company Presentation
Company and
Portfolio Overview

Portfolio Overview
Operating Portfolio Statistics Strong Anchor Tenants
40 Jumbo anchors/shadow anchors (100k+ sq ft) draw from
Number of properties in portfolio (1) a large trade area; make the centers difficult to replicate
Approx. total GLA (SF) (1) 7.6M Credit tenants provide stability to revenues; over 80%
national and regional tenants
Weighted average lease term (2) 7
Weighted average portfolio age (2) 8
Percent leased (1) 93.9%
Portfolio price/sq. ft. (1) $200
3 / 5 mile weighted average HH income (1) $92K / $89K
3 / 5 mile weighted average population (1) 59K / 140K
Notes: (1) As of 12/31/2014, excludes unconsolidated properties and development properties
(2) As of 12/31/2014, excludes unconsolidated properties and development properties; weighted by GLA
(3) Source: AGS 2014. Weighted by GLA; includes properties under development using pro forma GLA
2
High Quality Anchor Tenants

                                                                                         BAML - General Merchandiser
                           Top 10 Tenants by Annualized Base Rent (1)   % ABR                     Score (2)

                                          Dick’s Sporting Goods         2.6%
                                                                                  EXL                                3.86
                                                                                  KRG
                                            Ross Dress for Less         2.5%      RPT
                                                                                  FRT
                                                    Publix              2.4%       KIM
                                                                                  DDR
                                                    Kohl‘s              2.1%      BRX
                                                                                  ROIC
                                                  PetSmart              2.0%      RPAI
                                                                                  CDR
                                 Edwards Theatres (Regal Cinemas)       2.0%      WRI
                                                                                  AAT
                                               Whole Foods              1.9%      BFS
                                                                                  EQY
                                              TJX Companies             1.8%       IRC
                                                                                  AKR

                                           Bed Bath & Beyond            1.7%      UBA
                                                                                  REG                         2.94

                                                    Jo-Ann              1.7%             0     1    2     3          4      5

    (1) As of 12/31/2014
    (2) Bank of America Merrill Lynch Research, May 2014
3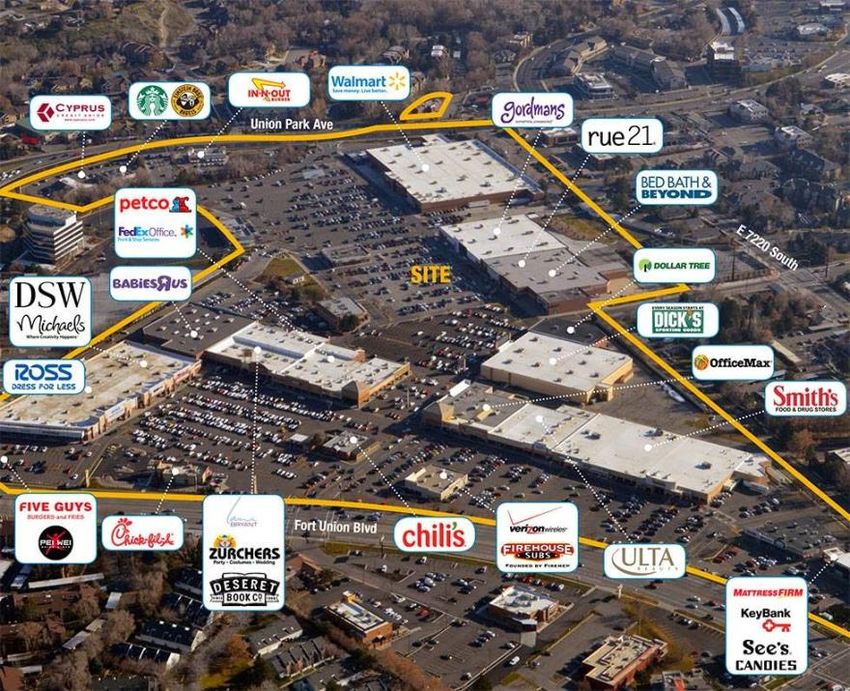
Stable Anchors with Staggered Maturities

                                                       Inline -% of Total   Anchor - % of Total   Total Retail GLA Expiring

                    Anchor vs. Inline - GLA                2015

                                                           2016

                                                           2017

           31%                                             2018

                                                           2019
                                              Anchor
                                                           2020
                                              Inline
                                                           2021
                                      69%
                                                           2022

                                                           2023
                                                       Beyond
                                                        2023
                                                                  0%          10%          20%         30%

    Note: As of 12/31/2014

4
Executing the Strategy - Acquisitions
~80% of ABR comes from Top 50 US MSA’s(1)
2014 – Acquired ~$417M around hubs/management offices
Northern
Highland Reserve $52.5M West Broad Marketplace
California $20M (land)
21% of ABR
Riverpoint Marketplace $43.8M
Ft. Union $131.5M
Orem $17M (sold 1-30-2015 for $21.5M) East
Coast
11% of ABR
Southeast
Southern 11% of ABR
5% of ABR
California
Legend Downtown at
EXL 2014 Acquisition Western the Gardens $140.2M
States
EXL Property Florida
29% of ABR
12% of ABR
EXL Office
Texas
11% of ABR
(1) Company filings and metropolitan statistical data (per website)
5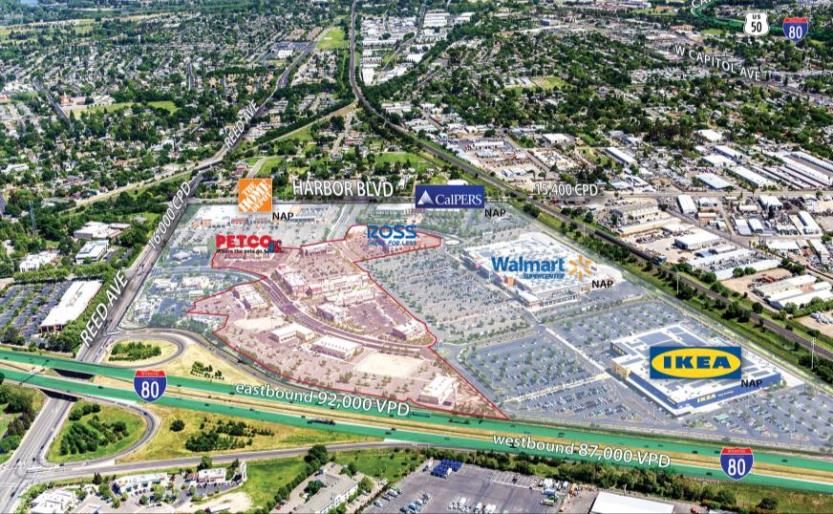
Sharpening our Focus - Dispositions

             Current Southeast Portfolio                                                                             Pro-Forma Proposed Dispositions(1)

                                                                        Mid Atlantic                                                                                                        Mid Atlantic

                                                               Southeast                                                                                                         Southeast

                               Florida                                                                                                           Florida

    (1) Contemplates the potential impact of properties in the southeast being marketed. Sales are subject to due diligence and other customary closing conditions. There can be no assurances that due
              diligence or other conditions will be satisfied or that the sales will close on the terms described herein, or at all.

6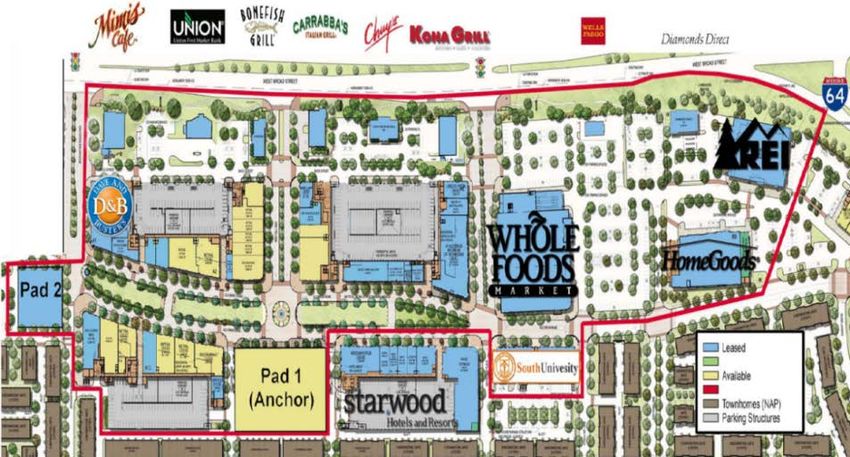
Sharpening our Focus – Disposition Profile

                                             Core Portfolio: Dominant Properties in Stronger Markets(1)

                                                                                                                                                                           Average Shopping Center
                 3 mile -               5 mile -
                                                                                          3 mile - AHHI            5 mile - AHHI                                              Size (sq ft owned)
                Population             Population
                                                                        $100,000                                                                          200,000
160,000                                                                                                                                                                                         189,000
                                                                                                   $92,000                                                180,000
                                              139,000                                                                        $89,000
140,000                                                                   $90,000
                                                                                                                                                          160,000
120,000                                                                                   $77,000
                                                                          $80,000                                  $75,000                                140,000

100,000                                                                                                                                                   120,000
                                                                          $70,000
                                                                                                                                                          100,000
    80,000
                                       69,000                             $60,000                                                                                                  73,000
                        59,000                                                                                                                              80,000
    60,000
                                                                          $50,000                                                                           60,000
    40,000
                 23,000                                                                                                                                     40,000
                                                                          $40,000
    20,000                                                                                                                                                  20,000

        -                                                                 $30,000                                                                                  -

    Pro-Forma SE Dispositions               EXL Portfolio                    Pro-Forma SE Dispositions                   EXL Portfolio                       Pro-forma SE Dispositions                 EXL Portfolio

      (1) Contemplates the potential impact of properties in the southeast being marketed. Sales are subject to due diligence and other customary closing conditions. There can be no assurances that due
                diligence or other conditions will be satisfied or that the sales will close on the terms described herein, or at all.

7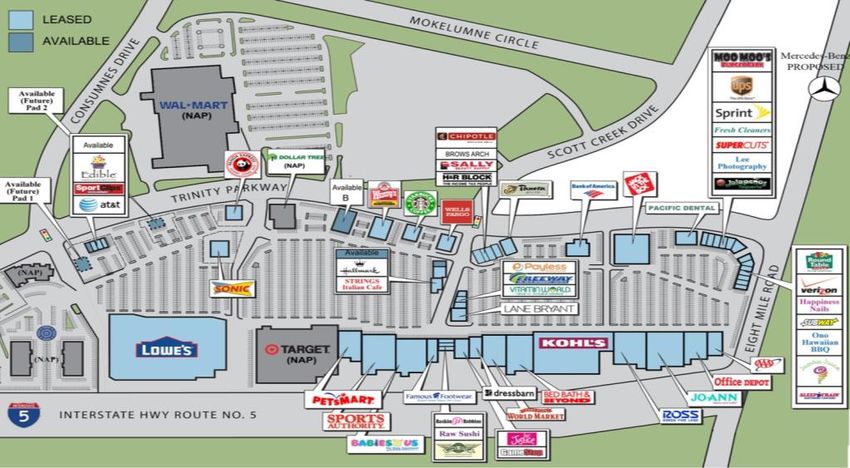
Recent Acquisitions
Shops at Fort Union – Salt Lake City, UT
Dominant Center / Infill Location
Value proposition: Acquired dominant asset via
relationship driven portfolio transaction
Part of three property portfolio purchased for
~$223M (subsequently sold two assets for
~$97M)
Retail: 97% leased ~689K sq. ft. shopping
center
Tenants include Walmart, Gordmans, Smith’s
Food, Ross Dress for Less, Dick’s Sporting
Goods, Bed Bath & Beyond, Ulta, DSW, Office
Max, Dollar Tree, etc.
Strong in-fill demographics: 3 / 5 mile average
HH income is $75K / $80K; population is 129K /
318K(1)
9
(1) Source: AGS 2014Downtown at the Gardens – Palm Beach Gardens, FL
Irreplaceable real estate sourced through relationships
Value proposition: capitalized on relationship with seller to purchase
off-market one of the region’s most dominant properties at an
attractive price
Retail purchased for ~$140M
Tenants include Whole Foods, Cheesecake Factory, Golfsmith,
Cobb Theaters, West Elm, and Urban Outfitters
Retail: 99% leased ~339K sq. ft. shopping center
Strong demographics: 3 / 5 mile average HH income is $107K /
$103K; population is 65K / 147K(1)
10
(1) Source: AGS 2014Riverpoint Marketplace – Sacramento, CA
Draws from Large Trade / Freeway Visibility
Value proposition: Acquired dominant asset in
target market
Retail: 97% leased 133K sq. ft. shopping center
acquired for $43.8M
Tenants include Ikea (non-owned), Super
Walmart (non-owned), Home Depot(non-
owned), Ross Dress for Less, and Petco
I-80 frontage with 92K VPD; draws from a large
trade area as a result of its strong anchor
tenants
Demos: 3 / 5 mile average HH income is $62K /
$69K; population is 53K / 172K(1)
11
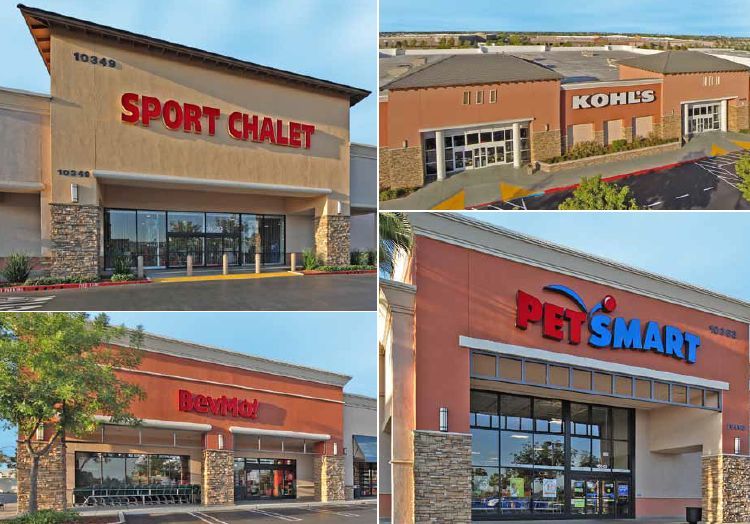
(1) Source: AGS 2014Highland Reserve Marketplace – Roseville, CA
Dominant Retail Corridor / Strong Demographics
Value proposition: Located around a management
hub in strong retail corridor; surrounded by healthy
demographics
Retail: 98.5% leased ~191K sq. ft. shopping center
acquired for $52.5M
Tenants include Target (non-owned), Kohl's, Sport
Chalet, PetSmart, and BevMo.
Strong in-fill demographics: 3 / 5 mile average HH
income is $90K / $91K; population is 93K / 190K(1)
12
(1) Source: AGS 2014West Broad Marketplace – Richmond, VA
Dominant Anchors Surrounded by Strong Incomes
Value proposition: Located around a management hub with
50% of GLA pre-leased to destination retailers
Cabela’s / Wegman’s on signed ground leases; account for
~50% of GLA
Well located: frontage on I-64
Cabela’s – reports that average store visit is 3-4 hours; can
draw customers from as far as 100 miles
Wegman’s –reported 2013 sales psf of ~$839; can draw
customers from 30-40 miles
Strong demographics: 3 / 5 mile average HH income is
$130K / $111K; population is 46K / 108K(1)
13
(1) Source: AGS 2014Portfolio Examples
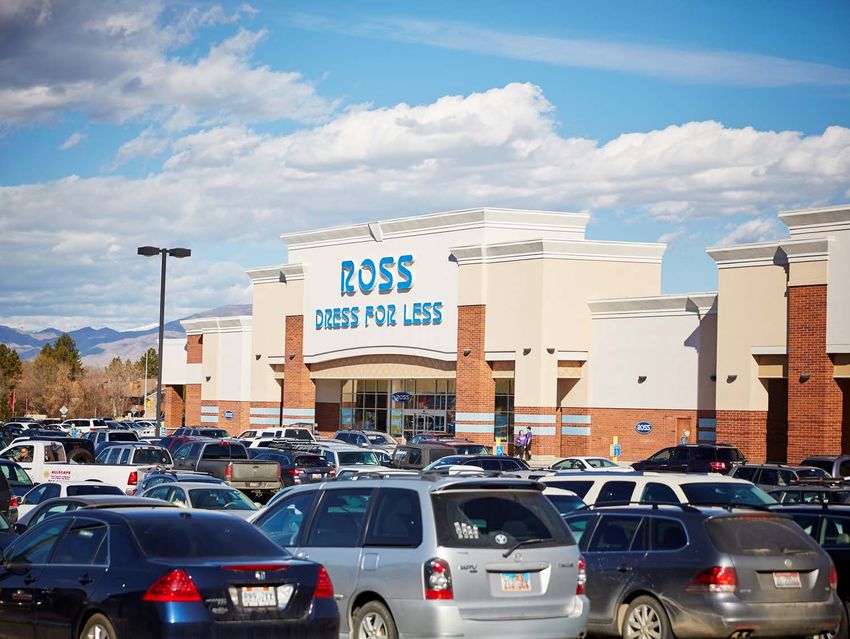
The Promenade – Scottsdale, AZ
Class A property in heart of dominant retail corridor
Value proposition: capitalized on economic downturn and relationship with seller to
purchase one of the region’s most dominant properties at an attractive price
Retail purchased for ~$110M on 7/2011, office towers purchased for $56M in
shares and cash on 1/2012, $16M ground lease on 10/2013
Tenants include Lowe’s (non-owned), Nordstrom Rack, Old Navy, Stein Mart,
Trader Joe’s, Cost Plus World Market
Retail: 94% leased ~730K sq. ft. power center (~567K sq. ft. owned)
Office: 83% leased ~256K sq. ft. Class A office towers
Robust sales per sq. ft.: Nordstrom Rack: ~$900, Trader Joe’s: ~$2,600
Strong demographics: 3 / 5 mile average HH income is $104K / $102K; population
is 58K / 178K(1)
15
(1) Source: AGS 2014West Broad Village – Richmond VA
High end mixed use center with leasing upside
Value proposition: Purchased off-market near the value of the property debt due
to direct negotiations with seller; upside potential from undeveloped pads and
vacant retail space
~77% leased mixed use center with ~397K sq. ft. of retail and office, 339
apartments, Starwood Loft (non-owned) and 493 townhomes (non-owned)
Acquired for $171M as part of a portfolio transaction
Major tenants: Whole Foods, HomeGoods, REI, Wells Fargo, Kona
Grill, Bonefish, Dave & Buster’s, First Market Bank, Mimi’s Cafe
Population in 3 / 5 mile radius: 78K / 153K (1)
Avg. HH income in 3 / 5 mile radius: $103K / $97K (1)
16 (1) Source: AGS 2014Plaza at Rockwall – Rockwall, TX
Power Center with Additional Value Created Through Expansion
Value proposition: Leveraged relationships with both the developer and
equity partner to acquire the property below market ; developed an additional
100K sq. ft. of retail space on vacant land included in deal, increasing yield
to nearly 10%
99% leased 432K sq. ft. Class “A” power center acquired 6/2010 for $41M
Anchored by JC Penney, Belk, Dick’s, Staples, Best Buy
Developed and stabilized vacant land, Located in Dallas suburb, ranked 2nd
wealthiest county in TX(1)
2nd best county in US for job growth (13% between 2010-12) (2)
Average HH income of $102K in a 3-mile radius (3)
Located at I-30 and Hwy 205 with highest daily traffic counts in county (98K
and 23K, respectively) (4)
Notes: (1) Source: 2000 Census based on median income
17 (2)
(2)
Source: CNN Money, August 2013
Source: AGS 2013
(3) Source: Texas DOT, 2009Park West Place – Stockton, CA
Strong Returns In Overlooked Market
Value proposition: capitalized on market dislocation to purchase one
of the region’s most dominant properties that outperformed during
the economic downturn
99% leased ~740K sq. ft. power center (~603K sq. ft. owned)
acquired off-market for ~$92.5M on 12/2010
Anchored by Target (non-owned), Lowe’s, Kohl’s, Sports Authority,
Jo-Ann, Ross, PetSmart, Cost Plus
Strong demographics: 3 / 5 mile average HH income is $85K / $76K;
population is 47K /115K (1)
Regional trade area draw with excellent frontage on I-5 freeway
18
(1) Source: AGS 2014Forward Looking Statements
Forward-Looking Statements Reporting Definitions
This presentation contains forward-looking statements that are based on current expectations, “Annualized Base Rent” or “ABR” is obtained by annualizing the contractual rental rate (excluding
forecasts and assumptions that involve risks and uncertainties that could cause actual reimbursements and percentage rent) during the final month of a reporting period.
outcomes and results to differ materially. These risks include, without limitation: adverse
economic or real estate developments in the retail industry or the markets in which Excel Trust “Funds from Operations” or “FFO” Excel Trust computes FFO in accordance with standards established
operates; defaults on or non-renewal of leases by tenants; increased interest rates and by the Board of Governors of NAREIT in its March 1995 White Paper (as amended in November 1999
operating costs; decreased rental rates or increased vacancy rates; Excel Trust's failure to and April 2002). As defined by NAREIT, FFO represents net income (computed in accordance with
obtain necessary outside financing on favorable terms or at all; changes in the availability of generally accepted accounting principles, or GAAP), excluding gains (or losses) from sales of property,
additional acquisition opportunities; Excel Trust's inability to successfully complete real estate plus real estate related depreciation and amortization (excluding amortization of loan origination costs)
acquisitions or successfully operate acquired properties and Excel Trust's failure to qualify or and after adjustments for unconsolidated partnerships and joint ventures. Excel Trust’s computation
maintain its status as a real estate investment trust, or REIT. For a further list and description of may differ from the methodology for calculating FFO utilized by other equity REITs and, accordingly,
such risks and uncertainties that could impact Excel Trust's future results, performance or may not be comparable to such other REITs. Further, FFO does not represent amounts available for
transactions, see the reports filed by Excel Trust with the Securities and Exchange Commission, management’s discretionary use because of needed capital replacement or expansion, debt service
including its final prospectus relating to its initial public offering and quarterly reports on Form obligations, or other commitments and uncertainties. FFO should not be considered as an alternative to
10-Q. Excel Trust disclaims any intention or obligation to update or revise any forward-looking net income (loss) (computed in accordance with GAAP) as an indicator of Excel Trust’s financial
statements, whether as a result of new information, future events or otherwise. performance or to cash flow from operating activities (computed in accordance with GAAP) as an
indicator of Excel Trust’s liquidity, nor is it indicative of funds available to fund cash needs, including
These forward-looking statements speak only as of the date of this presentation. We undertake Excel Trust’s ability to pay dividends or make distributions.
no obligation to update any forward-looking statements to reflect the events or circumstances
arising after the date as of which they are made. As a result of these risks and uncertainties, Excel Trust presents FFO because it is deemed an important supplemental measure of the company’s
recipients of this presentation are cautioned not to place undue reliance on the forward- operating performance and because it is frequently used by securities analysts, investors and other
looking statements included in this presentation or that may be made elsewhere from time to interested parties in the evaluation of REITs, many of which present FFO when reporting their results.
time by, or on behalf of, us. FFO is intended to exclude GAAP historical cost depreciation and amortization of real estate and related
assets, which assumes that the value of real estate assets diminishes ratably over time. Historically,
however, real estate values have risen or fallen with market conditions. Because FFO excludes
depreciation and amortization unique to real estate, gains and losses from property dispositions and
extraordinary items, it provides a performance measure that, when compared year−over−year, reflects
the impact to operations from trends in occupancy rates, rental rates, operating costs, development
activities and interest costs, providing perspective not immediately apparent from net income.
1
19Appendix
Excel Trust, Inc. : Timeline 2010 - Today
      Apr. 2010            Jan. 2011            Jun. 2011       Jan. 2012            Oct. 2012     Nov. 2013       May 2014           Jun. 2014

     $210M IPO              $50M                $157M             $92M                $117M         $100M            $250M             $168M
     NYSE:EXL             Convertible         Follow-on         Preferred            Follow-on      Private       Investment          Follow-on
                           Preferred           common             Stock              common        unsecured      grade public        common
                          Stock (7%         stock offering      (8.125%                stock         notes           bonds              stock
                           coupon)                              coupon)               offering                                         offering

                  2010                            2011                            2012                  2013                       2014

                                                                                                                        Gross
                           FFO                                          Revenues
                      ($ Per Share)                                     ($ In Millions)                           Undepreciated Assets
                                                                                                                           ($ In Millions)

                                         $0.92                                              $113                                             $1,280
     $1.00                                               $120                                            $1,400
                                                                                                                                   $1,116
                                 $0.74                   $100                        $84                 $1,200
     $0.80               $0.61
                                                          $80                                            $1,000
                                                                                                                            $706
     $0.60                                                                  $52                            $800
                                                          $60                                                       $449
     $0.40                                                                                                 $600
                                                          $40    $16
              $0.12                                                                                        $400
     $0.20                                                $20                                              $200
       $-                                                 $-                                                $-
             2010        2011    2012    2013                   2010   2011         2012   2013                    2010    2011    2012      2013

21
Investment Thesis
Long term leases with credit anchor tenants that offer value
Stability oriented goods and services
Income Dividend of $0.72 per year, yielding ~ 5.4% (1)
Value Stock trading below estimated NAV
Robust acquisition pipeline sourced through quality industry
Growth relationships
Notes: (1) Based on the declared dividend rate of $0.18 for Q1 2015 and the closing price of $13.39 as of 12/31/2014
22Balance Sheet
Capital Structure (1)
($ in thousands) Total % Total
Secured Debt $190,329 (2) 10%
Unsecured Debt $638,000 36%
Equity, Debt,
Total Debt $828,329 46% 47% 46%
Common Equity(1) $831,961 47%
Preferred Equity(3) $121,524 7%
Total Equity $953,485 54%
Preferred,
7%
Total Capitalization $1,7881,814 100%
Notes: (1) As of 12/31/2014. Common equity based on a closing price of $13.39 per share. Percentages have been adjusted slightly to sum to 100%
(2) Includes the Northside Plaza redevelopment bonds.
(3) At liquidation preference of $25.00 per share.
23You can also read