Investor Presentation - Q1 2018 - Asbury Automotive ...

Page created by Larry Crawford
 
CONTINUE READING
Investor Presentation - Q1 2018 - Asbury Automotive ...
Investor Presentation
       Q1 2018

 © Asbury Automotive Group 2018. All rights reserved.
Investor Presentation - Q1 2018 - Asbury Automotive ...
Forward Looking Statements and Non-GAAP Financial Information

To the extent that statements in this presentation are not recitations of historical fact, such statements constitute “forward-
looking statements" as such term is defined in the Private Securities Litigation Reform Act of 1995. The forward-looking
statements in this presentation may include statements relating to goals, plans, expectations, projections regarding our
financial position, results of operations, market position, capital allocation strategy business strategy and expectations of our
management with respect to, among other things: our relationships with vehicle manufacturers; our ability to improve our
margins; operating cash flows and availability of capital; capital expenditures; the amount of our indebtedness; the
completion of pending and future acquisitions and divestitures; future return targets; future annual savings; general
economic trends, including consumer confidence levels, interest rates, and fuel prices; and automotive retail industry trends.

The following are some but not all of the factors that could cause actual results or events to differ materially from those
anticipated, including: our ability to execute our business strategy; the annual rate of new vehicle sales in the U.S.; our ability
to generate sufficient cash flows; our ability to improve our liquidity position; market factors and the future economic
environment, including consumer confidence, interest rates, the price of oil and gasoline, the level of manufacturer incentives
and the availability of consumer credit; the reputation and financial condition of vehicle manufacturers whose brands we
represent and our relationships with such manufacturers, and their ability to design, manufacture, deliver and market their
vehicles successfully; significant disruptions in the production and delivery of vehicles and parts for any reason, including
natural disasters, affecting the manufacturers whose brand we sell; our ability to enter into, maintain and/or renew our
framework and dealership agreements on favorable terms; the inability of our dealership operations to perform at expected
levels or achieve expected return targets; our ability to successfully integrate recent and future acquisitions; changes in,
failure or inability to comply with, laws and regulations governing the operation of automobile franchises, accounting
standards, the environment and taxation requirements; our ability to leverage gains from our dealership portfolio; high levels
of competition in the automotive retailing industry which may create pricing pressures on the products and services we offer;
our ability to minimize operating expenses or adjust our cost structure; our ability to execute our capital expenditure plans;
our ability to capitalize on opportunities to repurchase our debt and equity securities; our ability to achieve estimated future
savings from our various cost saving initiatives and strategies; our ability to comply with our debt or lease covenants and
obtain waivers for the covenants as necessary; and any negative outcome from any future litigation. These risks,
uncertainties and other factors are disclosed in Asbury’s Annual Report on Form 10-K, subsequent quarterly reports on Form
10-Q and other periodic and current reports filed with the Securities and Exchange Commission from time to time.

These forward-looking statements and such risks, uncertainties and other factors speak only as of the date of this
presentation. We expressly disclaim any obligation or undertaking to disseminate any updates or revisions to any forward-
looking statement contained herein, whether as a result of new information, future events or otherwise.

                                                                                               © Asbury Automotive Group 2018. All rights reserved.
Investor Presentation - Q1 2018 - Asbury Automotive ...
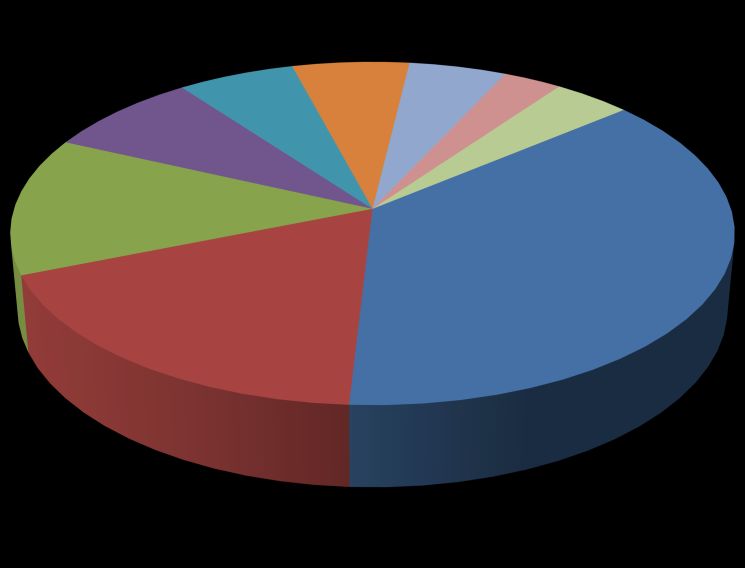
Asbury Automotive Group (NYSE:ABG)
 Fortune 500 automotive retailer                    29 vehicle brands (80% luxury / import)(2)
 7th largest U.S. based franchised auto retailer    Sold over 175,000 retail vehicles(1)
 ~$6.5 billion in total revenues(1)                 Handled about 2.0 million repair orders(1)
 81 dealership locations; 95 franchises(2)          Operating 25 collision repair centers(2)

                                                              New Vehicle Revenue by State

                                                                      Missouri     South
                                                        Mississippi     6%        Carolina Virginia
                                                             6%                     5%       3%
                                                     North                                                      Indiana
                                                    Carolina                                                      4%
                                                      8%
                                                            Texas
                                                             13%
                                                                                           Florida
                                       •HQ                         Georgia                  37%
                                                                    18%

                                                             For three months ending Mar. 31, 2018

         Fortune 500 automotive dealer group with attractive geographic presence
(1) For the year ended Dec. 31, 2017
(2) As of Mar. 31, 2018                                                           © Asbury Automotive Group 2018. All rights reserved.
Attractive Brand Mix

                                            2%
                                                                  Other
                           3%                                     15%
                                                                                20%

                 4%

                                                                                           11%
                   5%

                     6%
                                                                                      11%
                                         6%
                                                                  7%      10%

         Very attractive portfolio of brands; high concentration of import and luxury
Note: Based on new vehicle revenue for three months ended Mar. 31, 2018
                                                                                      © Asbury Automotive Group 2018. All rights reserved.
Our Strategy
 1. Drive Operational Excellence
   Attract and retain the best talent
   Implement best practices and improve productivity
   Provide an exceptional customer experience
   Centralize, streamline and automate processes
   Leverage our scale and cost structure to improve our operating efficiencies

 2. Deploy Capital to Highest Returns
   Continue to invest in the business
   Acquire dealerships meeting our criteria
   Return capital to stockholders

                    Two key principles to drive shareholder value

                                                                      © Asbury Automotive Group 2018. All rights reserved.
U.S. SAAR 1970 to 2018
                     20

                     18

                     16

                     14
 Millions of Units

                     12

                     10

                     8

                     6

                     4

                                            SAAR is hard to predict.
                      We attack what we can control: Used Vehicles, F&I and Parts & Service
                                                                               © Asbury Automotive Group 2018. All rights reserved.
The Four Key Components of Our Business
(Q1 2018)

                             4%

                            12%
                                                            26%

                            31%

                                                            47%

                            53%
                                                            12%

                                                            15%

                           Revenue                      Gross Profit
                           New       Used   Parts and Service          F&I

Used, Parts & Service and F&I account for 47% of revenue and 85% of gross profit
Note: Includes wholesale
                                                                         © Asbury Automotive Group 2018. All rights reserved.
Average Monthly CPO Unit Sales per Store

                                                                              Benefits of CPO Sales:
                                                                               Higher service retention
                                                                               Improved customer loyalty
                                                                               Solid internal profit
                                                                               Strong F&I per vehicle

                         An increasing supply of off-lease vehicles should support
                               continued CPO growth with ancillary benefits
Note: Performance only for stores continuously operating since January 2010
                                                                                       © Asbury Automotive Group 2018. All rights reserved.
F&I Gross Profit per Unit Sold
(Same-store F&I Revenue per Retail Unit Sold)

                                                                                                   $1,562   $1,559
                                                                                          $1,450
                                                                                 $1,390
                                                                  $1,338
                                                    $1,303                                                                     Financing
                                                                                                   32%       33%               % of Total
                                     $1,198
                       $1,105                                                             35%
                                                                                 35%
          $993                                                     36%
                                                     38%
                                      38%
                        39%
          39%

                                                                                                                               Insurance
                                                                                                                               % of Total
                                                                                                   68%       67%
                                                                                 65%      65%
                                                     62%           64%
                                      62%
                        61%
          61%

          2010          2011          2012          2013           2014          2015     2016     2017     Mar'18*
                                                                                                             YTD

                         Solid training and execution continue to drive F&I growth
Note: Excludes discontinued operations
*Includes a $13 PVR reduction due to the impact of ASC 606 revenue recognition                               © Asbury Automotive Group 2018. All rights reserved.
Parts & Services Gross Profit

                                                                                                                                                                                                                                                                  (1)
                                                                                                                                                                                                                                                      $345M
                                                                                                                                                                                                                                                         4%
                                                                                                                                                                                                                                      ​                                 Wholesale Parts
                                                                                                                          Total Fixed GP $
                                                                                                                            6% Average                                                                              ​
                                                                                                                                                                                                                                          ​             17%
                                                                                                                           Annual Growth                                                                                                                                   Warranty
                                                                                                                                                                                                   ​
                                                                                                                                                                                                                        ​
                                                                                                                                                                                  ​                    ​

                                                                                                                                                                ​                     ​
                                                                        ​                ​                                                     ​                                                                                              ​         23%             Reconditioning
                                                      ​                                                                       ​                                     ​                                                       ​
                                                                            ​                             ​                                        ​
                                     ​                                                       ​                                                                                                             ​
            (1)                                           ​                                                                       ​
 $159M                                                                                                                                                                                    ​
                                                                                                              ​
                    ​                    ​                                                                                                                              ​
                                                                                ​                ​                                                     ​
      6%                                                                                                                              ​
                        ​                                     ​                                                   ​
     19%                                     ​

                            ​                                                                                                                                                                                                                     ​     56%             Customer Pay
     16%                                                                                                                                                                                                       ​                ​
                                                                                    ​                ​                                                     ​                ​                 ​
                                                                  ​                                                   ​                   ​
                                                 ​
     59%                        ​

     2003         2004              2005             2006             2007              2008             2009               2010              2011             2012             2013              2014             2015             2016                2017

      More units in operation, online scheduling, CRM and improved technician / bay
utilization should drive mid-single digit parts and service growth through economic cycle
  (1) Performance only for stores continuously operating since 2003
                                                                                                                                                                                                                                                      © Asbury Automotive Group 2018. All rights reserved.
Online Service Appointments

                                                               92K                  94K

                                                      83K

                                              70K

                                      57K

                             40K
                     34K
             28K
     25K

    Q1'16   Q2'16   Q3'16    Q4'16   Q1'17   Q2'17   Q3'17   Q4'17                Q1'18

 Deploying digital technology to drive business growth and enhance the customer
experience; online service appointment volume has grown over 275% since Q1‘16
                                                              © Asbury Automotive Group 2018. All rights reserved.
Advertising Spend

                                    Advertising
                                       PVR

         $204
                            $188
                                                  $175                 $175

                                     Internet
                                      Leads

                                                                       159K
                                                  139K

                            105K
         95K

         Q1'15              Q1'16                 Q1'17               Q1'18

Digital now represents 75% of our advertising spend; Internet leads are growing,
   while per vehicle advertising spend is being managed below historic levels
                                                               © Asbury Automotive Group 2018. All rights reserved.
Online Sales Transaction

  Building our omni-channel capabilities to improve the customer’s experience

                                                              © Asbury Automotive Group 2018. All rights reserved.
Why Asbury: Investment Thesis
  Attractive brand mix and geographic footprint
  Operational excellence:
  ‒ Best in class gross margins and operating margins
  ‒ Best in class return on equity
  ‒ Strong growth track record
  Disciplined transparent capital allocation strategy
  ‒ Invest where we can generate attractive ROI
    (operating assets & capabilities, value added acquisitions, return of capital
    to shareholders)
  Strong balance sheet
  ‒ More than $375 million liquidity

                      Focused on driving shareholder value

                                                                 © Asbury Automotive Group 2018. All rights reserved.
Appendix

           © Asbury Automotive Group 2018. All rights reserved.
Q1 2018 Summary
     Same store:
           Total revenue increased 2%; gross profit increased 1%
           New vehicle revenue increased 1%; gross profit decreased 6%
           Used vehicle retail revenue increased 4%; gross profit decreased 5%
           Finance and insurance revenue and gross profit increased 2%
           Parts and service customer pay gross profit increased 5%

     Total Company:
           SG&A as a percentage of gross profit decreased 20 basis points to 69.4%
           Income from operations as a percentage of revenue was 4.5%
           Adjusted EPS from operations increased 22%

     Strategic Highlights
           Purchased a Honda dealership in the Indiana market, which should generate approximately $120
            million in annual revenue
           Repurchased $20 million of common stock
           On track to close two acquisitions in the Atlanta market by the end of the second quarter 2018,
            which combined should generate approximately $120 million in annual revenue

In a softening auto retail environment, we increased our same store gross profit by 1%,
         delivered industry leading operating margins and continued to invest in
                        developing our omni-channel capabilities
 Note: All growth rates compared to the prior year quarter unless otherwise stated
                                                                                      © Asbury Automotive Group 2018. All rights reserved.
Q1 2018 Earnings Highlights & Key Metrics
                                                                                        Q1 '18                     Q1 '17                   Change
                                 Volume Metrics (SS)
                                   US Auto Sales (M)                                            4.11                       4.03                2.0%
                                   New Units                                               22,965                     23,390                  (1.8%)
                                   Used Retail Units                                       20,000                     19,770                    1.2%
                                   Used to New Ratio                                          87.1%                     84.5%                260 bps
                                   Fixed Gross Profit ($M)                                 $122.9                     $119.5                    2.8%
                                 Margin Metrics (SS)
                                   New Margin                                                   4.5%                       4.9%              (40 bps)
                                   Used Retail Margin                                           7.3%                       8.0%              (70 bps)
                                   Fixed Margin                                               62.6%                     62.5%                 10 bps
                                   F&I PVR                                                 $1,559                     $1,515                    $44
                                                                (1)
                                   Front End PVR                                           $3,163                     $3,207                   ($44)
                                 Performance Metrics
                                   SG&A %GP                                                   69.4%                     69.6%                (20 bps)
                                                          (2)
                                   EBITDA ($M)                                                $74.8                     $74.9                 (0.1%)
                                   EPS                                                        $1.93                     $1.61                 19.9%
                                                                      (2)
                                   Adj. EBITDA ($M)                                           $74.8                     $74.0                   1.1%
                                                   (2)
                                   Adj. EPS                                                   $1.93                     $1.58                 22.2%
(1)   Front end PVR is new vehicle gross profit, used retail gross profit, and F&I gross profit divided by new and used retail unit sales
(2)   See Non-GAAP reconciliations

                                                                                                                                                 © Asbury Automotive Group 2018. All rights reserved.
Non-GAAP Reconciliations
($ in millions, except per share amounts)

                                                                        Operating Income                Q1 '18               Q1 '17
         Adjusted EBITDA                    Q1 '18   Q1 '17
                                                                Income from operations                     $73.2                $72.3
Net Income                                   $40.1    $34.0
                                                                 Legal settlements                            -                    (0.9)
Add:
 Depreciation and amortization                 8.2      7.9     Adjusted income from operations            $73.2                $71.4
 Income tax expense                           13.3     19.1
 Swap and other interest expense              13.2     13.9
                                                                      Adjusted diluted EPS              Q1 '18               Q1 '17
EBITDA                                       $74.8    $74.9
                                                                Diluted EPS                                $1.93                $1.61
 Legal settlements                             -        (0.9)
                                                                 Total non-core items                         -                  (0.03)
Adjusted EBITDA                              $74.8    $74.0
                                                                Adjusted diluted EPS                       $1.93                $1.58

                                                                                              © Asbury Automotive Group 2018. All rights reserved.
Debt Maturity Schedule
($ in Millions)

               Revolving Credit Facility

               Used Line Availability

               Subordinated Notes

               Mortgages

                                                                                                                                                $600

                                                                            $250

                                                                            $150
                                                      $17                                                                                                                 $87
                                                                                                                           $63                   $52
                               $29                                                                  $24
        2018                   2019                   2020                  2021                   2022                   2023                  2024                      2025

          Our near-term debt maturities remain minimal, with a large “stack” in 2024
Note: Amounts shown are the face value of debt instruments in millions
Does not include $3.2 million capital leases that expire in 2021 and Net of Deferred Financing Fees & Add-on Bond Premium of ($3.7) million   © Asbury Automotive Group 2018. All rights reserved.
You can also read