Recruitment & Office of Undergraduate Admissions Office of Undergraduate Admissions 2023 Admissions Cycle
←
→
Page content transcription
If your browser does not render page correctly, please read the page content below

Recruitment &
Admissions       Plan Admissions
 Office of Undergraduate
Office of Undergraduate Admissions
2023 Admissions Cycle
Executive Summary ................................................................................................................................... 2
Illinois Resident Recruitment & Admissions ........................................................................................ 8
Non-Resident Recruitment & Admissions .......................................................................................... 15
International Recruitment & Admissions ............................................................................................ 21
Diversity Recruitment & Admissions ................................................................................................... 29
Transfer Recruitment & Admissions .................................................................................................... 40

                                                                                                                                                     1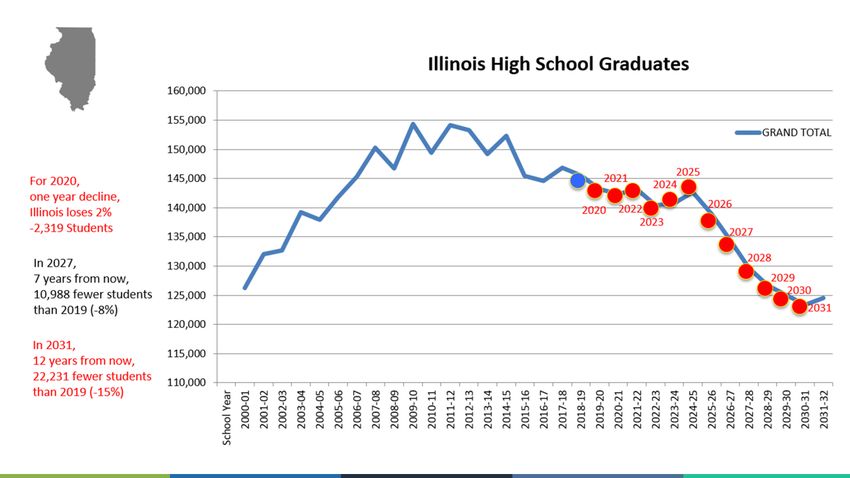
Executive Summary

                    2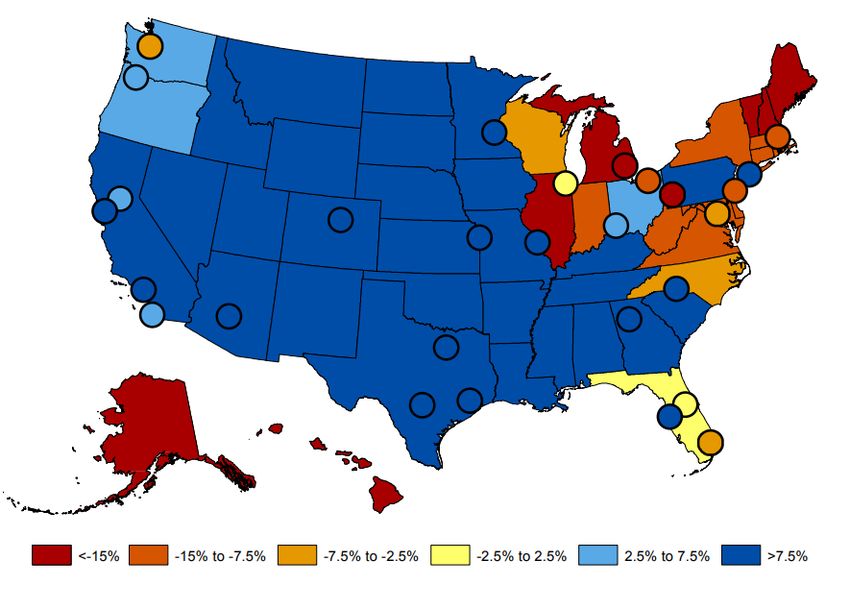
Dear Colleagues,

The Office of Undergraduate Admissions is excited to begin a new recruitment and admissions
cycle. We will continue to focus on enrolling bright and diverse freshman and transfer
populations. Our primary goal is to maintain the excellence and size of the incoming class of
new freshmen and transfers while continuing to diversify the undergraduate population.

The following pages share our objectives, strategies, and tactics to accomplish these tasks,
including specific discussion of the following topics:

       •     Illinois Resident Recruitment & Admissions
       •     Non-Resident Recruitment & Admissions
       •     International Recruitment & Admissions
       •     Diversity Recruitment & Admissions
       •     Transfer Recruitment & Admissions

The market for recruiting and enrolling talented students is changing. We face greater
competition for a declining population in our primary market: the students in the state of
Illinois. We have opportunities to diversify enrollment in secondary markets within the U.S.
and among international markets without taking away opportunities or resources from our
primary market. Sustained growth in campus diversity will be a function of the amount of
financial aid and scholarship opportunities available to students. With the changing economic
realities within the state of Illinois, we will need to create new pathways for students in order to
ensure equitable access for all students. Our ability to compete for new students will be
dependent on our depth of understanding of our institutional identity and the breadth of
cooperation to communicate a consistent message.

What makes Illinois distinct among our peer universities is that we boast one of the most
diverse public schools in the Big Ten (place), we have the best return on investment in the Big
Ten (price), and we offer globally top-ranked academic programs that specialize in
incorporating opportunities for undergraduate research and innovation (program). These
compelling factors of place, price, and program align with how students make their college
choice. We intend to collaborate with campus partners in order to highlight these market
advantages to prospective students and families.

I look forward to working in partnership with you during the 2022-2023 recruitment cycle!

Sincerely,

Andy Borst, Ph.D.
Director of Undergraduate Admissions

                                                                                                   3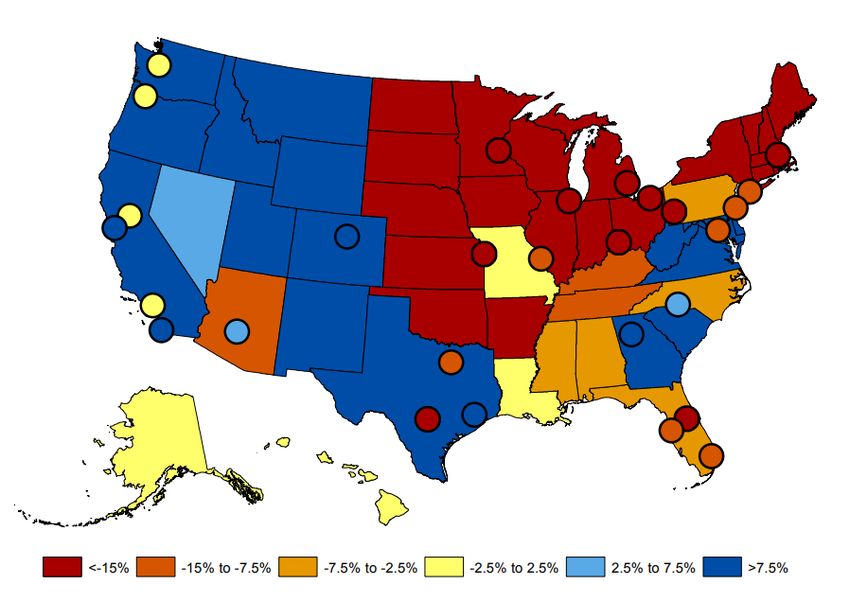
Enrollment Context
The University of Illinois at Urbana-Champaign has a long and proud history of serving the
state, nation, and world by providing a world-class education to a sizable student body.
Urbana’s enrollment already situates us among the largest campuses in the country. Data from
the Integrated Post-Secondary Education Data System (IPEDS) shows that Urbana’s 2021
enrollment placed it as the 10th largest university in the country. Urbana also had the 8th
largest freshman class and awarded the 15th most degrees in the country that year. These
metrics reveal we are already among the nation’s leaders in providing a world-class education
at considerable scale.

While we have long been among the nation’s largest universities, our commitment to access has
grown significantly in recent years. Between 2011 and 2021, campus undergraduate enrollments
grew by 8% (from 31,932 to 34,559), and graduate and professional enrollments grew by 103%
(from 10,674 to 21,698). While much of this growth was organic, planned growth occurred in
beginning in 2016 with the intentional strategy to increase high-demand graduate programs.

                                     UIUC Enrollment by Level
            60000
            50000
            40000
            30000
            20000
            10000
                 0
                      Fall    Fall    Fall    Fall    Fall    Fall    Fall    Fall    Fall    Fall    Fall
                     2011    2012    2013    2014    2015    2016    2017    2018    2019    2020    2021
         Undergrad 31932 31901 32294 32579 32878 33467 33624 33673 33850 33492 34559
         Grad & Pro 10674 10982 11104 11024 11209 11413 14202 15666 17346 18839 21698
         Total       42606 42883 43398 43603 44087 44880 47826 49339 51196 52331 56257

                                     Undergrad        Grad & Pro         Total

Enrollment Goal
The overall goal is to maintain the excellence and size of the undergraduate population. As a
land-grant university and part of Illinois’ flagship system, our first priority is to enroll resident
students and then supplement enrollment with high-achieving non-residents and international
students.

Excellence is pursued by enrolling students with high potential for achievement, enrolling a
diverse group of students, and providing a high-quality educational experience. This points to
the importance of students’ academic qualifications, talent, and motivation; the mix of
race/ethnicity, gender, family income, and residency among students; the educational resources
available to students; and the match between each program’s enrollment and its capacity.

Size affects tuition revenue and costs in ways that are readily quantified. While revenue from
tuition is important (increasingly so in recent years), revenue per se should not be the goal of

                                                                                                             4
enrollment growth. Indeed, at a comprehensive university, not every educational program must
have revenues that cover its costs. However, we must manage our enrollments and our
portfolio of educational programs so the campus as a whole has sufficient revenue to sustain its
operations, with some flexibility to explore new opportunities for teaching, research, and
service. Moreover, in the current fiscal climate, any enrollment growth or new educational
program should at least be revenue neutral and preferably generate revenues that exceed its
costs.
Size also affects excellence in ways both real and perceived. Conventional wisdom holds that
students learn better in smaller class sections than in larger ones, and that larger institutions
cannot be as discriminating as smaller institutions when admitting students. Broadly speaking,
excellence is negatively correlated with size. For instance, all but two of the universities ranked
higher than Urbana in U.S. News & World Report have smaller enrollments than Urbana (the
University of Texas at Austin and the University of Wisconsin – Madison). Thus, increasing
enrollment without taking steps to maintain students’ academic qualifications and student
diversity or a quality educational experience can reduce an institution’s impact.
An institution’s excellence also has long-term impacts on its reputation. Reputation is enhanced
by the factors that drive excellence (i.e., program quality, entering student quality, and
diversity), and a solid reputation makes it easier and less expensive to attract a strong and
diverse group of students and a strong faculty, which further improves reputation in a virtuous
cycle. The opposite cycle—a decreasing reputation that makes it harder to recruit good students
and faculty, thus decreasing reputation still further—is one to be avoided at all costs. One way
to preserve our excellent institutional reputation is to ensure that any growth in enrollment is
consistent with the strategic goals of our campus, and that growth is planned and coordinated
so as to enhance our overall institutional impact.
Admissions Philosophy
As a land-grant university and Illinois’ flagship public university, the University of Illinois
Urbana-Champaign has a responsibility to serve the citizens of the state of Illinois, from the
power corridors of the Chicago Loop to the cornfields of Southern Illinois. The goal of the
admissions review is to execute the will of the faculty and university administration by
implementing a fair and equitable process to review a large pool of applicants and select those
individuals who have challenged themselves academically and show commitment to activities
and service expected of UIUC alumni.
UIUC seeks to enroll a diverse student body in order to create an inclusive and pluralistic
learning environment that respects the varied perspectives and lived experiences of a diverse
community. The concept of a diverse student body should be understood to include diversity in
many dimensions, including socioeconomic status, veteran status, city/county/state/country of
origin, family background, gender, race and ethnicity, and the intersection of these factors.
Students learn and achieve more in diverse environments. As we strive to provide the best
possible educational environment, our students have a compelling educational need to
participate in a diverse learning environment. Factors we consider for admission include
consistent achievement at the highest curriculum level available to the student; competitive
scores and subscores on standardized tests in relation to the context available to the student;
interest in the major/program and reason for selecting the academic interest area; achievements
outside of the classroom that suggest strengths and skills that will enhance the campus
5community; and unique circumstances that may demonstrate qualities or skills that help a
student to succeed.
In response to COVID-19's impact on high school students' ability to take ACT and SAT exams,
the Board of Trustees approved a test-optional admission process for first-year students
applying for the Fall 2021, Fall 2022, and Fall 2023 semesters. At the time of application,
students decide if they want their ACT or SAT to be considered as part of their application file.
Applicants who choose to withhold test scores are not disadvantaged in consideration for
admission in any way.
Our undergraduate admissions review process uses a whole-context holistic review, which
considers the opportunities in the student’s high school, family background, ongoing hardships,
extenuating circumstances, and other contextual factors. It is important to understand the
achievements of a student within the setting of various external influences, such as school
resources, habitus, and family context that contribute to or hinder a student’s accomplishments.
Academic performance, test scores, and other traditional measures of academic merit can vary
greatly depending on the socioeconomic status of a student’s parents and differences in K-12
contexts. Not everyone has access to a robust college-preparation curriculum, including
students in rural high schools, historically underrepresented students, and students from lower
socioeconomic backgrounds with less access to Advanced Placement courses.
Assessing high school performance through measures like class rank helps assess student
performance within the context of the high school; however, fewer than 40% of Illinois high
schools track and report class rank on transcripts. Well-documented variance exists in
standardized test scores across race/ethnicity, gender, and socioeconomic groups that account
for most of the gaps in intergenerational economic mobility. Students who attend high schools
with relatively higher expenditures per student have better access to college counselors, private
tutors, and test-preparation services. Such differences in wealth, access to college counseling,
access to advanced courses, standardized test preparation, and other factors can reinforce class
stratification and limit future economic mobility. Our admissions review process focuses on
how an individual student maximizes the educational offerings available to them and how that
student has demonstrated academic achievement within their unique context.
Given that we admit by college, we also consider applicants in relation to the other students
who have applied to that college, not all applicants to the university. Each college identifies and
places unique emphasis on subjective factors that fit within the university’s strategic enrollment
goals as well as the goals of the college. The college-specific review criteria may change each
admissions review cycle. In an effort to demonstrate transparency, these factors can be found
alongside each of our majors. Although it is difficult to define all of the factors that are excluded
from the admissions review process, in order to promote fairness, we do not consider
legacy/donor status, financial need, demonstrated interest, social media presence, counselor/
teacher recommendations, or third-party advocate statements.
This plan lays out the strategies used in order to meet enrollment targets; the following goals
identify the objectives we strive to achieve:
62022-2023 Undergraduate Admissions Goals
• In following the university’s strategic framework, we “set and pursue aggressive goals
in enrollment … to ensure our universities are fully representative of the diverse
composition of a contemporary society.”
• Visit every high school in Illinois on a regular basis.
• Identify and work to remove barriers to application, admission, and enrollment for
historically marginalized students.
• Identify opportunities to engage student staff in the recruitment and admissions process,
including outreach, campus visits, email communications, and other ways we engage
with prospective students.
• Identify opportunities to simplify and automate recruitment and admissions operations.
• Explore best practices for staffing levels, work modality, and managing volume.
• Layout an annual calendar for outreach, recruitment, and admissions.
• Facilitate campus level discussions about how new academic program development
may create competition between colleges, and impact enrollment planning.
• Define the role of transfer completion programs and the structure needed as programs
expand with the intended population of non-traditional and online students.
• Continue to implement and evaluate the impact of the University of Illinois System
Transfer Guarantee.
• Improve the recruitment of diverse students by expanding application completion
workshop opportunities on the South and West side of Chicago.
• Explore using machine learning to map transcripts (Self-reported academic records
process).
• Expand video instructions of our application process.
• Improve the timeliness and consistency of responding to student inquiries – including
the implementation of a Chatbot and expanded student staff.
7Illinois Resident Recruitment
& Admissions
8Enrollment Goals
The primary focus of the university is to educate the residents of the state of Illinois. From 2006
to 2021, the percent of Illinois residents in the freshman class decreased from 89% to 70.3%
(6,385 to 5,836; -13.8%). During the same time, the total number of Illinois high school graduates
remained relatively unchanged in size (145,325 to 149,320). The decline in Illinois residents has
not been because of a lack of recruitment effort or offers of admission. In fact, the number of
admissions offers to Illinois residents increased from 11,007 in 2006 to 14,591 in 2021 (+3,584;
+32.6%).
The most significant factor in the decline in Illinois residents has been increased cost. Direct
costs (i.e., tuition, fees, and room and board) have increased from $17,598 in 2006 to $29,638 in
2021 ($12,040; 68%). It is notable that this increase is only for the base tuition rate, yet 62% of
undergraduates in 2021 paid an additional tuition differential. Undergraduate institutional aid
has also increased from $10 million in 2006 to $112 million in 2021. This shift from a low-cost,
low-aid model to a high-cost, high-aid model will continue to have a direct impact on the
recruitment of Illinois residents. The ability to continue to recruit and enroll talented Illinois
residents will be a function of the amount of institutional aid and donor-directed scholarships
available to Illinois residents.
2017 2018 2019 2020 2021 2022 est.
Applicants 18,841 19,661 21,808 20,460 21,773 25,945
Admit % 71.6% 71.0% 64.4% 69.6% 67.2% 56.2%
Admits 13,494 13,961 14,056 14,239 14,631 14,591
Yield 40.7% 41.9% 40.5% 39.6% 39.8% 38.6%
Enrollees 5,507 5,844 5,698 5,649 5,835 5,634
Figure 2.1 Illinois Resident Admissions Numbers, 2017-2022
Overview
• Our primary focus of recruitment is Illinois residents. We receive more applications and
admit more Illinois residents than ever before. Our biggest factor in enrolling more
Illinois residents is the impact of cost.
• The number of Illinois high school graduates are projected to decline 12% (-18,440) over
the next 10 years. High school demographics continue to become more diverse, with
increases in Hispanic and Asian American students and decreases in White and African
American students.
• Competition for Illinois students continues to increase. The number of regionally based
recruitment staff representing various colleges and universities increased from 46 staff
representing 33 universities in 2004 to 131 staff representing 92 universities in 2020.
• Out-of-state flagships and other large research universities offering large merit-based
scholarships have become our biggest competitors. The largest market penetration of
competitors has been among White students with SATs of 1350 to 1450 in the Chicago
suburbs. Resident students cite limited scholarship opportunities as the primary reason
for not enrolling at Illinois.
• Despite a declining state population and increased competition, Illinois has improved
both its application rate and market share in the university’s primary market of Chicago
and the surrounding suburbs. With the Chicago Satellite Office and additional regional
counselors, Illinois has a larger recruitment staff committed to our primary market than
any other institution or city in the country.
9Situational Analysis
As the landscape of high school graduates in Illinois begins to change, we continue to
implement effective techniques to build the Illinois brand. Projections from sources such as the
Western Interstate Commission for Higher Education (WICHE) show a significant decrease in
high school graduates in the coming years (Figure 2.2).
Figure 2.2 Projections of Illinois High School Graduates, 2000-2032
Source: Western Interstate Commission for Higher Education, http://knocking.wiche.edu/report, December 2016
In addition to a declining state population of high school graduates, the number of regionally
based recruitment staff representing various colleges and universities has increased from 46
staff representing 33 universities in 2004 to 131 staff representing 92 universities in 2020. The
National Student Clearinghouse provides data of where students who were admitted to Illinois
choose to enroll. Comparing Fall 2015 to Fall 2021 allows us to understand competitors who
have increased market share of residents who were admitted to Illinois (Figure 2.3).
University Fall 2015 Fall 2021 Increase (#)
Purdue University – West Lafayette 220 432 212
University of Wisconsin – Madison 349 477 128
University of Michigan 254 311 70
Indiana University – Bloomington 304 354 50
Iowa State University 130 154 24
Figure 2.3 Resident admits who enroll elsewhere, Fall 2015 vs. Fall 2021
Source: National Student Clearinghouse
Despite a declining population and increased competition, Illinois has improved its application
rate and market share in the university’s primary market of Chicago and the surrounding
suburbs.
10Current Initiatives
Illinois Commitment
Illinois Commitment began in 2019 and is a financial aid program that guarantees to cover
tuition and fees for Illinois residents whose family income is $67,100 or less who have assets of
$50,000 or less. This program impacts approximately 30% of new first-year and transfer
students. Illinois will continue to remain need-blind in making admission decisions.
AIM High Scholarships
Beginning with the Fall 2019 semester, the state legislature has allocated funds to be distributed
as merit scholarships to residents who attend Illinois public universities. The intent of the
program is to stem the flow of Illinois students attending college out of state. We estimate that
approximately $7 million will be allocated to our university.
High School Visits & College Fairs
We attend high school visits and college fairs that allow us to speak to prospective students
directly (Figure 2.10). We do not visit schools that only allow lunchroom visits. Approximately
80% of our overall recruitment travel is focused on in-state recruitment.
11Figure 2.10 Illinois High School Visits and College Fairs territory assignments
12Exploring New Initiatives – Campus Partner Discussion
• Addressing downstate and rural counties (may focus too much on Chicagoland)
• Outreach for specific counties, high schools and middle schools
• Engaging extension offices with recruiting
• Low application rates by location
o In those areas, what majors are popular?
• Opportunities to focus on innovation
o Identifying faculty who have outreach efforts as part of their work?
• Engaging local industry in areas with low application rates
• Consistency of recruitment messages for all campus partners
• Motivate and incentivize the campus to engage with recruitment
• Encouraging a welcoming environment for campus (campaign to the campus
community)
• Connecting the needs of the state with our outreach efforts
• For students who are going out-of-state, what programs are they selecting
• Are there demographic differences of the students who are out-migrating
o Are there differences within these differences?
• Coordinating summer program prospect collection
• Providing incentives (service credit or grants) for RSOs, faculty, staff, to develop
sustained engagement
• What are alternative ways to get more students on campus for reasons other than
admissions
• Facilitated points of contact in areas throughout the state, where we go to see students,
rather than expecting students to come to us
o Finding opportunities for re-engagement after the first point of contact
• Engaging the community colleges to host recruiting events
• Having more collaborative events across colleges
• Addressing the value of post-secondary education (losing students directly to the
workforce)
• Recruitment of Native and Indigenous Students – what are our recruitment messages
and efforts
13IL County Applications Jersey 12
Cook 13408 Stephenson 12
DuPage 3092 Cass 11
Lake 2343 Lee 11
Will 1772 Edgar 10
Kane 953 Hancock 10
McHenry 531 Perry 10
Champaign 476 Bond 9
McLean 292 Carroll 9
Kendall 285 Crawford 9
Sangamon 218 Dewitt 9
Peoria 211 Marion 9
Saint Clair 197 Pike 9
Madison 184 Warren 9
Winnebago 181 Jefferson 8
Tazewell 124 Lawrence 8
Kankakee 100 Mercer 8
Dekalb 92 Fayette 7
Macon 92 Jasper 7
La Salle 77 Putnam 7
Rock Island 72 Johnson 6
Boone 57 Randolph 6
Grundy 45 Union 6
Jackson 42 Clay 5
Henry 41 Cumberland 5
Vermilion 40 Henderson 5
Williamson 39 Marshall 5
Woodford 37 Washington 5
Adams 34 Wayne 5
Monroe 34 Clark 4
Whiteside 34 Greene 4
Bureau 30 Menard 4
Coles 30 Saline 4
Macoupin 29 Wabash 4
Effingham 28 Mason 3
Iroquois 27 Massac 3
Knox 26 Scott 3
Clinton 24 Shelby 3
Piatt 23 White 3
Livingston 22 Brown 2
Ogle 22 Edwards 2
Fulton 20 Richland 2
Jo Daviess 20 Stark 2
McDonough 20 Calhoun 1
Douglas 19 Gallatin 1
Ford 19 Hamilton 1
Morgan 18 Pulaski 1
Christian 17 Schuyler 1
Montgomery 16 Alexander 0
Logan 15 Hardin 0
Moultrie 13 Pope 0
Franklin 12
14Non-Resident Recruitment
& Admissions
15Enrollment Goals
The intent of non-resident enrollment is to enhance the overall educational quality of the
undergraduate population by recruiting and enrolling some of the most academically talented
students throughout the U.S. With a declining in-state population that is experiencing greater
competition as well as a potentially volatile international enrollment, it is prudent to recruit
non-residents to help supplement the size and quality of the incoming freshman class.
Applications from non-residents have increased over the last several years (Figure 3.1).
However, approximately 66% of these applications are for academic programs with limited
capacity. Our goal is to grow non-resident applicants across all academic colleges in order to
counteract potential enrollment losses from Illinois residents and international students.
2017 2018 2019 2020 2021 2022 est.
Applicants 9,668 10,019 10,834 11,768 14,010 21,216
Admit % 60.6% 58.3% 58.9% 60.4% 56.4% 36.5%
Admits 5,856 5,845 6,379 7,112 7,913 7,749
Yield 15.3% 14.3% 16.2% 13.9% 17.4% 12.7%
Enrollees 931 857 1,036 989 1,377 984
Figure 3.1 Non-Resident Admissions Numbers, 2017-2022
Overview
• In contrast to the shrinking Midwest, states in the south and west are expected to
experience growth in population over the next four years. Growth is especially notable
in states with already large population bases, including California (5.2%), Texas (5.1%),
Florida (5.6%), and Georgia (3.6%). In addition, these states send a large number of
students out of state for college.
• Students in growing areas of the United States have different levels of demand based on
perceived academic quality. The Higher Education Demand Index suggests that
students will have higher demand for institutions in the Top 50 of U.S. News & World
Report rankings than if a university falls within the 51 to 100 ranking. The University of
Illinois is currently ranked #46 among national universities and #13 among top public
schools.
• Competitors in the Midwest are outperforming Illinois in non-resident enrollment. The
primary recruiting strategy implemented by these competitors include the use of
regionally based recruitment staff.
• In the last few years, we have increased the number of regionally based staff from one
staff member in the Northeast to four staff members in the Pacific Northwest, Southern
California, Texas, and New Jersey/New York. Regionally based staff are focused on
increasing the diversity of non-resident applications into programs across the university.
• There are very limited financial aid funds available for non-residents.
16Situational Analysis
As within Illinois, graduating high school classes across the country are changing. Using data
from the Higher Education Demand Index (HEDI), we can identify trends in projected future
growth by market position. From 2012-2029, the forecasted growth in students who will attend
“elite” four-year intuitions (i.e., top 50 U.S. News schools) is expected to continue to be strong in
most of the United States (Figure 3.2).
Figure 3.2 Forecasted growth in students who will attend elite national four-year institutions, 2012-2029
Source: https://people.carleton.edu/~ngrawe/HEDI.htm
By comparison, the forecasted growth in students who will attend national four-year intuitions
is expected to be localized in South and West portions of the United States (Figure 3.2).
Figure 3.3 Forecasted growth in students who will attend national four-year institutions, 2012-2029
Source: https://people.carleton.edu/~ngrawe/HEDI.htm
17These analytics, along with internal data trends, will aid us in strategic implementation of time
and resources in the form of marketing, recruitment, and yield efforts in key markets across the
country. Knowing our successful peer institutions in these geomarkets, we are able to design a
series of focused plans to produce the most effective interactions with students. We can identify
our primary competitors for non-resident domestic students using data from the National
Student Clearinghouse (Figure 3.4). Given the diverse set of primary competitors, it is possible
that location, program prestige, and institutional prestige will have varying weights in students’
enrollment decisions.
University Admitted
Purdue University – West Lafayette 957
University of California – Berkeley 541
University of Michigan 473
University of Wisconsin – Madison 384
Georgia Institute of Technology 333
University of Texas – Austin 333
University of California – San Diego 329
University of Maryland – College Park 313
University of Washington – Seattle 268
Indiana University – Bloomington 244
Figure 3.4 Primary Competitors for Non-Residents,
Source: National Student Clearinghouse, 2021
Figure 3.5 identifies states whose students are choosing to study in the Midwest and the
competing institutions at which they are choosing to enroll. Several of our primary competitors
are enrolling significantly more students from these out-migration states.
Fall 2020 Exports Illinois Michigan Purdue Wisconsin Ohio State Indiana Minnesota Northwestern Michigan State Missouri
California 35736 324 378 489 312 126 241 50 159 114 43
New Jersey 30243 86 285 203 150 258 295 12 68 80 6
New York 28459 38 510 138 207 339 182 14 140 70 5
Texas 25299 45 97 168 45 66 145 30 73 61 83
Massachusetts 18106 28 145 111 88 53 68 14 48 28 4
Pennsylvania 16367 21 123 137 27 220 77 10 35 61 4
Florida 15089 20 110 73 51 50 90 7 73 47 17
Maryland 14723 21 109 61 55 103 51 12 46 22 6
Georgia 13031 17 68 67 28 45 35 13 28 23 13
Minnesota 12841 10 29 75 702 22 50 NA 47 20 51
Connecticut 12778 9 105 78 60 51 67 3 32 31 3
Virginia 11550 42 100 102 36 62 39 9 34 33 9
Ohio 10902 19 156 179 18 NA 158 13 46 110 10
Figure 3.5 Out-Migration States and Where Their Students Go, 2020
Source: Higher Ed Data Stories, https://www.highereddatastories.com/2022/06/abortion-policy-and-freshman-
migration.html
With the potential to take market share of states with a large amount of out-migration away
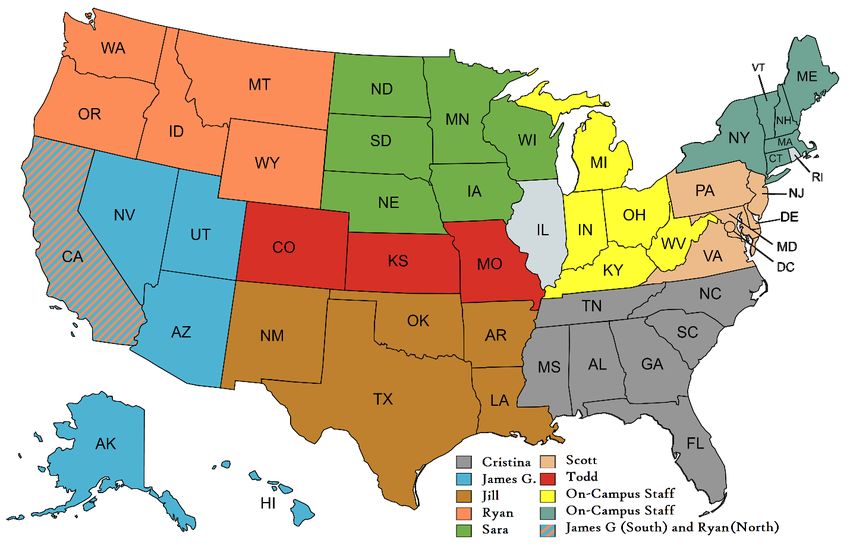
from primary competitors, our office has recently placed staff in key geomarkets. Figure 3.6
identifies our non-resident recruitment efforts.
18Figure 3.6 Non-Resident Recruitment Territories
Current Initiatives
College Fairs
We attend over 100 college fairs outside of Illinois. These fairs vary in length from one-and-a-
half to three hours and in attendance from a few dozen to over 1,000 students. Most fairs are
held from mid-September to mid-November, with additional fairs in March and April. We
distribute our Exploration Book at each of these fairs.
Alumni Volunteer Program
Our alumni attended college fairs each fall and admitted student receptions each spring to help
yield the freshman class. We look forward to increasing alumni involvement at college fairs this
fall.
Admitted Student Receptions
Admitted Student Receptions are held in our primary out-of-state markets. Locations are
determined in February based on application and admitted numbers. Depending on the
location, admissions staff host a lunch or dinner at an area restaurant with an alumni panel.
19Exploring New Non-Resident Initiatives – Campus Partner Discussion
• What are the decision factors for students, how are they different compared to residents?
o Cost, location, safety
• Rankings – do students know about ALL of our “top” ranked programs
• Exploring discounting/in-state tuition for non-residents
• Diversity of their communities compared to our community – are they looking at our
numbers
• What other markets are out there for us to explore (PA?), who are sending larger groups of
students to other Big Tens
• Messaging to these students – we are getting applications; how can we improve yield
rates?
• Northwest Indiana focus for diverse families
• Non-resident applicants who apply with a fee waiver
• Encouraging non-residents to diversify where they apply
20International Recruitment
& Admissions
21Enrollment Goals
As an institutional brand, Illinois has enjoyed a strong global presence for many years. This
benefits not only our domestic students in their opportunities for global experiences, but also
our campus and applicant pool through their unique diversity.
While the university has worked hard to establish and fortify relationships with China as our
largest feeder country, our primary goal is to diversify the countries represented in our overall
student population while maintaining both size and quality.
2017 2018 2019 2020 2021 2022 est.
Applicants 10,451 9,765 10,876 11,245 11,811 16,097
Admit % 44.2% 48.0% 48.3% 54.8% 49.6% 37.4%
Admits 4,624 4,690 5,249 6,163 5,854 6,017
Yield 24.4% 19.9% 18.3% 14.8% 19.4% 22.2%
Enrollees 1,127 934 961 914 1,137 1,337
Figure 4.1 International Admissions Numbers, 2017-2022
Overview
• Illinois hosts the 5th largest undergraduate population of international students in the
nation and the largest in the Midwest.
• Since 2009, applications from international students have more than doubled, with the
biggest increase coming from China; however, applications have stagnated since 2013,
until joining the CommonApp in 2022.
• The countries international students represent at Illinois are consistent with national
trends, with the exception of Saudi Arabia, whose students do not tend to enroll at Big
Ten universities.
• The primary feeder countries for international enrollment at Illinois are China (54%),
India (22%), and South Korea (10.0%). All other countries represent 14% of the total,
with the next largest being Taiwan (2%).
• After almost five years with minimal international recruitment travel, we will expand
our visits to include primary markets as well as explore secondary and tertiary
international markets.
o Primary: China, India, and South Korea
o Secondary: Turkey, Malaysia, Indonesia, Saudi Arabia, and Vietnam
o Tertiary: United Arab Emirates, Egypt, Macau, and Jordan
• Approximately one in four international students enroll at the university after
graduating from a high school in the U.S.
• Based on the number of students enrolling in U.S. colleges, our largest growth potential
is India. Recent recruitment efforts have increased the number of new freshmen who are
choosing to enroll from India.
22Situational Analysis
We are one of many selective peer institutions to which international students apply and enroll.
Our annual decline survey, National Clearinghouse Data, and Open Doors reports allow for
detailed benchmarking with our peer institutions. Though not all of them are listed in Figure
4.2, 6 of the 14 Big Ten institutions fall in the top 20 nationally when it comes to hosting
international students. This helps Illinois to further understand the global and nationwide
trends that are impacting us at all levels.
Institution City State Total
1. New York University New York NY 17,050
2. Northeastern University Boston MA 15,880
3. Columbia University New York NY 15,015
4. University of Southern California Los Angeles CA 14,992
5. Arizona State University – Tempe Tempe AZ 13,015
6. University of Illinois – Urbana-Champaign Champaign IL 12,838
7. University of California – San Diego La Jolla CA 10,824
8. Boston University Boston MA 10,646
9. Purdue University – West Lafayette West Lafayette IN 10,500
10. University of California – Los Angeles Los Angeles CA 10,273
Figure 4.2 Top U.S. Institutions Hosting International Students, 2020-2021
Source: Open Doors
Figure 4.3 provides a detailed view of the international admissions landscape by country of
origin. Although the most recent data available is from 2020-2021, it gives us an indicator of
both the volume of international students who are coming to the U.S. for college as well as
trends (increases and decreases) by country in the context of the COVID-19 pandemic.
Country of Origin 2019/20 2020/21 % of Total % Change
1. China 372,532 317,299 34.7 -14.8
2. India 193,124 167,582 18.3 -13.2
3. South Korea 49,809 39,491 4.3 -20.7
4. Canada 25,992 25,143 2.8 -3.3
5. Saudi Arabia 30,957 21,933 2.4 -29.2
6. Vietnam 23,777 21,631 2.4 -9.0
7. Taiwan 23,724 19,673 2.2 -17.1
8. Brazil 16,671 14,000 1.5 -16.0
World Total 1,0755,496 914,095 100.0 -15.0
Figure 4.3 Countries of Origin of International Students, 2020-2021
Source: Open Doors
The largest volume of international students nationwide comes from China, India, South Korea,
and Saudi Arabia, with other countries sending much smaller numbers of students to the U.S.
The largest increase in total number of students studying in the U.S. comes from India. With
just over 45% of their population under the age of 25 (CIA World Factbook) and a rapidly
growing middle class, we expect this trend to continue.
23Use of International Agents
Illinois does not partner with agents or other private organizations to represent the university
for the purpose of recruiting or enrolling students. Only appointed employees or trained alumni
are authorized to officially represent the university in recruiting and enrolling students through
direct contact with students and families. We understand that prospective students and their
families may retain the services of independent educational consultants or advisors to assist
them in applying to colleges or universities in the U.S. and abroad. These private consultants
and advisors are permitted, but they are not recognized representatives of the university.
Current Initiatives
Primary Markets
The following includes a list of countries and cities we visited, as well as the events we held
there during the 2021-2022 cycle.
China
China continues to be an important market for Illinois and will continue to have strong
interest in all areas of study. As a result of our academic bridge programs, students
remain interested and trust the Illinois brand and education. As we start to shift to
diversifying our international student population, we will focus on diversification
within China and target schools with low admission or diversity within majors to
continue to grow interest in other areas and increase application awareness. If high
schools reach out with interest in sessions and time allows, we will work to maintain
relationships. Planned programs:
• Virtual High School Visits
• Virtual College Fairs
• Global Student Mock Admissions Workshops with University of Southern
California, Michigan State University, Butler University & University of San
Francisco
• Public vs Private Institution Showcases with Tulane University, Butler
University, Rice University, Michigan State University
• International Regional Admitted Student Events
Priority Cities in China
• Shenzhen
• Shanghai
• Beijing
• Nanjing
• Suzhou
• Changhsu
24India
Students in India continue to show interest in enrolling at selective universities in the
United States. We will return to in-person travel in India for the upcoming cycle.
Individual high school visits and group workshops seems to be more productive
recruiting events than college fairs or virtual events. The India admitted student
receptions were also successful as a means for students to connect with each other.
Planned programs:
• Virtual High School Visits
• Virtual College Fairs
• Global Student Workshops with University of Southern California, Michigan
State University, Butler University & University of San Francisco
• Public vs Private Institution Showcases with Tulane University, Butler
University, Rice University, Michigan State University
• EducationUSA Essay Workshop with Michigan State University
• International Regional Admitted Student Events
Priority Cities in India
• Delhi (and surrounding cities)
• Mumbai
• Hyderabad
• Chennai
• Kolkata
• Bangalore
South Korea
Interest from South Korean students increased for Fall 2022 after several years of steady decline.
Interest also expanded across various academic programs. High school visits were well
attended and college fairs had good interactions. Planned programs:
• Virtual High School Visits
• Virtual College Fairs
• Global Student Workshops with University of Southern California, Michigan
State University, Butler University & University of San Francisco
• Public vs Private Institution Showcases with Tulane University, Butler
University, Rice University, Michigan State University
• International Regional Admitted Student Events
Priority Cities in South Korea
Cities
• Jeju
• Busan
• Seoul
25Secondary Markets
These countries have shown modest interest in applications with students who may have
competitive credentials for admission. These secondary market countries include:
Turkey
All Undergraduates Studying in the U.S.: 3,474
Applications: 84
Average ACT: 29.8
Average TOEFL: 105.1
Malaysia
All Undergraduates Studying in the U.S.: 5,817
Applications: 68
Average ACT: 30.1
Average TOEFL: 104.9
Indonesia
All Undergraduates Studying in the U.S.: 5,183
Applications: 65
Average ACT: 28.7
Average TOEFL: 103.4
Saudi Arabia
All Undergraduates Studying in the U.S.: 27,646
Applications: 52
Average ACT: 25.1
Average TOEFL: 96.6
Vietnam
All Undergraduates Studying in the U.S.: 16,933
Applications: 42
Average ACT: 28.2
Average TOEFL: 98.9
Tertiary Markets
These countries are located in close proximity to primary and secondary market counties, or we
have the opportunity to visit these markets with other universities who have established viable
pipelines in these counties. These tertiary market countries include:
United Arab Emirates
All Undergraduates Studying in the U.S.: 1,940
Applications: 16
Average ACT: 29.2
Average TOEFL: 105.9
Egypt
26All Undergraduates Studying in the U.S.: 1,511
Applications: 14
Average ACT: 27.8
Average TOEFL: 102.4
Macau
All Undergraduates Studying in the U.S.: 355
Applications: 8
Average ACT: 29.0
Average TOEFL: 104.0
Jordan
All Undergraduates Studying in the U.S.: 988
Applications: 5
Average ACT: 25.4
Average TOEFL: 93.0
Campus Partners
Admissions will also continue to work with our campus partners to recruit a diverse incoming
international student body. Over the summer, the Singapore Students Association represented
Illinois at a fair with the support of our office. We are also sharing knowledge and looking for
opportunities to collaborate with Illinois International, the University of Illinois Alumni
Association, and various other partners on campus.
Domestic International Recruitment
Admissions does specific training to prepare staff to work with the growing number of
international students at domestic high schools. According to the Institute of International
Education, almost 82,000 international students in the U.S. sought high school diplomas in 2016.
The highest concentrations of these students are in California, New York, and Texas, with
Massachusetts and Florida rounding out the top five. As a majority of these students plan to
transition to U.S. universities, our counselors know how to assist them through the admissions
process.
27Exploring New International Initiatives – Campus Partner Discussion
• Emphasis on diversifying international enrollment, without losing current markets
• Growing secondary and tertiary markets
• Growing domestic international populations (the students who are already in the US)
• Impact of the CommonApp – did that change where we are getting applicants from
• Emphasis on rankings
• Getting under enrolled programs in front of international students
• Promoting study abroad opportunities, faculty led programs
• Engaging faculty who are traveling abroad to assist with recruitment
• Engaging alumni who live abroad to assist with recruitment, partner with advancement,
emphasis on younger alumni
• International social media is significantly different, how can we engage
• Addressing campus/community safety
• Opportunities to engage current students to assist with international recruitment
• What are the unique markets by college (may be different between ACES, Media,
Engineering)
• Leveraging regional resources in how they can help us with recruitment (India & China),
are there opportunities to expand (what is the return on investment?)
• Where are international students getting internships and employment after graduation?
28Diversity Recruitment
& Admissions
29Enrollment Goals
Illinois has a proud history of enrolling academically talented students from diverse
backgrounds, and we will continue to build upon this tradition. As noted in the university’s
strategic framework (May 2016), we “set and pursue aggressive goals in enrollment … to ensure
our universities are fully representative of the diverse composition of a contemporary society.”
Illinois is committed to recruiting and enrolling a diverse class of new undergraduate students
each year. It is important to note that the U.S. Supreme Court determined in California v. Bakke
(1978) that setting explicit enrollment goals, quotas, targets, proportions or representations, or
implied admissions metrics based on race/ethnicity is unconstitutional. In following with a
more recent U.S. Supreme Court ruling of Fisher v. Texas II (June 2016), we strive to enroll a
“critical mass” of students from historically underrepresented backgrounds— “not with an
intent of enrolling a certain number of minority students, but rather with a compelling interest
in obtaining the educational benefits that flow from a diverse student body.”
Overview
• The overall population of the state of Illinois is decreasing, but it is also becoming more
diverse. Based on birthrates, over the next ten years, Illinois high school graduates who
identify as Hispanic are projected to decrease 13 percent and Black/African American
students are projected to decrease 11 percent. Additionally, African Americans are
moving away from Illinois at a greater rate than other populations.
• Students in the freshman class are representative of Illinois high school graduates from
historically underrepresented populations who are ready to begin college-level
coursework without needing remedial classes. This is a key distinction because the
university does not currently offer remedial classes.
• Illinois competes for diverse students with universities in the city of Chicago (e.g., UIC
and Northwestern) and other flagship universities in the Midwest (e.g., Michigan and
Wisconsin). Cost of attendance (including room and board) and limited scholarship
opportunities are the most important factors in student’s decisions not to enroll at
Illinois.
• Institutional need-based aid programs (e.g., Illinois Commitment, President’s Award
Program, Chancellor’s Access Grant, etc.) increased from approximately $8 million in
2005 to $112 million in 2021. These investments have recently improved market share of
diverse students and situated Illinois as one of the most successful universities in the Big
Ten for recruiting and enrolling students from historically underrepresented
backgrounds.
• It is clear that sustained growth in enrolling students from historically underrepresented
backgrounds will continue to depend on additional investment in financial aid
programs. Our financial aid strategies specifically target resident students with limited
financial resources to non-resident or international students.
30Situational Analysis
Following a similar national trend, the state of Illinois is projected to see significant growth in
the number of Hispanic students graduating from high school until 2025 (Figure 5.1). However
over the next ten years, Illinois high school graduates who identify as Hispanic are projected to
decrease 13 percent and Black/African American students are projected to decrease 11 percent.
40,000
35,000 36,850
33,710
30,000 31,470
28,130
25,000 24,859
22,320
20,000 20,520 19,540
15,000 16,440 15,490
10,000
5,000 Black Hispanic
0
10
11
12
13
14
15
16
17
18
19
20
21
22
23
24
25
26
27
28
29
30
31
32
33
34
35
20
20
20
20
20
20
20
20
20
20
20
20
20
20
20
20
20
20
20
20
20
20
20
20
20
20
Figure 5.1 Projections of Illinois High School Graduates by Race/Ethnicity, 2010-2035
Source: Western Interstate Commission for Higher Education, http://knocking.wiche.edu/report, December 2016
In order to grow enrollment of African American students, the university may expand
recruitment beyond traditional markets, diversify how enrollment is achieved (e.g., online,
transfer, satellite, etc.), adjust academic standards, or increase market share of the existing
population. As indicated in the pages that follow, more offers of admission will be unlikely to
consistently yield more African American students without additional financial aid.
The freshman class is not representative of the state of Illinois population. However, the
representation of new freshmen from historically underrepresented backgrounds most closely
matches Illinois high school graduates (excluding international students and unknown
races/ethnicities) who were determined to either be college ready or need one remedial class
before beginning coursework offered at Illinois (Figure 5.3). This is a key distinction because
Illinois does not currently offer remedial coursework.
Race/Ethnicity State Illinois High IL HS Graduates who 2021
Population School are ready to begin Freshman
Graduates college w/o remedial Residents
coursework
White 61.6% 45.9% 56.9% 46.6%
Hispanic 18.7% 26.1% 16.9% 18.4%
African American 12.4% 13.0% 5.4% 7.2%
Asian 6.0% 5.5% 6.9% 21.6%
Native American 1.1% 0.9% 0.1% 0.1%
Native Hawaiian 0.2% 0.1% 0.2% 0.1%
Multiracial 10.2% 3.3% 3.8% 4.9%
Population 12,671,821 143,207 54,842 5,789
Figure 5.3 Freshman Resident Comparison to State of Illinois, 2021
Source: U.S. Census Data, 2020; College Board Data (race/ethnicity self-reported by IPEDS definitions)
31With an emphasis on improving campus diversity, we’ve been successful in recruiting more
diverse students to apply for admissions, as well as consistently offering admission to more
Hispanic and African American students. Figure 5.4 and 5.5 shows the admissions funnel of
Hispanic and African American students’ application, admission, and new first-year enrollment
over time. Compared with 2005, we receive almost 7 times more applications from Hispanic
students and almost 2.5 times more applications from African American students. In other
words, we are doing a better job of recruiting and admitting diverse students. Our gap in
diversity enrollment continues to be in getting diverse students to enroll after being admitted
(i.e. yield).
8000
6996
6000 5413
Apps Admits Enrolled
4000
2928 3167
2000
1088 1144 1070
892
509
0
2005 2006 2007 2008 2009 2010 2011 2012 2013 2014 2015 2016 2017 2018 2019 2020 2021 2022
Figure 5.4 Application, Admission, and New Enrollment of Hispanic students
4000
3401
3000 2997
Apps Admits Enrolled
2000
1409 1216 1305
1000
900
521
499 447
0
2005 2006 2007 2008 2009 2010 2011 2012 2013 2014 2015 2016 2017 2018 2019 2020 2021 2022
Figure 5.5 Application, Admission, and New Enrollment of African American students
Diverse students who don’t accept our offer of admission are more likely than majority students
to reference cost and lack of a scholarship as the primary reasons for not enrolling. Diverse
students who do not enroll at UIUC are more likely to enroll at another Illinois public
university, an HBCU, or another college/university in the City of Chicago or elsewhere in the
Midwest. It is clear that growth in enrolling students from historically underrepresented
backgrounds will continue to depend on additional investment in financial aid programs as a
means to impact yield (that is, admitted students who choose to enroll).
32Financial Aid Programs
Our financial aid strategies specifically target resident students with limited financial resources
to non-resident or international students. Sustained growth in the enrollment of students who
identify as African American or Hispanic have been tied to significant campus investment in
new merit- and need-based financial aid programs. The President’s Award Program was
created in 1984, and the Chancellor’s Access Grant was created in 2010. Both scholarship
programs mark the start of sustained enrollment growth of historically underrepresented
students (Figure 5.6). A notable downturn can be seen between 2000 and 2010, after tuition
increases of around 10% or more each year.
1200 1,144
1100 1,102
1000
900
800
700
600 601
500
448
400
300
200
100 African American
0 Hispanic
1968
1970
1972
1974
1976
1978
1980
1982
1984
1986
1988
1990
1992
1994
1996
1998
2000
2002
2004
2006
2008
2010
2012
2014
2016
2018
2020
Figure 5.6 History of Diversity Enrollment, 1968-2021
Family income differs significantly by race/ethnicity. Figure 5.7 shows differences in family
income of our admitted students. Compared to their White and Asian American peers, African
American and Hispanic students are significantly more likely to come from families who make
less than $55,000.
70%
60%
50% Q1: $0-$31,014
39% Q2: $31,015-$55,507
40%
Q3: $35,508-$85,667
30% 23%
20% 19% Q4: $85,668-$134,682
20%
10% 8%7% Q5: $134,683 and up
10% 6%
Did not file a FAFSA
0%
Asian American African Hispanic White
American
Figure 5.7 Family Income by Race/Ethnicity, 2021
33As tuition, fees, and room and board charges have increased, the need to increase available aid
to all students has increased. In current dollars, need-based aid programs increased from
approximately $8 million in 2005 to $112 million in 2021 regardless of race/ethnicity (Figure
5.11). These additional investments highly correlate with growth in the enrollment of students
from historically underrepresented backgrounds.
$120,000 $112,101
$98,318
$100,000 $94,300
$86,015
$80,400
$80,000 $74,508
$63,463
$56,992
$60,000
$47,768
$37,587
$40,000
$30,667
$22,766
$18,211$19,687
$20,000 $14,136
$8,144$10,878
$0
2005 2006 2007 2008 2009 2010 2011 2012 2013 2014 2015 2016 2017 2018 2019 2020 2021
Figure 5.11 Campus Investment in Aid Programs, 2005-2021
These investments in institutional aid have positioned UIUC to have the lowest net price among
Illinois Public Universities for students with family incomes below $48,000 and second lowest
by $13 for family incomes between $48,000-$75,000.
$0-$30K $30K-$48K $48K-$75K $75K-$110K $110K
Chicago State $12,685 $12,183 $13,678
Eastern Illinois $11,015 $10,056 $12,675 $17,594 $20,021
Governors State $8,629 $9,435 $12,810 $14,922 $18,907
Illinois State $13,783 $14,982 $19,293 $24,998 $26,767
Northeastern IL $13,989 $13,290 $16,540 $19,808
Northern Illinois $10,395 $11,499 $13,778 $16,882 $20,068
SIU-Carbondale $11,665 $12,226 $14,499 $18,841 $21,449
SIU-Edwardsville $8,047 $8,825 $12,950 $18,226 $20,589
UI-Chicago $10,549 $11,351 $14,105 $19,839 $23,320
UI-Springfield $10,831 $8,482 $11,492 $14,985 $18,762
UIUC $4,858 $8,036 $11,505 $22,400 $27,285
Western Illinois $12,265 $12,112 $15,794 $19,476 $21,051
Figure 5.12 Illinois Public University Average Net Price by Income Level, 2019-2020
President’s Award Program & PAP Honors
The President’s Award Program is for Illinois residents from historically underrepresented
groups who have demonstrated outstanding academic achievement, while the President’s
Award Program Honors is for Illinois residents from historically underrepresented groups who
have demonstrated the highest level of achievement. Awards range from $5,000 to $10,000 and
are renewable each year.
34Illinois Promise
Initiated in 2005, Illinois Promise is an access scholarship program that provides high-achieving,
low-income Illinois residents an opportunity to attend Illinois by covering their educational
expenses, including tuition, fees, room and board, and books and supplies. Funding is provided
by both institutional and private sources, including individual and corporate donors.
Chancellor’s Access Grant
The Chancellor’s Access Grant is for Illinois residents from historically underrepresented
groups who are below the criteria for PAP and Illinois Promise but demonstrate academic
potential. Awards are $5,000 and renewable annually.
Illinois Commitment
Illinois Commitment began in 2019 and is a financial aid program that guarantees to cover
tuition and fees for Illinois residents whose family income is $67,100 or less who have assets of
$50,000 or less. This program impacts approximately 30% of new first-year and transfer
students. Illinois will continue to remain need-blind in making admission decisions.
AIM High Scholarships
Beginning with the Fall 2019 semester, the state legislature has allocated funds to be distributed
as merit scholarships to residents who attend Illinois public universities. The intent of the
program is to stem the flow of Illinois students attending college out of state. We estimate that
approximately $7 million will be allocated to our university.
Hope Chicago
Beginning with the Fall 2022, the Hope Chicago program offers external funding in order to
meet the full cost of attendance funding for students from Benito Juarez Community Academy,
Al Raby School for Community and Environment, Morgan Park High School, Noble Johnson
College Prep, and Farragut Career Academy.
35You can also read