Regulatory Constraints on Bank Leverage: Issues and Lessons from the Canadian Experience - Discussion Paper/Document d'analyse 2009-15
←
→
Page content transcription
If your browser does not render page correctly, please read the page content below
Discussion Paper/Document d’analyse
2009-15

Regulatory Constraints on Bank Leverage:
Issues and Lessons from the Canadian
Experience

by Etienne Bordeleau, Allan Crawford, and Christopher Graham
Bank of Canada Discussion Paper 2009-15

                                         December 2009

          Regulatory Constraints on Bank Leverage:
           Issues and Lessons from the Canadian
                        Experience

                                                  by

          Etienne Bordeleau,1 Allan Crawford,2 and Christopher Graham1

                                   1Financial
                                            Stability Department
                                          Bank of Canada
                                 Ottawa, Ontario, Canada K1A 0G9
                                  ebordeleau@bankofcanada.ca
                                    cgraham@bankofcanada.ca

                                                2Adviser

                                          Bank of Canada
                                 Ottawa, Ontario, Canada K1A 0G9
                                   acrawford@bankofcanada.ca

Bank of Canada discussion papers are completed research studies on a wide variety of technical subjects
       relevant to central bank policy. The views expressed in this paper are those of the authors.
                  No responsibility for them should be attributed to the Bank of Canada.

ISSN 1914-0568                                                                   © 2009 Bank of Canada
                                                   2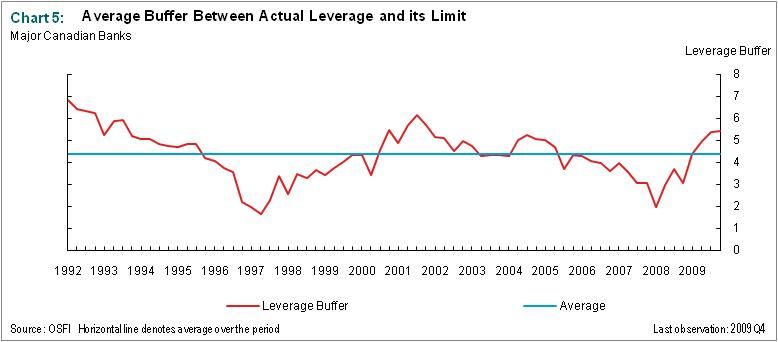
Acknowledgements

We are grateful to Céline Gauthier, Toni Gravelle, and Jonathan Witmer for their
comments, and Jason Allen and Greg Tkacz for helpful discussions. The editorial
services of Glen Keenleyside are also appreciated.

                                           ii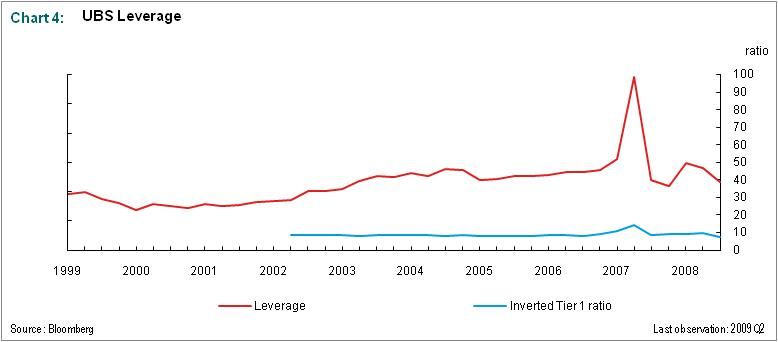
Abstract

The Basel capital framework plays an important role in risk management by linking a
bank’s minimum capital requirements to the riskiness of its assets. Nevertheless, the risk
estimates underlying these calculations may be imperfect, and it appears that a cyclical
bias in measures of risk-adjusted capital contributed to procyclical increases in global
leverage prior to the recent financial crisis. As such, international policy discussions are
considering an unweighted leverage ratio as a supplement to existing risk-weighted
capital requirements. Canadian banks offer a useful case study in this respect, having
been subject to a regulatory ceiling on an unweighted leverage ratio since the early
1980s. The authors review lessons from the Canadian experience with leverage
constraints, and provide some empirical analysis on how such constraints affect banks’
leverage management. In contrast to a number of countries without regulatory
constraints, leverage at major Canadian banks was relatively stable leading up to the
crisis, reducing pressure for deleveraging during the economic downturn. Empirical
results suggest that major Canadian banks follow different strategies for managing their
leverage. Some banks tend to raise their precautionary buffer quickly, through sharp
reductions in asset growth and faster capital growth, when a shock pushes leverage too
close to its authorized limit. For other banks, shocks have more persistent effects on
leverage, possibly because these banks tend to have higher buffers on average.
Overall, the authors’ results suggest that a leverage ceiling would be a useful tool to
complement risk-weighted measures and mitigate procyclical tendencies in the financial
system.

JEL classification: G01, G28, G21
Bank classification: Financial institutions; Financial stability; Financial system
regulation and policies

                                        Résumé

Le dispositif d’adéquation des fonds propres de Bâle joue un rôle important dans la
gestion des risques, car il lie les exigences minimales de fonds propres d’une banque au
degré de risque de ses actifs. Toutefois, les estimations des risques qui sous-tendent ces
calculs peuvent être imparfaites, et il semble qu’un biais cyclique dans les mesures des
fonds propres corrigées pour tenir compte des risques ait contribué à l’augmentation
procyclique du levier financier dans le monde avant la récente crise financière. C’est
pourquoi des discussions ont lieu à l’échelle internationale sur la possibilité d’adopter un
ratio de levier financier non pondéré pour complémenter les exigences actuelles
d’adéquation des fonds propres qui sont pondérées en fonction des risques. Les banques
canadiennes offrent un exemple utile à cet égard puisque leur ratio de levier financier non
pondéré est assujetti à un plafond réglementaire depuis le début des années 1980. Les
auteurs passent en revue certaines leçons tirées de l’expérience du Canada en matière de

                                             iii
limitation du levier financier et livrent une analyse empirique de l’incidence de telles
contraintes sur la gestion du levier financier dans les banques. Contrairement à ce qui a
été observé dans plusieurs pays qui n’imposent aucune limite réglementaire, le levier
financier des grandes banques canadiennes a été relativement stable avant la crise, ce qui
a atténué les pressions pour le réduire au cours de la récession. Les résultats empiriques
donnent à penser que les grandes banques du pays gèrent leur levier financier selon des
stratégies différentes. Certaines ont tendance à hausser leur marge de précaution
rapidement en freinant considérablement la croissance de leurs actifs et en accélérant
celle de leurs fonds propres lorsqu’un choc pousse leur levier financier trop près de la
limite autorisée. Pour d’autres banques, les chocs ont des effets plus persistants sur leur
levier financier, peut-être parce qu’elles tendent à maintenir des marges plus élevées en
moyenne. Dans l’ensemble, les résultats obtenus par les auteurs semblent indiquer qu’un
plafonnement du levier financier apporterait un complément utile aux mesures pondérées
au regard des risques et atténuerait les tendances procycliques dans le système financier.
Classification JEL : G01, G28, G21
Classification de la Banque : Institutions financières; Stabilité financière;
Réglementation et politiques relatives au système financier
iv1 Introduction
The Basel capital framework plays an important role in risk management by linking a bank’s
minimum capital requirements to the riskiness of its asset portfolio. Nevertheless, owing to
model and data limitations, the risk estimates underlying these calculations may be imperfect
measures of the actual level of risk. For example, assessments of future risk may tend to become
overly optimistic as current economic and financial conditions improve during the upswing of a
business cycle.1 Understating risk would amplify the buildup of leverage during boom periods,
since it would allow more assets to be held for a given level of regulatory capital. Conversely, if
risk assessments become overly pessimistic as conditions deteriorate during downturns, the
overstatement of risks would exacerbate deleveraging, since banks would face stronger pressure
to sell assets or constrain loan growth in order to satisfy capital requirements. As a result, risk-
adjusted capital ratios may not fully reflect risk exposures and future vulnerabilities in the
financial system. Moreover, a cyclical bias in measuring risk would tend to amplify procyclical
changes in bank leverage, and therefore contribute to the procyclical tendencies in the overall
financial system. This problem has been identified as one of the factors underlying the increase
in global leverage prior to the recent financial crisis (CGFS 2009).
Internationally, one reaction to these concerns has been to consider ways to improve the methods
used to quantify risks. Another strategy is to supplement risk-weighted capital requirements with
other measures of capital adequacy such as an unweighted leverage ratio (defined as an assets-to-
capital multiple). As part of the capital-adequacy regime, Canadian banks and other federally
regulated deposit-taking institutions have been subject to a regulatory ceiling on the unweighted
leverage ratio since the early 1980s. The leverage requirement was retained even after
implementation of the risk-adjusted measures under Basel I and Basel II. Because measures of
risk are imperfect, the Canadian regulator, the Office of the Superintendent of Financial
Institutions (OSFI), believes that the leverage ratio can function as an objective measure to
complement the risk-weighted Basel capital requirements (Dickson 2009).
Although a simple leverage ratio has its own limitations, it has the advantage of being an
independent measure that is not affected by the cyclical biases that can distort risk-adjusted
measures.2 Thus, a supplementary leverage requirement may be a useful tool for moderating
procyclical movements in leverage.3 In addition, a leverage constraint helps to prevent banks
1. Illing and Paulin (2004) and Youngman (2009) describe how cyclical biases may affect estimates of risk for the banking and
trading books, respectively. In the case of the trading book, these biases can arise from the use of risk-measurement tools
(such as value-at-risk [VaR] models) based on market price data from unrepresentative short periods.
2. As noted by Hildebrand (2008), a leverage ratio “serves as a safety valve against the weaknesses and shortcomings of risk-
weighted requirements.”
3. Blum (2008) provides a theoretical rationale for introducing an unweighted leverage constraint as a complement to risk-
weighted capital requirements. Using a model with adverse selection and ex ante information asymmetry between banks and
supervisors, he shows that banks have an incentive to understate risk in order to reduce their (costly) risk-weighted capital
requirements, and that a leverage ratio can offset this incentive and induce accurate statements of risk.
1from expanding the size of their balance sheets excessively by accumulating assets with low
Basel risk weights. Even if the risk weights are appropriate, excessive growth in total assets and
leverage could increase a bank’s reliance on potentially volatile short-term sources of market
funding and, therefore, expose it to significantly higher levels of funding liquidity risk.4
Accordingly, a leverage constraint could also mitigate the buildup of liquidity risk during the
boom phase of a cycle.
While it is viewed traditionally as a microprudential instrument to control risk at individual
institutions, a leverage requirement can also play a macroprudential role by helping to moderate
procyclical movements in aggregate leverage.5 By moderating the increase in aggregate leverage
during boom periods, a leverage constraint would reduce the risk that excessive growth in credit
and asset prices will create financial imbalances across the financial system and lead to future
financial instability. As a result, the imposition of regulatory leverage ceilings has been
identified by international committees as one of many potential policy options to mitigate
procyclicality and strengthen the resiliency of the global financial system (G-20 Working Group
1 2009). The Basel Committee for Banking Supervision is currently reviewing how a
supplementary leverage ratio could be implemented (BIS 2009). At present, few countries have
formal leverage constraints. In addition to Canada, U.S. commercial banks have been subject to
leverage requirements for several decades, and Switzerland recently introduced leverage limits
for large banks (Swiss Federal Banking Commission 2008). In this study, we review lessons
from Canada’s experience with regulatory leverage constraints over the past 25 years, and assess
how the limits may have affected the recent evolution of bank leverage and procyclical pressures
in the Canadian financial system.
2 Canadian Regulatory Limits On Leverage
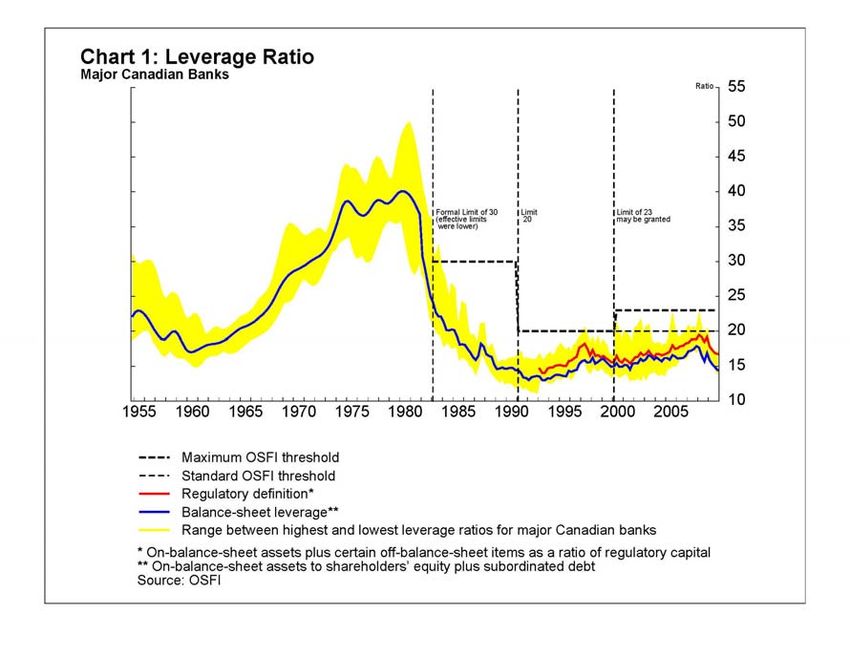
The average leverage ratio of major Canadian banks rose steadily from the early 1960s to 1980,
when it peaked at about 40 (Chart 1).6 Against this backdrop of high and rising leverage, the
statutory authority to set a maximum leverage ratio was granted in 1980. From 1982 to 1991, a
formal limit of 30 was placed on the assets-to-capital multiple for large banks. However, in
practice the effective leverage constraint was below 30 over this period, since the regulator used
its discretionary power to establish lower actual limits for individual banks. In 1991, a formal
upper limit of 20 was imposed, and this ceiling remained in effect until 2000, when it was
decided that banks meeting certain conditions could receive an authorized multiple as high as 23.
4. During the years preceding the recent financial crisis, increased leverage in some countries was accompanied by greater
reliance on short-term wholesale funding, with the result that banks became more vulnerable to the eventual disruption in
funding markets.
5. Borio (2003) discusses the differences between the microprudential and macroprudential approaches.
6. Our analysis of major Canadian banks covers the six largest banks, which account for approximately 90 per cent of total bank
assets.
2The regulatory measure of leverage in Canada is the ratio of total balance-sheet assets and
certain off-balance-sheet items to total regulatory capital (adjusted net Tier 1 and Tier 2 capital).7
The off-balance-sheet items in this measure cover all direct contractual exposures to credit risk –
including letters of credit and guarantees, transaction-related contingencies, trade-related
contingencies, and sale and repurchase agreements. These off-balance-sheet exposures – which
currently account for about 75 per cent of all off-balance-sheet assets of banks (excluding
undrawn liquidity lines and commitments) – are valued at their notional principal amounts.8
Various factors are considered when setting the assets-to-capital limit for individual institutions,
including operating and management experience, earnings, asset diversification, type of assets,
and appetite for risk (OSFI 2007). The standard limit is 20, but a lower level may be set for
individual institutions. Based on the above criteria, a newly established bank will usually have a
very low limit (as low as 5), and many small banks are subject to limits that have kept their
assets-to-capital multiples in the 10 to 12 range.
7. Quarterly data for the regulatory definition of leverage do not exist before 1992Q4 (year-end data are also available for 1988–
91). To provide a longer historical perspective, Chart 1 also reports an alternative measure that is the ratio of total on-balance-
sheet assets to shareholders’ equity and subordinated debt. The two measures have followed similar trends over the period for
which both series are available, although the level of the regulatory measure is about 0.9 higher, on average.
8. Securitization exposures, composed mainly of undrawn liquidity lines and commitments, are discussed in section 4.
3Since 2000, banks in good standing have been allowed to increase their limit to a multiple as
high as 23 if they meet a set of preconditions and provide a satisfactory forward-looking business
case. For example, the institution must demonstrate that it does not have undue risk
concentrations, and the business case must link the higher limit to lower-risk activities (such as
residential mortgages and well-secured repo transactions). Five of the six major banks have had
their limits set at 23 for at least part of this period.
Banks try not to operate too close to their limit, particularly if their balance sheet tends to be
volatile (as a result, for example, of heavy trading activities). If an institution operating at a
higher authorized multiple exceeds that limit, or allows its risk-based capital ratios to drop below
the risk-based capital targets, OSFI will reduce that institution’s limit and will require it to
submit an action plan for achieving the lower multiple. The institution will also be required to
operate at or below the lower level for four consecutive quarters, before being reconsidered for
an increase in its multiple. These provisions create an economic incentive for banks to operate
with a buffer that balances the expected gains from higher leverage against the expected costs of
exceeding the limit after encountering a shock. The size of the desired buffer may also increase
with the perceived variance of potential shocks. One implication of the buffer is that the
regulatory limits may be constraining behaviour even if observed leverage is not at the
authorized maximum.
3 The Impact of Regulatory Limits
We now examine trends in historical leverage ratios to assess how regulatory limits may have
affected the evolution of leverage at major Canadian banks. Several approaches are used to
answer this question, including international comparisons of leverage and analysis of changes in
behaviour as actual leverage approaches the regulatory ceiling.
3.1 Levels of leverage
The average leverage ratio at major banks exceeded 30 continuously over a 10-year period
starting in the early 1970s, and reached a peak of 40 in 1980 (Chart 1). Individual institutions
had ratios as high as 50 over that period. With the introduction of regulatory limits, aggregate
leverage declined dramatically in 1983 to a more moderate rate of 25, and it fell further over the
second half of the 1980s. It is likely that the leverage constraints contributed to the downward
trend over the decade. As noted earlier, although the formal limit was an assets-to-capital
multiple of 30 until 1991, the effective limits for individual banks were set at lower levels over
this period (particularly after 1985).9 Since 1985, the average leverage ratio has remained
consistently below 20.
9. Data for the effective leverage constraints are not available for the 1980s; however, anecdotal information suggests that they
were below 25 after 1985.
4International comparisons provide additional perspective for evaluating the role of leverage
constraints in recent years. Table 1 compares the changes in risk-weighted Tier 1 capital ratios
and unweighted leverage ratios during the years leading up to the financial crisis (2003Q4–
2007Q3). To facilitate comparison, the Tier 1 ratio is inverted so that an increase implies higher
risk-weighted leverage. To achieve a consistent definition across countries, leverage is defined as
the ratio of on-balance-sheet assets to shareholders’ equity. Thus, if the leverage ratio rises at a
faster pace than the inverted Tier 1 ratio, it would be explained by two potential factors: (i) an
increase in the ratio of unweighted assets to risk-weighted assets, and/or (ii) an increase in the
ratio of Tier 1 capital to shareholders’ equity. While explanation (i) could reflect a shift toward
safer assets, it may also occur if the risk weights are not adequately capturing an increase in the
true risk exposures owing to measurement problems. Table 1 also reports changes in the ratio of
unweighted assets to risk-weighted assets.
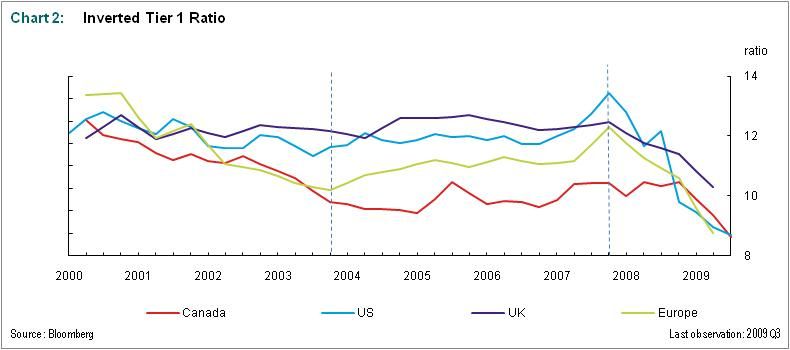
The inverted Tier 1 ratios show only small increases for both Canadian banks and major
international peers over the period up to 2007Q3 (Table 1 and Chart 2).10 In contrast, the trends
for unweighted leverage ratios are much less uniform across countries.11 The average leverage
ratio in Canada rose by only 1.2 during those years, in contrast to the significantly greater
increases at major banks in a number of countries not subject to regulatory constraints (Table 1
and Chart 3).12 As noted previously, U.S. commercial banks are also subject to leverage
requirements. Leverage at those institutions was stable in recent years, whereas leverage at U.S.
investment banks (not subject to these constraints) trended sharply upward starting in 2004.
10. The international comparisons use data for six major Canadian banks, ten large national and regional U.S. commercial banks,
five large U.S. investment banks, six major U.K. banks, and nine major continental European banks. Charts 2 and 3 include
vertical dotted lines to indicate the pre-crisis period covered in Table 1.
11. Accounting differences can affect international comparisons of measured leverage. For example, U.S. generally accepted
accounting principles (GAAP) practices allow reporting of net derivative positions on the balance sheet, whereas Canadian
GAAP and International Financial Reporting Standards require reporting of gross derivative positions. This difference means
that the level of leverage at U.S. banks is understated relative to Canadian leverage.
12. Consistent with the upward trend reported for the set of international banks covered in Table 1 and Chart 3, the average
leverage ratio increased to 30 at the world’s 50 largest banks (CGFS 2009).
5Table 1: Changes in Inverted Tier 1 Capital Ratios and Leverage
(2003Q4–2007Q3)
U.S. U.S.
Canada commercial investment U.K. Europe
banks banks
a
Inverted Tier 1 ratio 0.7 1.2 n.a. 0.2 1.5
Unweighted leverage ratio
-UWAb to shareholders’ equity 1.2 -0.3 8.1 7.0 5.9
Changes in ratio of:
UWA to RWAc 0.00 0.02 n.a. 0.72 0.34
a. Ratio of risk-weighted assets to Tier 1 capital
b. UWA: unweighted on-balance-sheet assets
c. RWA: risk-weighted assets
6This experience points out several lessons. First, the combination of stable Tier 1 ratios and
sharply rising leverage at some banks illustrates that risk-adjusted capital requirements were not
sufficient to prevent a significant cyclical buildup of leverage in some countries during the pre-
crisis period.
Second, the pronounced divergence between weighted and unweighted ratios in some countries
also suggests that a simple leverage ceiling would be a useful tool to complement the risk-
weighted measure and mitigate procyclical increases in leverage.13
Third, in light of subsequent developments, it is evident that weaknesses of risk-assessment
methods led to underpricing of risks in the trading book over this period (CGFS 2009), which
contributed to sharp increases in leverage at banks with high trading book activity. This point is
illustrated using the example of UBS, a major Swiss bank, which had a large increase in its
portfolio of asset-backed security–collateralized debt obligation assets (mostly related to the U.S.
subprime market) prior to the crisis. Since the VaR models assigned these assets low risk
weights, the higher trading activity led to a sizable increase in the ratio of total unweighted assets
to risk-weighted assets, which resulted in leverage rising sharply despite a stable and seemingly
strong risk-weighted capital ratio (Chart 4).14 The shortcomings of risk measurement are
13. Hildebrand (2008) uses recent Swiss experience to emphasize the complementary role of a leverage ratio: “Looking at risk-
based capital measures, the two large Swiss banks were among the best-capitalised large international banks in the world.
Looking at simple leverage, however, these institutions were among the worst-capitalised banks. With the benefit of
hindsight, we clearly should have put more emphasis on the risks of excessive leverage.” Chart 4 illustrates the situation for
one of these banks.
14. More generally, Table 1 shows that an increase in the ratio of unweighted assets to risk-weighted assets contributed to
leverage rising faster than risk-weighted ratios at U.K and continental European banks.
7illustrated by the fact that large losses were incurred on these assets that were assigned low risk
weights prior to the crisis.15 As noted previously, a supplementary leverage requirement could
help control the growth of leverage and system-wide vulnerabilities under these conditions.
While it is difficult to quantify the effect of the leverage constraint, the above evidence suggests
that it helped to mitigate the cyclical buildup in leverage in Canada. The relatively low levels of
leverage at the start of the financial crisis have meant that Canadian banks have faced less
pressure for deleveraging than some of their international counterparts, thereby mitigating the
procyclical movements in the current downturn. Since the start of the financial crisis, the
leverage ratio has fallen moderately in Canada. Elsewhere, there has been a pronounced decline
in the leverage ratio for U.S. investment banks, owing in part to capital injections (Chart 3).
Despite decreases in 2009Q2, leverage remains comparatively high for major banks in the United
Kingdom and continental Europe.16
3.2 Trends in leverage buffers in Canada
As noted earlier, a bank will maintain a buffer as it balances the incentives to expand leverage
versus the costs of exceeding the limit. During the upswing of a credit cycle, it is expected that
the leverage buffer would tend to decrease, but the need to satisfy the leverage constraint on an
ongoing basis should ultimately restrain further decreases in the buffer. In this section, we
examine how the buffer moves over a cycle and whether the behaviour of major banks changes
as leverage approaches the regulatory limit.
15. See UBS (2008).
16. Preliminary information for the third quarter of 2009 suggests that European banks have continued to reduce their leverage.
8Chart 5 shows that the buffer between a bank’s actual leverage and its authorized limit varies
over time.17 The typical buffer peaked in the early 1990s in the aftermath of a recession, and then
fell steadily during the recovery period and remained below average for the second half of the
decade. The average buffer moved up again after 2000 as the maximum assets-to-capital multiple
was raised to 23 for qualifying institutions, and then fell back closer to the sample average in the
following few years. The buffer moved above the historical average during the recent economic
slowdown.
To provide further insight into cyclical behaviour, Table 2 reports correlations between the
buffers of individual banks and simple indicators of the aggregate credit and business cycles. In
most cases, the buffers have a moderate negative correlation with cyclical credit conditions (as
measured by the trend growth in total credit), indicating a tendency to decrease during boom
periods. There tends to be a low negative correlation with the output gap, showing a weak
propensity for the buffer to fall when there is excess demand in the economy.
17. Leverage buffers cannot be constructed prior to 1991, since data for the effective leverage constraints at individual banks are
not available before that date.
9Table 2: Summary Statistics (1992Q4–2009Q1)a
Bank 1 2 3 4 5 6
Leverage buffer
Average 3.51 4.34 4.27 4.04 4.96 4.80
Standard deviation 1.76 1.80 1.60 1.60 1.46 1.40
- - -
Correlation with
0.55*** 0.47*** -0.37** 0.02 0.59*** -0.13
credit growthb
Correlation with
-0.21* -0.21* -0.33** 0.02 -0.23* -0.11
output gap
a. Canadian banks report on a fiscal year ending on 31 October.
b. Defined as the year-over-year percentage change in total nominal household and business
credit in Canada
*** indicates statistical significance at the 1 per cent level, ** at the 5 per cent level, and * at
the 10 per cent level
Further empirical analysis was done to examine how banks manage their leverage buffers. Two
related questions were considered. First, we examine whether the persistence of a positive shock
to leverage varies depending on the size of its buffer. Specifically, do increases in leverage
become less persistent when the buffer is relatively low and leverage is close to its ceiling? This
behaviour would be consistent with banks taking quick actions to reverse the initial positive
shock to leverage in order to reduce the risk that further shocks will push leverage above its
limit. Second, what types of balance-sheet adjustments occur when the buffer is unusually low?
If banks want to raise their buffers in this situation, do their actions take the form of faster
growth in capital, slower growth in assets, or some combination?
To address the first question, we estimated an autoregressive regime-switching model of the
leverage buffer for each bank using data from 1992Q4 to 2009Q1. The appendix provides a
detailed exposition of the econometric methodology and results. Briefly, we test whether the
parameter estimate for the lagged dependent variable (i.e., persistence) changes when the
leverage buffer falls below some endogenously determined threshold. As shown in the appendix,
the results for two banks (banks 1 and 2) are consistent with this type of behaviour. When the
leverage buffer is relatively low (i.e., below its estimated threshold), the coefficient for the
lagged dependent variable is not statistically significant at conventional significance levels. This
regime may be interpreted as a “stress zone;” when some development pushes leverage above a
certain level relatively close to the regulatory limit, the bank reacts by reversing the shock in the
next quarter and raising the buffer between leverage and its limit. Conversely, in the second
regime, when the buffer is relatively high, the same coefficient is positive and statistically
significant, indicating that changes in leverage are persistent. This asymmetric behaviour is
illustrated in Chart 6, which uses the model for one of these banks to show the different
10responses of leverage following shocks that move the buffer below the threshold and above the
threshold.
Models for the other banks do not uncover evidence of asymmetric behaviour. Chart 7 indicates
that both positive and negative shocks to the buffer are more persistent for this set of banks.18 For
these institutions, 75 per cent of a positive shock is typically reversed within 12 quarters,
compared to 4 quarters for the first group of banks.
Further research would be useful to better understand the reasons for these differences in
behaviour across banks. However, it is interesting to note a link between the average size and
18. In Chart 7, the shocks are applied to a starting point with the leverage buffer at its average level.
11volatility of buffers and the dynamic responses to shocks. Banks that respond more aggressively
to reverse shocks that move leverage relatively close to the limit (Chart 6) tend to have a buffer
that is smaller, on average, and more volatile than the other banks. That is, banks operating with
a lower desired buffer may need to act more quickly in order to reduce the risk that a series of
positive shocks will move leverage above the authorized limit.
We next consider the second question – namely, how do banks adjust their balance sheets after a
shock moves leverage relatively close to its limit? For this purpose, we separate the data for each
bank into two subsamples: for the two banks with significant threshold effects, the sample is
separated between periods with the buffer above and below the estimated threshold; for the
banks without a significant threshold, we use the sample mean as the dividing line to separate the
data. We then calculate the average growth rates for the two components of the regulatory assets-
to-capital multiple (capital and assets) under each regime, and test for equality of means in the
two subsamples.
For the banks with a threshold effect, there is a significant shift in behaviour between the two
subsamples. When the buffer crosses the threshold and becomes relatively low, these banks tend
to reduce leverage in future quarters through a combination of significantly weaker asset growth
and much stronger growth in capital (Table 3).19 The sizable difference between the growth rates
for capital and assets is consistent with the econometric result that increases in leverage are
quickly reversed in this regime (Chart 6). For the remaining banks, asset growth is quite similar
across the two subsamples, but capital is increased more rapidly when buffers are relatively low.
Table 3: Asset and Capital Adjustments
(Average quarterly growth rate)
Asset growth (%) Capital growth (%)
Full sample 2.30 1.95
Significant threshold only
Regime with high buffer 3.32 0.62
Regime with low buffer 0.77 3.87
Test for equality of means Rejected at 1% Rejected at 1%
Insignificant threshold only
Above average buffer 2.40 1.27
Below average buffer 2.12 2.88
Test for equality of means Cannot reject Rejected at 5%
19. The differences in means are statistically significant between the two regimes.
12The above results are summarized in Table 4. A caveat to this empirical analysis is that the
results are based on a relatively short sample starting in 1992Q4. A longer sample period with
more cycles might help to better identify threshold effects and changes in bank behaviour.
Table 4: Summary of Results
Banks Persistence Mean Standard
buffer deviation
of buffer
Group 1 • asymmetric persistence 3.93 1.78
(banks 1 following shocks
and 2)
• shocks that lower
buffers below
thresholds are quickly
reversed by restricting
asset growth and
increasing capital
growth
Group 2 • symmetric persistence 4.37 1.53
following shocks
• changes in leverage are
more persistent for this
group of banks (buffers
tend to be higher and
less volatile)
Note: The mean buffers and standard deviations are statistically different across groups
at the 1 per cent level.
4 Other Issues
Concerns have been raised regarding potential adverse incentives arising from a regulatory
constraint on unweighted leverage ratios. These issues are briefly reviewed in light of the
Canadian experience.
A common criticism of a leverage requirement defined to include only on-balance-sheet assets is
that it creates an incentive for banks to move assets off their balance sheets to bypass the
leverage constraint. The Canadian regulatory measure does include some off-balance-sheet items
(specifically, direct contractual exposures). Regarding other types of off-balance-sheet activity,
securitized assets of major banks are currently a relatively small percentage (about 10 per cent)
relative to their total on-balance-sheet assets. The gap between the regulatory definition of
13leverage and an augmented measure including securitized assets has risen somewhat in recent
years, although part of the increase reflects a change in the reporting of securitization data (Chart
8).20 A range of factors have led to greater securitization in many countries, so it is difficult to
gauge the extent to which the increase in Canada reflects incentives arising from the leverage
constraint as opposed to other factors. Overall, however, the diversion of activity to off-balance-
sheet assets does not appear to have significantly affected the trends for the regulatory measure
in Canada.21
A second potential concern is that banks will shift the mix of activity toward riskier assets as a
way to boost their income when the leverage constraint is limiting overall balance-sheet growth.
In Canada, the ratio of risk-weighted assets to total balance-sheet assets has been falling – not
rising – since the mid-1990s, although the risk-measurement issues discussed previously may
suggest some caution when using this indicator. As another test for an induced shift to riskier
assets, we used realized losses since the beginning of the crisis as an indicator of risk-taking
behaviour before the crisis. All else equal, the hypothesis predicts that jurisdictions with a
leverage constraint would tend to have higher losses during the downturn. However, the
available data show that capital market writedowns and loan losses at Canadian banks have been
lower (relative to shareholders’ equity) than for many of their international peers (Chart 9).
While maintaining low and stable leverage, U.S. commercial banks still realized significant
losses. This can be explained in part by losses on off-balance-sheet securitized assets, an item
that is not included in the U.S. regulatory leverage measure. By comparison, such securitization
is of lesser importance in Canada.
20. Data collected on third-party securitized assets were expanded in 2006 to include all vehicles sponsored or administered,
rather than only those with recourse provisions.
21. Revisions to accounting standards are expected to return many off-balance-sheet exposures to the balance sheets of Canadian
banks (OSFI 2009).
14Thus, despite the incentive to shift toward riskier assets when the constraint is binding, there is
little evidence that this type of behaviour was prevalent in the years leading up to the financial
crisis. This observation suggests that other aspects of the Canadian supervisory regime have
mitigated the potential adverse effects on risk-taking behaviour.
5 Conclusions
This paper has reviewed lessons from the Canadian experience with leverage constraints over the
past 25 years. The role of a leverage constraint is to act as a complement – not a substitute – for
risk-weighted measures of capital adequacy. More broadly, it should be viewed as one
component of the regulatory regime, rather than as a substitute for other risk-management and
supervisory practices.
Risk-weighted capital requirements were not sufficient to prevent a sizable buildup in leverage in
some countries during the years preceding the financial crisis. This experience suggests that a
leverage ceiling would be a useful tool to complement risk-weighted measures and mitigate
procyclical tendencies in the financial system. In contrast to the significant increases in a number
of countries without leverage constraints, leverage at major Canadian banks was relatively stable
during the years leading up to the crisis. The relatively low levels in Canada have reduced the
pressure for deleveraging during the downturn.
Empirical analysis provides evidence that banks follow different strategies for managing their
leverage buffers. Some banks tend to raise their buffers very quickly when a shock pushes
leverage too close to its authorized limit (as might occur during a cyclical upturn). These
adjustments are achieved through sharp reductions in asset growth and faster growth in capital.
At other banks, shocks have more persistent effects on leverage, which could be explained by the
15fact that these banks tend to have higher buffers on average. Future research (using longer data
samples) could provide further insight into the determinants of desired average buffers, the
dynamic adjustments of buffers, and the importance of threshold effects. In addition, although
risk-weighted requirements do not guarantee that leverage will not rise to unsustainable levels, it
would be interesting to investigate more directly the relative roles of risk-weighted requirements
and leverage requirements in the evolution of leverage over time. This question is left for future
research.22
Various international groups, including a recent G-20 Working Group and the Basel Committee
on Banking Supervision, have included a non-risk-based supplementary measure of capital
adequacy on their lists of macroprudential policy options to reduce procyclicality and strengthen
the resiliency of the global financial system. When designing a supplementary leverage
requirement, it will be important to mitigate the risks that it will create incentives for banks to
shift activity to off-balance-sheet instruments or riskier assets. Strategies to achieve this
objective would include selecting an appropriate definition of the regulatory measure, and
designing the risk-weighted and simple leverage requirements in ways that avoid arbitraging
behaviour.
22. A longer sample period would also be useful to examine this question.
16Appendix: Testing for Asymmetric Adjustments in Leverage
This appendix describes the econometric methodology used to examine the dynamic behaviour
of leverage buffers in Canada. We begin with a brief survey of related empirical literature. There
is little formal empirical evidence on the impact of leverage constraints. Based on analysis of the
early 1980s and early 1990s, Wall and Peterson (1987, 1995) conclude that U.S. regulatory
standards were a binding constraint on the levels of leverage at U.S. bank holding companies in
those periods.
Several studies have used partial-adjustment models to examine the determinants of risk-
weighted capital buffers. Based on a sample of EU15 banks, Jokipii and Milne (2008) find that
capital buffers exhibit significant negative co-movement with the real business cycle (proxied by
GDP growth), suggesting procyclical behaviour. Comparable results are obtained by Ayuso,
Perez, and Saurina (2004), who conduct a similar exercise with Spanish banks.
Other papers provide cross-country analysis of the cyclicality of leverage and capital-adequacy
ratios (but not buffers).23 Rime (2001) uses Swiss data to estimate a two-equation structural
partial-adjustment model of capital-adequacy ratios and the riskiness of assets (measured as the
ratio of risk-weighted assets to total assets). The model includes a dummy variable equal to one
when the capital ratio is within one standard deviation of the regulatory capital requirement. This
variable provides evidence on whether behaviour changes when capital is relatively close to
regulatory requirements, although the dummy variable specification has the limitation of
imposing an exogenous threshold for a change in behaviour.
The model
To empirically assess how Canadian banks manage their leverage buffers, we use a discrete
autoregressive regime-switching model that endogenously determines whether there is a
threshold in the data (that is, whether behaviour changes once the leverage buffer falls below
some critical value).24 The model is defined as follows:25
23. See Bikker and Metzemakers (2004) and Brewer, Kaufman, and Wall (2008).
24. This procedure, first introduced by Tong (1978), is known as a Self-Exciting Threshold Autoregressive (SETAR) model. As
discussed by Hansen (1996), we are able to test for the significance of the threshold T using a Lagrange multiplier test.
Following Andrews (1993), the first and last 15 per cent of the sample distribution are excluded for purposes of establishing
the threshold by a grid search (this reduces the impact of outliers that might bias the test for a threshold).
25. Alternative versions of this model were estimated in an attempt to model explicitly the determinants of optimal leverage
(including bank-specific variables and several measures of cyclical conditions). Systematic results were not obtained, so
results are presented here for only the autoregressive model.
17where T is the estimated threshold level of the buffer.
The hypothesis to be tested is as follows. If some development pushes the buffer below some
critical threshold (T), a bank may take quick actions to reverse the shock in order to mitigate the
risks of exceeding the authorized limit. Thus, movements in leverage when the buffer is below
the threshold (i.e., when the bank is operating closer to its limit) may be less persistent than
movements in leverage when the bank has a larger buffer. The existence of a statistically
significant threshold effect would be evidence of a change in behaviour, and a comparison of the
coefficients on the lagged dependent variable between the two regimes would indicate how
behaviour (persistence) changes. Our model is estimated using quarterly data for the six largest
Canadian banking institutions, from 1992Q4 to 2009Q1. The starting point was determined by
the availability of quarterly data for the regulatory assets-to-capital multiple. We estimate the
model on a bank-by-bank basis.26
As shown in Table A1, two of the six banks have a statistically significant threshold (T). In the
first regime with the buffer above its threshold, changes in leverage are persistent as the buffer
falls gradually after a shock.27 In contrast, in the second regime, when leverage is closer to its
limit and the buffer is below the threshold, the persistence parameter is not significantly different
from zero at conventional significance levels. In this case, positive shocks to leverage (i.e.,
decreases in the buffer) are quickly reversed (see Chart 6 in the main text for an illustration of
the asymmetric behaviour). For the remaining banks, we report only the full-sample results, since
no evidence of asymmetric adjustment was found.
26. We do not use threshold panel regressions, primarily owing to problems related to estimation of panels using data sets with a
small number of cross-sections (i.e., firms) and a relatively long time series. Beck and Katz (1995) and Chen, Lin, and Reed
(2006) conclude that panel corrected-standard error estimation produces correct standard errors at the cost of lower efficiency
of the estimators, whereas generalized least squares is more efficient in terms of estimation but understates the standard
errors. Moreover, in the context of panel threshold models, the above corrective measures have not been validated.
27. The autoregressive estimate greater than one in the first regime of the model for bank 2 is not indicative of an unstable
process. In the absence of further shocks, the buffer would fall in this regime in which the buffer is above threshold; however,
the downward movement would be reversed if the buffer falls sufficiently to cross the threshold and enters regime 2.
18Table A1: Estimation Results
Bank 1 3 4
Regime 1 Regime 2
Full (with high (with low
sample buffer) buffer) Full sample Full sample
R-bar 0.569 0.559 0.000 0.655 0.769
observations 65 44 21 65 65
threshold (T) 2.50***
α 0.830*** 0.090 1.941*** 0.838*** 0.490*
β 0.749*** 0.920*** 0.000 0.798*** 0.879***
Bank 2 5 6
R-bar 0.461 0.728 0.070 0.848 0.508
observations 65 36 29 65 65
threshold (T) 3.78***
α 1.437*** -2.531*** 2.325*** 0.194 1.327***
β 0.658*** 1.315*** 0.462* 0.947*** 0.726***
*** indicates significance at the 1 per cent level, ** at the 5 per cent level, and * at the 10 per cent
level
Parameter estimates from these models are used to calculate the dynamic response of the
leverage buffer following a shock. Charts 6 and 7 report these results for representative banks.
Finally, it is important to note that the relatively short sample period may be a limiting factor in
the estimation of the model. In applying the grid-search methodology, the first and last 15 per
cent of the sample distribution are eliminated from the data set to identify the threshold, although
the remaining parameters are estimated over the full sample. The distribution is trimmed to
reduce the impact of outliers that might bias the test for a threshold. A longer sample with more
cycles might allow more precise estimation of threshold effects and persistence.
19References
Andrews, D. W. K. 1993. “Tests for Parameter Instability and Structural Change with Unknown
Change Point.” Econometrica 61 (4): 821–56.
Ayuso, J., D. Perez, and J. Saurina. 2004. “Are Capital Buffers Pro-cyclical? Evidence from
Spanish Panel Data.” Journal of Financial Intermediation 13 (2): 249–64.
Bank for International Settlements (BIS). 2009. “Comprehensive Response to the Global
Banking Crisis.” Press Release, 7 September. Available at
.
Beck, N. and J. Katz. 1995. “What to Do (and Not to Do) with Time-Series Cross-Section Data.”
The American Political Science Review 89 (3): 634–47.
Bikker, J. and P. Metzemakers. 2004. “Is Bank Capital Procyclical? A Cross-Country Analysis.”
De Nederlandsche Bank Working Paper No. 009/2004.
Blum, J. 2008. “Why Basel II May Need a Leverage Ratio Restriction.” Journal of Banking and
Finance 32 (8): 1699–1707.
Borio, C. 2003. “Towards a Macroprudential Framework for Financial Supervision and
Regulation?” BIS Working Paper No. 128.
Brewer, E., G. Kaufman, and L. Wall. 2008. “Bank Capital Ratios across Countries: Why Do
They Vary?” Federal Reserve Bank of Atlanta Working Paper No. 2008-27.
Chen, X., S. Lin, and W. Reed. 2006. “Another Look at What to Do with Time-Series Cross-
Section Data.” University of Canterbury Working Paper No. 04/2006.
Committee on the Global Financial System (CGFS). 2009. “The Role of Valuation and Leverage
in Procyclicality.” CGFS Paper No. 34, April.
Dickson, J. 2009. “Capital and Procyclicality in a Turbulent Market.” Office of the
Superintendent of Financial Institutions Canada. Remarks to the RBC Capital Markets
Canadian Bank CEO Conference, Toronto, Ontario, 8 January.
G-20 Working Group 1. 2009. “Enhancing Sound Regulation and Strengthening Transparency:
Final Report.” 25 March.
Hansen, B. E. 1996. “Inference when a Nuisance Parameter Is Not Identified under the Null
Hypothesis.” Econometrica 64 (2): 413–30.
Hildebrand, P. 2008. “Is Basel II Enough? The Benefits of a Leverage Ratio.” Lecture presented
at the London School of Economics, 15 December.
Illing, M. and G. Paulin. 2004. “The New Basel Capital Accord and the Cyclical Behaviour of
Bank Capital.” Bank of Canada Working Paper No. 2004-30.
Jokipii, T. and A. Milne. 2008. “The Cyclical Behaviour of European Bank Capital Buffers.”
Journal of Banking and Finance 32 (8): 1440–51.
Office of the Superintendent of Financial Institutions Canada (OSFI). 2007. Guideline for
Capital Adequacy Requirements. Ottawa: OSFI.
20Office of the Superintendent of Financial Institutions Canada (OSFI). 2009. Draft Advisory:
Conversion to International Financial Reporting Standards by Federally Regulated Entities.
October. Ottawa: OSFI.
Rime, B. 2001. “Capital Requirements and Bank Behaviour: Empirical Evidence for
Switzerland.” Journal of Banking and Finance 25 (4): 789–805.
Swiss Federal Banking Commission. 2008. “SFBC and Large Banks Agree to Set Higher Capital
Adequacy Targets and Introduce a Leverage Ratio.” Press Release, 4 December.
Tong, H. 1978. “On a Threshold Model.” In Pattern Recognition and Signal Processing, edited
by C. H. Chen, 575–86. Amsterdam: Sijhoff and Noordhoff.
UBS. 2008. “Shareholder Report on UBS’s Write-Downs.” 18 April. Available at
.
Wall, L. and D. Peterson. 1987. “The Effect of Capital Adequacy Guidelines on Large Bank
Holding Companies.” Journal of Banking and Finance 11 (4): 581–600.
———. 1995. “Bank Holding Company Capital Targets in the Early 1990s: The Regulators
versus the Markets.” Journal of Banking and Finance 19 (3–4): 563–74.
Youngman, P. 2009. “Procyclicality and Value at Risk.” Bank of Canada Financial System
Review (June): 51–54.
21You can also read