REPRESENTATIVE DEMOCRACY IN BRAZIL: AN ANALYSIS OF THE PERFORMANCE OF CONGRESSIONAL REPRESENTATIVES IN LIGHT OF THE DEVELOPMENT INDICES OF THEIR ...
←
→
Page content transcription
If your browser does not render page correctly, please read the page content below
DOI: 10.5902/1983465936167

    REPRESENTATIVE DEMOCRACY IN BRAZIL: AN
ANALYSIS OF THE PERFORMANCE OF CONGRESSIONAL
 REPRESENTATIVES IN LIGHT OF THE DEVELOPMENT
      INDICES OF THEIR STATES AND REGIONS
        A DEMOCRACIA REPRESENTATIVA NO BRASIL: UMA
        ANÁLISE DA ATUAÇÃO DOS DEPUTADOS FEDERAIS
      FRENTE AOS ÍNDICES DE DESENVOLVIMENTO DE SEUS
        ESTADOS E A REGIÃO GEOGRÁFICA QUE OCUPAM
                                                                                                          Submission: 21/12/18
                                                                                                             Accept: 30/04/20

                                                   Liliane Teixeira1
                                          Ellen Corrêa Wandembruck Lago1
                                                  Leonardo Tonon2

                 1 Universidade Tecnológica Federal do Paraná – UTFPR, Academic Department of Management and
                                                Economics, Curitiba, Paraná, Brazil
                            2 Universidade Federal do Rio Grande do Sul - UFRGS, Porto Alegre, RS, Brazil.

ABSTRACT
Purpose – This study seeks to verify whether the performance of Brazilian Congressional Representatives is
related to MHDI and GDP per capita indices and the regions they represent.

Methodology – Regarding the performance of the parliamentarians, the data used were those made available
by the Transparência Brasil portal and analyzed using the multivariate exploratory non-hierarchical cluster
analysis technique K-means. Federative Units were divided into clusters according to the similarities they pre-
sented with respect to the variables that made up the analysis.

Findings – After the analyses, we were able to determine that there is no relation of equivalence between the
performance of representatives in Congress and the observed research development indices (MHDI and GDP
per capita) with states of different regions and quite distinct conditions of development making up the same
group of analysis.

Originality/value – The researched data, or even the identification of transparency actions demonstrates the
wide variety of analysis possibilities that are available in terms of discussions of the performance of political
agents and their respective returns for the population. We would suggest that future studies can use other
data or other reports displayed in the transparency portals of various spheres of government. Other research
possibilities can be developed based on qualitative analyses of the effective representativity of the projects
proposed by these representatives of the people.

Keywords - Democracy; Representative democracy; Representative democracy in Brazil; Municipal Human
Development Index (MHDI); Gross Domestic Product (GDP) per capita.

                        Rev. Adm. UFSM, Santa Maria, v. 14, n. 2, April-June, p. 297-314, 2021
                                                           - 297 -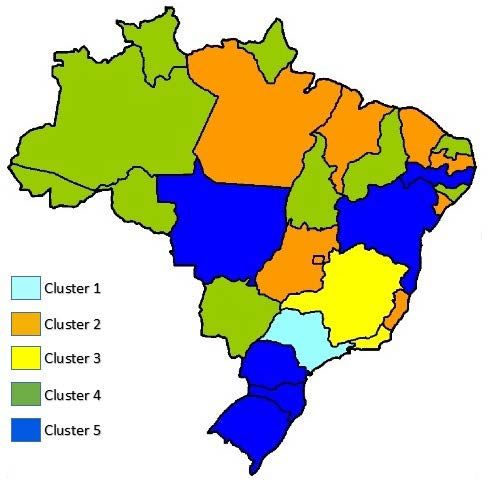
RESUMO
Objetivo - O estudo a seguir tem por objetivo verificar se a atuação dos Deputados Federais das Unidades
Federativas brasileiras guarda relação com o IDHM, com o PIB per capita e com a região geográfica em que
elas estão localizadas.

Metodologia - Com relação à atuação dos parlamentares, os dados utilizados foram os disponibilizados
pelo portal Transparência Brasil e analisados a partir da técnica exploratória multivariada de análise de
conglomerados não hierárquicos K-means. As Unidades Federativas foram divididas em clusters segundo às
similitudes que apresentavam com relação às variáveis que compunham a análise.

Resultados - Após as análises, foi possível constatar que não há uma relação de equivalência entre a atua-
ção dos parlamentares da Câmara e os índices observados no desenvolvimento da pesquisa (IDHM e PIB
per capita), de modo que Unidades Federativas de diferentes regiões e com condições de desenvolvimento
bastantes distintas compuseram o mesmo grupo de análise.

Originalidade/Valor - Os dados pesquisados ou mesmo a identificação de ações de transparência passam a
demonstrar a diversidade de possiblidades de análise que surgem quando das discussões acerca da atuação
dos agentes políticos e seu respectivo retorno à população. Sugere-se que estudos futuros possam per-
correr outros dados ou relatórios disponibilizados por outros portais da transparência de várias esferas do
governo. Outras possibilidades de estudo ainda poderão ser desenvolvidas a partir de análises qualitativas
acerca da efetiva representatividade dos projetos propostos pelos representantes do povo.

Palavras-chave - Democracia; Democracia representativa; Representação democrática no Brasil; Índice de
Desenvolvimento Humano Municipal (IDHM); Produto Interno Bruto (PIB) per capita.

1 INTRODUCTION

            To begin with, we would like to note that the Brazilian political system is democratic, which
means that the people are in power (Lordêlo & Pontes, 2009). Thus, democracy can be understood
as a regime of government in which popular sovereignty prevails (Bobbio, 2000). However, the Bra-
zilian democratic regime is exercised in a mixed form. Article 1 of the Magna Carta states that “All
power emanates from the people, who exercise it through elected representatives or directly un-
der the terms of this Constitution” (Brasil, 1988). In this sense, democracy can be exercised by the
people in an indirect or representative manner through elected representatives, or directly by the
population through referendums, plebiscites, or popular initiatives.
            The legislative branch is composed of the Senate and the House of Representatives. These two
chambers make up the Congress (Brasil, 1988). Representatives request resources and projects which meet
the needs of their constituents, in order to ensure that the interests of the population are represented. The
performance of these representatives should thus improve the human development of the states they rep-
resent through their proposals for local growth in economic, social, cultural and other spheres.
            However, factors such as the absence of representatives at legislative sessions, the presentation of
insignificant projects, and a lack of commitment can harm the development of a state, through the impos-
sibility of raising the financial resources which make the implementation of public policies effective in the
regions they represent. Moreover, it should be noted that Brazil is a country with a high level of corruption
among political representatives, which leads to a constant collective feeling of outrage and impunity.
            The NGO Transparency Brazil has been created to measure political actions in Brazil in or-
der to monitor the government, seeking transparency in an independent manner (Transparência
Brasil, 2017). In addition, the Municipal Human Development Index (MHDI) and Gross Domestic

                       Rev. Adm. UFSM, Santa Maria, v. 14, n. 2, April-June, p. 297-314, 2021
                                                      - 298 -
Product (GDP) per capita also make it possible to compare development in different states and verify
in a practical manner their situation in comparison with other locations.
Thus, this study seeks to analyze the performance of congressmen and the development in-
dices in Brazilian states to understand the relationship between policy performance and the Municipal
Human Development Index (MHDI) and the Gross Domestic Product (GDP) per capita of the states they
represent. To accomplish this, the next section will present this study’s theoretical references which
deal with concepts of democracy, representative democracy and democratic representation in Brazil,
the Municipal Human Development Index (MHDI) and Gross Domestic Product (GDP) per capita. The
third section will present our research methodology and this case study. The fourth will present our
results and discussion, while the last section will present this study’s conclusions.
2 THEORETICAL REFERENCES
2.1 Democracy
According to Bobbio (2000), democracy can be understood as various forms of govern-
ment, especially those in which the power is not in the hands of a single person or a few, but rather
in the hands of all or the majority of the people. The idea of democracy arose in the fifth century B.C.
in Ancient Greece, with the understanding of a form of government which would represent the over-
all will of the citizens, which was transformed into an innovative practice which came to be identified
with the Greek ideals of justice and virtue (Lordêlo & Pontes, 2009).
In this sense, Baptista (2010) asserts that the term “democracy” acquired a much broader
and vague popular meaning representing a “generically just society”. However, classifying a society
as democratic or not based on justice or injustice may weaken the concept of democracy, given that
it is not linked to the concept of justice or injustice, but “has to do with the preservation of the polit-
ical equality of citizens during the decision-making process” (Baptista, 2010, p. 505).
In general, democracy is the preferred political regime of most people (Inglehart, 2003),
however, Brazilians do not trust the democratic institutions of the political parties, of Congress, or
the judicial system (Moises, 2010). This is due mainly to recurrent corruption in the country, which
has led the population to lose faith in politicians and governmental administration. Moises (2010)
also states that democracy is a relatively new phenomenon in Brazil, and it is important that there
be advances in the Brazilian public’s knowledge of democracy.
It should be emphasized that even though there is wide discussion of democratic concepts
in academia, the widespread incorrect appropriation of the term has led to fewer and fewer citizens
who really understand it (Barrueto & Navia, 2013). However, even in the midst of disagreements
about this subject, democracy still is viewed positively in comparison with the other existing political
regimes (Villas Boas, 2010).
In comprehensive terms, Cheibub and Przeworski (1997) clarify that democracies are not all
alike, and that the main difference consists of the existence of parliamentary and presidential democ-
racies. According to the authors, parliamentary democracies are those in which the legislative branch
can change the executive, while presidential democracies are those in which the executive cannot be
deposed except under special circumstances. The authors also point out the existence of mixed systems,
in which the president is elected, but depends on the confidence of the legislative branch to survive.
In relation to the expectations of the citizen in respect to democracy, Moises (2010, p. 278)
clarifies:
(...) it is expected that this regime will be capable of satisfying the expectations of the citizens
in terms of the mission that they attribute to the government (the quality of results); they
trust that it will assure citizens and their associations broad freedoms and the necessary
Rev. Adm. UFSM, Santa Maria, v. 14, n. 2, April-June, p. 297-314, 2021
- 299 -political equality so that the people can achieve their aspirations or further their interests
(quality of content); and expect that institutions through elections and checks and balances
will permit citizens to evaluate the performance of the government and its representatives
(quality of procedures).
Within this context, Rousseau (1995, p. 99) argues in favor of participative democracy, in af-
firming that “(...) laws are the conditions of civil association. The people submitted to laws should be
the author of them, only those who are associated with them can rule the conditions of society”. On
the other hand, Locke (1973) argues for representative democracy, emphasizing that the legislature
should be composed of representatives of the people for a given period, and the power to select
them will also be exercised by the people.
2.2 Representative democracy
John Locke (1973) argues that legislative power should be exercised by representatives of the
people, elected democratically for this function. Bobbio, Matteucci and Pasquino (1998) mention that
representative democracy is opposed to absolute and autocratic regimes which take away political
control from the people, emphasizing that the meaning of political representation is in the possibility
of controlling political power, attributed to those who cannot personally exercise this power.
Representation, as a political institution, has come to be understood as legitimate to the
extent that it manifests itself as being democratic (Baptista, 2010). Representation, therefore, is
directly related to democratic theory (Corval, 2015), given that representative democracy makes it
possible to faithfully reflect the ideologies of the citizens (Urbinati, 2006). In this sense, Locke (1973)
proposes the election of representatives to exercise political power, with prerogatives to prepare
laws to protect and regulate the right to private property and individual freedoms through the state.
To Corval (2015, p. 266), representation creates another space of power which is “not con-
ditioned by the diffuse forces of society, but rather politically organized on top of it, influencing it”.
In this manner, complaints and demands become more and more complex, with it being necessary
“to guarantee greater interaction between the government and society, or in other words, between
the representatives and the represented” (Lordêlo & Pontes, 2009, p. 88).
Representative democracy, therefore, constitutes an original form of government, and is in
no way similar to electoral democracy to the extent that there exist “conditions which make repre-
sentative democracy a form of political participation which can activate a variety of forms of control
and supervision of its citizens” (Urbinati, 2006, p. 191). In a more specific way, Mill (2006) affirms
that representative government is that in which the entire public (or the majority of it) exercises
extreme controlling power through its representatives which should exist in some form under any
constitution. In a certain way, this makes it possible to understand the reality of our national context,
in accordance with the discussions which will follow below.
2.3 Democratic representation in Brazil
The Constitution in its first Article conceives of the Federal Public of Brazil as a Democratic State of
Law, whose federal entities are the country, the states, the municipalities and the Federal District (Brasil, 1988).
The government consists of three independent harmonious powers: The Executive, the
Legislative and the Judiciary. The head of the Executive Branch and the members of the Legislative
Branch are elected by the people, through direct elections, and should be affiliated with a political
party for at least six months in order to run for political office (Brasil, 1988).
Rev. Adm. UFSM, Santa Maria, v. 14, n. 2, April-June, p. 297-314, 2021
- 300 -The members of the Senate are elected directly according to the majority principle. Each
state and the Federal District has three senators with eight-year mandates (Brasil, 1988). It should
be added that the number of representatives of each of the states and the Federal District cannot
be less than eight or greater than seventy as established by Article 45 of the Constitution (Brasil,
1988). Complementary Law nº 78/1993, regulates Article 45 of the Constitution and establishes that
the number of representatives in the lower chamber of Congress cannot surpass 513 (Brasil, 1993).
As mentioned above, unlike the president, governors, mayors and senators, representa-
tives on the federal, state, and district levels as well as councilmen are elected using a proportional
system. For this system, the voter can opt to vote for a given candidate or opt to vote for a party
slate, even if it has formed coalitions with other parties. Once the voting is finished, all the valid
votes are counted whether they are for a slate or for a candidate. The number of valid votes is divid-
ed by the number of seats to be filled, which in the case of the House of Representatives can vary
between eight and seventy according to the population of the state represented. The value obtained
is termed the electoral quotient.
The number of seats that each party or coalition has a right to in the House of Representa-
tives (or in the legislative assemblies or city councils) is designated by the party’s quotient. This value
is obtained by dividing the number of votes for each party or coalition by the electoral quotient, con-
sidering just integers and ignoring decimals with the minimum necessary number being 1. If seats are
vacant due to the ignoring of the decimals, they will be apportioned one by one by calculating averag-
es, in which the total votes of a party or coalition which has obtained seats is divided by the number of
seats obtained plus 1. The party or coalition that obtains the largest average will be awarded one of the
vacant seats. This procedure is repeated until all of the seats have been occupied (TSE, 2017).
Once the electoral quotients and party quotients have been defined and the average calcula-
tion has been made, the votes for slates and coalitions are ignored and each party or coalition will fill in
the seats to which it has a right with its candidates which have individually received the largest number
of votes. Thus, candidates of parties or coalitions which have more seats will have greater chances of
being elected compared to those belonging to parties and coalitions which have received fewer seats,
even though individually the candidate may have obtained a larger number of votes (TSE, 2017). To
sum up, in accordance with this dynamic and considering the number of inhabitants of each Brazilian
state and the Federal District, the composition of the House of Representatives is depicted in Figure 1.
Figure 1: Number of Representatives per State
Source: Adapted from the House of Representatives (2017)
Rev. Adm. UFSM, Santa Maria, v. 14, n. 2, April-June, p. 297-314, 2021
- 301 -2.4 Municipal Human Development Index (MHDI)
The Municipal Human Development Index (MHDI) consists of a number ranging from 0 to 1. In
this case, the closer it is to 1, the greater human development is. This indicator considers three dimen-
sions already measured by the Global Human Development Index: longevity, education and income, but
has been adapted to the Brazilian context and indicators. The importance of MHDI is that it: (1) popular-
izes the concept of development based on people, in contrast to GDP, whose development is limited to
economic growth; (2) makes it possible to compare municipalities in a synthetic manner using a single
number; (3) encourages placing a priority on improving the lives of people (Atlas Brasil, 2017).
In this sense, the indicators taken into consideration in the MHDI are more appropriate for
analyzing the development of the municipalities and metropolitan regions of Brazil. The Longevity
MHDI, the Education MDHI, and the Income MHDI tell the story of these municipalities, states and
metropolitan regions in three dimensions of human development (Atlas Brasil, 2017), and also make
it possible to create a panorama of the locations under examination.
The Longevity MHDI calculation is measured by life expectancy at birth, calculated by the
indirect method, based on Demographic Census data from the IBGE. This indicator shows the average
life expectancy of a person in a given municipality at birth, maintaining the same patterns of mortality.
To calculate the Education MHDI, two indicators are considered, the education of the adult population
and the educational flux of the young population. Income HDMI is calculated based on the municipal
income per capita and includes the sum of the income of all of its residents, divided by the number of
people who live in the municipality – including children and those without income (Atlas Brasil, 2017).
2.5 Gross Domestic Product (GDP) per capita
The Gross Domestic Product (PIB) consists of the most used measurement of a country’s
total production during a given period of time (ADVFN, 2017; Gomes, 2012; Brasil, 2014). The cor-
rect evaluation of GDP, therefore, makes it possible to understand economic activity and the level of
wealth which is being produced by a country, state, municipality or region.
The GDP corresponds to a monetary value and the calculation of these values consists of
the sum of finished goods and services in the production chain, excluding all the intermediate inputs
such as raw materials, labor, taxes and energy, in order to avoid the double counting of values gen-
erated in the production chain, which may cause an error in the calculation of GDP (ADVFN, 2017;
Gomes, 2012). In Brazil, since the year 1990, the GDP has been calculated by the Brazilian Institute
of Geography and Statistics – IBGE, a federal body within the Treasury Ministry (ADVFN, 2017).
In technical terms, the value of GDP may be obtained from three points of view, namely: (a)
production: where this value is found through the sum of the gross added value of each economic
activity; (b) expenses: where GDP is the sum of a group of components which correspond to a relevant
macroeconomic variable; (c) income: this could be disaggregated salaries (or income) from work and
the gross value spent on exploration (or income from other productive factors which do not consist of
work) (Gomes, 2012). In any event, the value of GDP cannot be altered due to the methodology used
in the calculation, given that the three methods should present the same result (ADVFN, 2017).
GDP per capita is the quotient between GDP and the population, calculated by dividing to-
tal GDP by the number of inhabitants in the analyzed location. This indicator was the first to be used
to analyze the quality of life in a country, and therefore, a high GDP value does not guarantee that
GDP per capita is also high, given that the distribution of GDP among many inhabitants will result in
a low GDP. Thus, GDP per capita is not a measure of personal income, nor does it consider the level
of equality of social income (ADVFN, 2017).
Rev. Adm. UFSM, Santa Maria, v. 14, n. 2, April-June, p. 297-314, 2021
- 302 -Even though GDP is a good indicator of growth in a location, it cannot be considered a growth
index, given that it does not include data such as income distribution, life expectancy, and educational level,
among others (ADVFN, 2017). It is in this sense that we have the possibility of establishing cross-references
between various indices as a way to promote the discussion proposed at the beginning of this study.
3 METHODOLOGICAL PROCEDURES
Based on the discussions presented here, it should be noted that this study seeks to apply quan-
titative research techniques to achieve our proposed objective and validate the obtained results. Thus,
we have used secondary data obtained from the NGO Transparência Brasil – the Legislator (Excelências)
Project to exclusively analyze the performance of the congressmen in the House of Representatives. The
data used is related to legislative productivity, citations in courts, and absences from legislative sessions,
which we use to analyze the performance of representatives comparing these statistics to the develop-
ment indices of Brazilian states in order to understand the relationships between these aspects.
To analyze the data that makes up this study, we have used a multivariate exploratory tech-
nique called cluster analysis. Thus, we have sought to group the Brazilian states and the Federal District
in accordance with the performance of the congressmen who represent these regions in the House of
Representatives. The selected cluster analysis is non-hierarchical and is termed K-means which is pro-
vided by the SPSS software. For this analysis technique, the data is divided into homogeneous groups
called clusters, in accordance with their similarities in terms of the variables that compose this analysis.
In this way, the elements that make up the same cluster will be as similar as possible.
Meanwhile the similarity between the elements that make up different clusters will be as small as
possible. “K” is a number of clusters which is previously determined. By K-means, each generated
cluster will result from the union of data which has the closest centroid. Centroids are average values
contained in each of the cluster variables. The final centroids are obtained based on iteration until
there are no more alterations in the averages (Hair, Anderson, Tatham & Black, 2005).
3.1 Data population, collection and analysis
3.1.1 The Legislator Project
Transparency Brazil is a non-profit entity which monitors the government in the search for
an independent form of transparency. One of its main objectives is to offer tools so that society can
monitor public institutions through projects which make public access information available on the
internet. During the realization of this study, there were three active projects in Transparency Brazil,
namely: The Clarity (Às Claras) Project, the Justice (Meritíssimos) Project and the Legislator (Excelên-
cias) Project (Transparência Brasil, 2017).
This article uses data available in the Legislator Project, which presents data regarding con-
gressmen who are currently in office in both houses of Congress: The Senate and the House of
Representatives. This project presents the life story of each of these congressmen, including current
lawsuits, fines that they have received from the Accounting Courts, declarations of assets, patterns
of electoral financing, frequency of work, etc. (Transparência Brasil, 2017).
The data is collected by each legislative house, judicial bodies, the Accounting Courts and
the Clarity Project, which is also maintained by the Transparency Brazil portal, which makes infor-
mation available to ensure the integrity of government, especially in regard to corruption, and also
focuses attention on themes related to corruption and the integrity of institutions through its partic-
ipation in Transparency Boards, media participation and data research and publication.
Rev. Adm. UFSM, Santa Maria, v. 14, n. 2, April-June, p. 297-314, 2021
- 303 -Given the available data, it is possible to use the entire population of our object of study and
not just a sample. For each state and the Federal District, we considered the following variables: the to-
tal number of representatives, the number of representatives that have occurrences in court (ongoing
lawsuits or fines from the Accounting Courts), the number of absences from legislative sessions, the
number of relevant proposals presented, and the number of irrelevant proposals presented (Box 1).
According to the Legislator Project, proposals “that are without relevance are: homages,
naming of streets, dedication ceremonies, etc.; symbology; city symbols; twin cities; requests to open
solemn sessions for commemoration and homage; commemorative dates, and the creation of honors”.
Proposals which are unreasonable or have a negative impact are not necessarily irrelevant. In fact, they
may be especially relevant because they generate a negative impact (Transparência Brasil, 2017).
In relation to absences, the Federal Constitution in Article 55, Item III, establishes that any
congressman who does not attend a third of the normal sessions1 of each legislative session of the
member’s house will lose his or her mandate. However, according to the Legislator Project, it is
common for congressmen to justify their absences due to illness or obligations inherent to their
duties. To clarify, this study does not consider absences from commission sessions, because not all
congressmen are members of a commission.
Box 1 – Court Occurrences, Number of Relevant Proposals Presented, Number of Irrelevant Proposals Presented,
Proportion of Absences in Legislative Sessions
Source: Adapted from Transparency Brazil (2017)
1 The legislative session corresponds to the period of Congress’s activity during the year: February 2 to July 17 and August 1 to December 22.
Rev. Adm. UFSM, Santa Maria, v. 14, n. 2, April-June, p. 297-314, 2021
- 304 -3.2 Treatment of the data
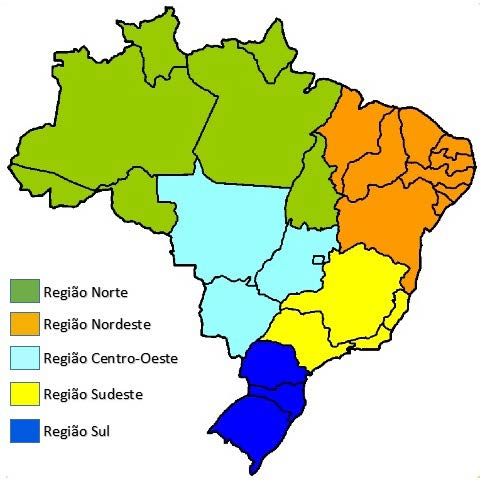
We have opted to define the K number of clusters as 5 (five), due to the criterion that Brazil is di-
vided into five geographic regions: North, Northeast, Central West, Southeast and South. Thus, based on the
obtained results, it will be possible to compare the geographic regions. For the analyses, we opted for classi-
fications based on 10 iterations with the criterion of 0 convergence, without using averages in the execution.
Box 2 presents the initial centers of each cluster, which are the values of the variables used
by cases which are considered to be at the center of each cluster. Thus, the initial center of Cluster
1 is formed exclusively by the State of São Paulo. The initial center of Cluster 2 is the State of Pará.
Cluster 3’s initial center is the State of Rio de Janeiro, while Cluster 4’s initial center is the State of
Alagoas. Finally, the State of Paraná is the center of Cluster 5. To better visualize the presented data,
the states analyzed were grouped as displayed in Figure 2.
Box 2 – Centers of Initial Clusters
Source: Research data
Figure 2 – Clusters of States
Source: Research data
With the center of each cluster determined, each case was directed to the cluster whose
center was closest to it. This initiated a process of iteration. In this process, each case was reallocat-
ed depending on its distance from the newly calculated center, and so on successively. With each
iteration, the movement of the centers decreased until the optimum result was achieved when all
the values arrived at the value of the established convergence. In this study, even though we initially
opted for 10 iterations, we arrived at the optimal result in just 2 iterations with convergence values
of 0, as can be seen in Box 3 below.
Box 3 – Iteration Historya
a. Convergence achieved due to no changes or small changes in cluster centers. The change in the coordinated absolute
maximum for any center is .000. The current iteration is 2. The minimum distance between the initial centers was 221.373.
Source: Research data
Rev. Adm. UFSM, Santa Maria, v. 14, n. 2, April-June, p. 297-314, 2021
- 305 -Box 4 displays a list of all the cases used in the analysis, indicating the cluster in which each case
was classified and the distance between the cluster center, which, in turn, was the origin of Figure 2.
Box 4 – Cluster Association
Source: Research data
Box 5 presents the cluster centers after the iterative update process. This box makes it eas-
ier to interpret the composition of the clusters by presenting the central values of the variables used
to form the clusters. If we compare this with Box 2 (Centers of Initial Clusters), we may observe that
only Cluster 1 did not suffer alterations, because it is composed exclusively of the case of the State
of São Paulo.
Box 5 – Centers of the Final Clusters
Source: Research data
For the distance between the centers of the final clusters, we observe that the clusters
which are most similar to each other are Clusters 2 and 4, and the ones that are most different are
Clusters 1 and 4, as can be seen in Box 6.
Rev. Adm. UFSM, Santa Maria, v. 14, n. 2, April-June, p. 297-314, 2021
- 306 -Box 6 – Distances between Centers of Final Clusters
Source: Research data
Box 7 presents the results of our dispersion analysis. Column F allows us to extract general
conclusions about the influence of the variables on the formation of the clusters. We were therefore
able to verify that the number of relevant proposals presented by Representatives was the variable
that exerted the greatest influence on the formation of clusters and absences exerted the smallest
influence.
Box 7 – ANOVA
The F tests should be used just for descriptive purposes because the clusters were chosen to maximize the differences
between cases in different clusters. The levels of significance observed are not corrected for this, thus they cannot be
interpreted as tests of the hypothesis that the cluster means are equal.
Source: Research data
Box 8 presents data relating to the number of cases in each cluster and shows that all of the
cases analyzed were valid and, therefore, no case was omitted.
Box 8 – Number of Cases in Each Cluster
Source: Research data
In sum, the data presented here beforehand ratified the viability of the performed cross-ref-
erences. In this sense, we will next present the analyses and discussion regarding the investigated data.
Rev. Adm. UFSM, Santa Maria, v. 14, n. 2, April-June, p. 297-314, 2021
- 307 -4. ANALYSES AND DISCUSSION
This study seeks to analyze the performance of Representatives in Congress, comparing them
with the development indices for Brazilian states, in order to understand if there is a relationship between
political performance and the Municipal Human Development Index (MHDI) and Gross Domestic Product
(GDP) per capita for the represented states. Thus, each of these states was classified using the non-hier-
archical K-means cluster analysis technique which makes it possible to group the states with the greatest
similarities, in terms of the performance of their Representatives in Congress, within the same cluster.
Based on the obtained clusters, we have sought to verify whether the states that belong
to the same cluster have similarities in relation to GDP per capita, MHDI and the geographic region
that they occupy. The results of the analysis demonstrate that there is not necessarily a relationship
between the performance of Representatives in Congress and the other observed aspects.
Cluster 1 consisted exclusively of the State of São Paulo, located in the Southeast region,
which occupies second place in GDP per capita as well as MHDI. São Paulo is the most populous state
in Brazil and for this reason it has the maximum number of Representatives allowed by law, which is 70,
while Minas Gerais, the state in second place, has 53 or 17 fewer. Thus, it is natural that the State of São
Paulo occupies a differentiated position due to its having the largest number of members in the House
of Representatives. In addition, the performance of its members is consistent to a certain extent with
the state’s MHDI and GDP per capita indices, with the state ranking second in both aspects.
Cluster 2 (Figure 3) is the most diverse in terms of the characteristics observed for the states
that make it up. It includes Ceará, Maranhão, Paraíba, and Sergipe, located in the Northeast, and Pará,
located in the North; these states occupy the lowest positions in terms of GDP and MHDI. Paradoxical-
ly the Federal District is also in this cluster. It is located in the Central West region and has a series of
unique characteristics. The large number of public positions available due to the Brazil’s capital Brasilia
and the headquarters of the three branches of government (Executive, Legislative and Judicial) as well
as foreign embassies, leads to its occupying first place in terms of GDP per capita and the MHDI. Also
appearing in this cluster is Goiás, which is also located in the Central West region, and Espírito Santo,
located in the Southeast, which are both well positioned in the GDP per capita and MHDI rankings.
Figure 3 – MHDI and GDP per Capita Rankings for Cluster 2
Source: Research data
The third cluster is made up of just two states: Minas Gerais and Rio de Janeiro, located in the
Southeast region, which are the second and third most represented states in the House of Represent-
atives. In terms of MHDI, Rio de Janeiro is in 6th position in the national ranking while Minas Gerais is
in 8th. In terms of GDP per capita, the disparity between these states is a little greater, given that Rio de
Janeiro is in 3rd place in the national raking, while Minas Gerais is in 11th, in accordance with Figure 4.
Rev. Adm. UFSM, Santa Maria, v. 14, n. 2, April-June, p. 297-314, 2021
- 308 -Figure 4 – MHDI and GDP per capita Rankings for Cluster 3
Source: Research data
Cluster 4 is the one with the largest number of states, and it is made up of Mato Grosso do
Sul from the Central West region, which is the highest in terms of MHDI and GDP per capita, occupy-
ing the 10th and 9th positions in the national ranking; and Piaui and Alagoas, located in the Northeast
region, which occupy the 25th and 27th positions in MHDI and the 27th and 25th positions respectively
in terms of GDP per capita. This cluster also contains all of the states in the North region except Pará.
Amazonas, Tocantins, Acre, Roraima, Amapá and Rondônia are close to each other in the GDP per
capita ranking. In terms of the MHDI raking, the State of Amazonas appears a little lower than the
others, occupying the 20th position (Figure 5).
Figure 5 – MHDI and GDP per Capita Rankings for Cluster 4
Source: Research data
Cluster 5, in turn, is made up of the three states in the South region, Rio Grande do Sul,
Paraná and Santa Catarina, which are also close in terms of the positions they occupy in the national
rankings for MDHI and GDP per capita; the State of Mato Grosso, located in the Central West re-
gion, close to the states of the South region in terms of its positions in the national rankings for the
MHDI and GDP per capita; and finally, the States of Bahia and Pernambuco, located in the Northeast
region, are also close to each other in the MHDI and GDP per capita rankings, but distant from the
other states that make up this cluster (Figure 6).
Rev. Adm. UFSM, Santa Maria, v. 14, n. 2, April-June, p. 297-314, 2021
- 309 -Figure 6 – MHDI and GDP per Capita Rankings for Cluster 5
Source: Research data
Finally, Figure 7 presents the configuration of Brazilian territory based on the obtained
clusters as compared to the geographic regions the country is divided into.
Figure 7 – Configurations Based on Clusters and Regions
Source: Research data
Based on the images in Figure 7, we can verify that the division of the states in clusters
based on the performance of the Representatives in Congress who represent them and the MHDI
and GDP per capita indices, reveals a certain discrepancy in relation to the Brazilian geographical
regions, given that states in different regions are similar in terms of their particular features, congru-
encies, and discrepancies in terms of the analyzed aspects.
5. FINAL CONSIDERATIONS
Given the necessity to stimulate awareness of democratic processes, this study has sought
to analyze the performance of Representatives of the House, comparing the indices of the devel-
opment of Brazilian states to understand whether there is a relationship between political perfor-
mance and the Municipal Human Development Index (MHDI) and Gross Domestic Product (GDP) per
capita in the states they represent.
Rev. Adm. UFSM, Santa Maria, v. 14, n. 2, April-June, p. 297-314, 2021
- 310 -In broad terms, this study has made it possible to perceive that instruments like the Legis-
lator Project, the source of this study, are of great importance in having access to information about
our legislators. As a democratic exercise, having this information available gives the population visi-
bility and enables it to monitor the work of those who have been elected to represent it, reinforcing
the idea of representative democracy ensured by the Federal Constitution. This statement is rein-
forced by the fact that the project makes it possible to access this data in a broad manner, and above
all, to analyze this based on academic perspectives, in accordance with the work realized here.
Overall, the data makes it possible to group through clusters those representatives who
have similar performance. To accomplish this, we have considered the total number of Representa-
tives in the House; the number of representatives with occurrences in court and/or the Accounting
Courts; the proportion of absences in legislative sessions; the number of relevant proposals present-
ed; and the number of irrelevant proposals presented. The representative profiles made the clusters
extrapolate their geographic frontiers and approximate states in the most diverse regions. It was in
this sense, for example, that the performance of congressmen in states in the South was similar to
those from the states of Mato Grosso, Bahia and Pernambuco, which make up Cluster 5. A similar
situation occurred in others states that make up Clusters 2 and 4.
Even though they drew closer, however, it was possible to observe that there were consid-
erable discrepancies within the same cluster in terms of the position of each state grouped by the
national rankings for MHDI and GDP per capita. Looking at Cluster 5 again, despite the similarities in
the performance of the Representatives in the House, the cluster includes the 4th (Paraná) and 24th
(Bahia) states in the MHDI ranking, and the 4th (Santa Catarina) and 22nd (Bahia) states in the GDP per
capita ranking. It should be noted that this discrepancy can also be observed in other clusters with
greater numbers of states (2 and 4).
In a certain manner, this information makes it possible to perceive that there is no relation-
ship of equivalence between the performance of Representatives in the House and the development
indices observed in this study (MHDI and GDP per capita). Even though democracy is a political
regime that tends to satisfy the expectations of its citizens in a direct or indirect manner through
elected representatives, as is true of the Representatives of the House, we have verified that it is still
fragile within the national scenario (Moises, 2010).
Corroborating the idea of Lordêlo and Pontes (2009), to the extent that social demands in-
crease with the consequences of globalization and the advance of the world economy, we can observe
that representatives elected by the population have greater difficulties in meeting them in a satisfacto-
ry manner. However, it is believed that the ethical and efficient performance of political agents can al-
ways contribute significantly to modify the situation in which the states find themselves. To accomplish
this, the indices of human and economic development should be not just be present in the discourses
of our elected representatives, they should above all be present in their actions.
Overall, this is an initial study which is not intended to exhaust this subject. The researched
data, or even the identification of transparency actions, demonstrates the wide variety of analysis
possibilities that are available in terms of discussions of the performance of political agents and their
respective returns for the population. In this sense, we would suggest that future studies can use
data from other Transparency Brazil projects (2017), or other reports displayed in the transparency
portals of various spheres of government. Other research possibilities can be developed based on
qualitative analyses of the effective representativity of the projects proposed by these representa-
tives of the people.
Rev. Adm. UFSM, Santa Maria, v. 14, n. 2, April-June, p. 297-314, 2021
- 311 -REFERENCES
ADVFN - Advanced Financial Network. (2017). Indicadores Econômicos: PIB. Retrived from http://
br.advfn.com/indicadores/pib.
Atlas Brasil. (2013). O IDHM. Retrived from http://www.atlasbrasil.org.br/2013/pt/o_atlas/idhm/.
Atlas Brasil. (2013). Radar IDHM. Retrived from http://www.atlasbrasil.org.br/2013/pt/radar-idhm.
Baptista, A. (2010). Democracia e representação democrática. Análise Social, 45(196), 491-514.
Retrived from http://www.jstor.org/stable/41012814.
Barrueto, F., & N., Patricio. (2013). Tipologías de democracia representativa en América Latina. Política
y gobierno, 20(2), 265-307. Retrived from http://www.scielo.org.mx/scielo.php?script=sci_
arttext&pid=S1665-20372013000200002&lng=es&tlng=es.
Bobbio, N. (2000). Teoria geral da política: a filosofia política e as lições dos clássicos (M. Bovero.
Org. D. B. Versiani. Trad.). Rio de Janeiro: Campus.
Bobbio, N., Matteucci, N., & Pasquino, G. (1998). Dicionário de política. (V.1. 12a ed, Carmen C,
Varriale, et al. Trad., J. Ferreira. Coord. trad., J. F.erreira e L. G. P. Cacais. Rev. Geral).Brasília:
Editora Universidade de Brasília.
Brasil. (2017). Câmara dos Deputados. Retrived from http://www2.camara.leg.br/deputados/
pesquisa.
Brasil. (1988). Constituição da República Federativa do Brasil. Retrived from http://www.planalto.
gov.br/ccivil_03/constituicao/constituicao.htm.
Brasil. (1993). Lei Complementar n. 78. Retrived from http://www.planalto.gov.br/ccivil_03/leis/
LCP/Lcp78.htm.
Cheibub, J. A, & Przeworski, A. (1997). Democracia, Eleições e Responsabilidade Política. Revista
Brasileira de Ciências Sociais, 12(35) https://doi.org/10.1590/S0102-69091997000300004.
Corval, P. R. dos S. (2015) Democracia representativa: revisitando John Stuart Mill. Revista de
Informação Legislativa. 52(206), 245-270. Retrived from https://www12.senado.leg.br/ril/
edicoes/52/206/ril_v52_n206_p245.
Fávero, L. P. L., Befiore, P. P., Silva, F. L. da, & Chan, B. L. (2009). Análise de dados: modelagem
multivariada para tomada de decisões. Rio de Janeiro: Campus Elsevier.
Figueiredo, D. B., Filho, Silva, J. A. da, Junior, & Rocha, E. do, C. da. (2012). Classificando regimes
políticos utilizando análise de conglomerados. Opinião Pública, 18(1), 109-128. Retrived from
https://doi.org/10.1590/S0104-62762012000100006.
Gomes, O. (2012). Macroeconomia: Noções básicas. ISCAL - Materiais Pedagógicos, Retrived from
http://hdl.handle.net/10400.21/1186.
Guidini, M. B., Nascimento, A. M., Bone, R. B., & Alves, T. W. (2008). Aplicação do K-means cluster
para a classificação de estilos gerenciais. Contextus – Revista Contemporânea de Economia e
Gestão, 6(2), 25-34. Retrived from de https://doi.org/10.19094/contextus.v6i2.32097.
Rev. Adm. UFSM, Santa Maria, v. 14, n. 2, April-June, p. 297-314, 2021
- 312 -Hair, J. F., Junior, Anderson, R. E., Tatham, R. L., & Black, W. C. (2005). Análise multivariada de dados.
(5a ed, A. S. Sant’Anna & A. Chaves Neto. Trad.). Porto Alegre: Bookman.
Inglehart, R. (2003). How Solid is Mass Support for Democracy – And How Can We Measure It. Political
Science & Politics, 36(1), 51-57. Retrived from https://doi.org/10.1017/S1049096503001689.
Lordêlo, J. A. C.; & Pontes, M. (2009). Poder, representação, participação, conhecimento e decisão:
a CPA da UFBA. In. J. A. C. Lordêlo & V. DAZZANI. Avaliação educacional: desatando nós.
Salvador: EDUFBA.
Locke, J. (1973). Coleção Os Pensadores. São Paulo: Abril Cultual.
Manly, B, J. F. (2008). Métodos estatísticos multivariados: uma introdução. Porto Alegre: Bookman.
Mill, J. S. (2006). Considerações sobre o governo representativo. São Paulo: Escala.
Moisés, J. A. (2010). Os significados da democracia segundo os brasileiros. Opinião Pública, 16(2),
269-309. Retrived from https://doi.org/10.1590/S0104-62762010000200001.
Moori, R. G., Marcondes, R. C., & Ávila, R. T. (2002). A análise de agrupamentos como
instrumento de apoio à melhoria da qualidade dos serviços aos clientes. Revista de
Administração Contemporânea, 6(1), 63-84. Retrived from https://doi.org/10.1590/S1415-
65552002000100005.
Nunes, A., & Barros, E. (2010). Caracterização territorial do desemprego registado em Portugal:
aplicação da análise de clusters. Economia Global e Gestão. XV(3), 9-26. Retrived from http://
hdl.handle.net/10198/4184.
Seidel, E., Moreira, F., Júnior, Ansuj, A., & Coradini Noal, M. (2008). Comparação Entre o Método
Ward e o Método k-médias no Agrupamento de Produtores de Leite. Ciência e Natura, 30(1),
07-15. Retrived from https://doi.org/10.5902/2179460X9737.
Transparência Brasil. (2017). Projeto Excelências. Retrived from http://www.excelencias.org.br/.
TSE - Tribunal Superior Eleitoral (2017). Quociente Eleitoral: candidato a deputado mais votado nem
sempre é eleito. Retrived from http://www.tse.jus.br/imprensa/noticias-tse/2014/Fevereiro/
quociente-eleitoral-candi dato-a-deputado-mais-votado-nem-sempre-e-eleito.
Urbinati, N. (2006). Representative Democracy: Principles and Genealogy, Chicago: Chicago
University Press.
Villas Bôas, O., Filho. (2010). Democracia: estado idílico da política? Revista Brasileira de Ciências
Sociais, 25(74), 183-186. Retrived from https://doi.org/10.1590/S0102-69092010000300013.
Weber, M. (1993). Conferência sobre o socialismo. In: Fridman, L. C. (org.). Émile Durkheim e Max
Weber: socialismo. (pp.87-128). Rio de Janeiro: Relume Dumará.
YoshimiTanaka, O., Drumond, M., Junior, Cristo, E. B, Spedo, S. M., & Pinto, N. R. da S. (2015). Uso
da análise de clusters como ferramenta de apoio à gestão no SUS. Saúde e Sociedade, 24(1),
34-45. Retrived from https://doi.org/10.1590/S0104-12902015000100003.
Rev. Adm. UFSM, Santa Maria, v. 14, n. 2, April-June, p. 297-314, 2021
- 313 -AUTHORS
1. Liliane Teixeira
Master of Administrative Science from Universidade Tecnológica Federal do Paraná - UTFPR
E-mail: lilianetxr@gmail.com
ORCID: https://orcid.org/0000-0002-8805-5115
2. Ellen Corrêa Wandembruck Lago
Master in Administrative Science from Universidade Tecnológica Federal do Paraná – UTFPR. Doctoral Student
in Planing and Public Governance from Universidade Tecnológica Federal do Paraná – UTFPR
E-mail: ellencwlago@hotmail.com
ORCID: https://orcid.org/0000-0001-5378-2454
3. Leonardo Tonon
PhD in Administration from Universidade Federal do Rio Grande do Sul. Professor at Universidade Tecnológica
Federal do Paraná – UTFPR.
E-mail: leonardotonon@utfpr.edu.br
ORCID: https://orcid.org/0000-0002-9884-5284
Contribution of authors
Contribution [Author 1] [Author 2] [Author 3]
1. Definition of research problem X
2. Development of hypotheses or research questions X
(empirical studies)
3. Development of theoretical propositions (theoretical work) X
4. Theoretical foundation / Literature review X X X
5. Definition of methodological procedures X X
6. Data collection X X
7. Statistical analysis X
8. Analysis and interpretation of data X X
9. Critical revision of the manuscript X X
10. Manuscript writing X X X
11. Other (please specify)
Conflict of Interest
The authors have stated that there is no conflict of interest.
Copyrights
ReA/UFSM owns the copyright to this content.
Plagiarism Check
The ReA/UFSM maintains the practice of submitting all documents approved for publication to the plagiarism
check, using specific tools, e.g.: CopySpider.
Rev. Adm. UFSM, Santa Maria, v. 14, n. 2, April-June, p. 297-314, 2021
- 314 -You can also read