RESEARCH Educational Program Report - transforming the classroom environment in struggling schools through to educate all children (TEACH), 2019-2020

Page created by Holly Flores
 
CONTINUE READING
RESEARCH Educational Program Report - transforming the classroom environment in struggling schools through to educate all children (TEACH), 2019-2020
Houston   Independent    School    District

                   RESEARCHEducational Program Report

           transforming the classroom environment
          in struggling schools through to educate
                      all children (TEACH), 2019-2020
RESEARCH Educational Program Report - transforming the classroom environment in struggling schools through to educate all children (TEACH), 2019-2020
2020 Board of Education

                                                             Susan Deigaard
                                                             President

                                                             Wanda Adams
                                                             First Vice President

                                                             Judith Cruz
                                                             Second Vice President

                                                             Patricia Allen
                                                             Secretary

                                                             Daniela Hernandez
                                                             Assistant Secretary

                                                             Katherine Blueford-Daniels
                                                             Holly Maria Flynn Vilaseca
                                                             Elizabeth Santos
                                                             Anne Sung

                                                             Grenita Lathan, Ph.D.
                                                             Interim Superintendent of Schools

                                                             Allison Matney, Ed.D.
                                                             Officer
                                                             Department of Research and Accountability

                                                             Venita Holmes, Dr.P.H.
                                                             Research Manager

Houston Independent School District
Hattie Mae White Educational Support Center
4400 West 18th StreetHouston, Texas 77092-8501

www.HoustonISD.org

It is the policy of the Houston Independent School
District not to discriminate on the basis of age, color,
handicap or disability, ancestry, national origin,
marital status, race, religion, sex, veteran status,
political affiliation, sexual orientation, gender identity
and/or gender expression in its educational or
employment programs and activities.
RESEARCH Educational Program Report - transforming the classroom environment in struggling schools through to educate all children (TEACH), 2019-2020
EVALUATION REPORT
                            BUREAU OF PROGRAM EVALUATION

Transforming the Classroom Environment in Struggling Schools through To Educate All Children
(TEACH), 2019–2020

Prepared by Venita R. Holmes, Dr.P.H.
Abstract
This program evaluation assessed teachers’ perceptions of TEACH and students’ distal educational outcomes,
including reading, mathematics, attendance, and disciplinary actions over a two-year period. The targeted population
was comprised of teachers and students at 25 schools in the Houston Independent School District (HISD) during the
2018–2019 academic year. Among the 68 teachers who responded to a survey on TEACH processes, an overwhelming
majority indicated that the coaching was helpful. Teachers considered the program effective and beneficial toward
managing the classroom environment. On the End-of-Year Survey, most of the 98 teachers were in agreement that
TEACH strategies can be adapted to their teaching style and that transitions are smoother between activities
when using TEACH. On the combined English and Spanish STAAR grades 3–8 reading and mathematics tests, the
majority of TEACH elementary campuses showed increases in the percentage of students who scored at or above the
Approaches Grade Level standard, while the majority of middle schools had a decrease in reading and an increase
in mathematics performance from spring 2018 to spring 2019. High schools and the Secondary DAEP mostly
showed an increase or no change in students’ performance on the English I EOC exam, while all schools showed
an increase in the percentage of students who scored at or above this standard on the Algebra I EOC exam. Paired
t-test analyses revealed gains in the mean attendance rates at 73.3% of TEACH elementary campuses and a slight
increase at one TEACH middle school from 2018 to 2019. Taking into account all TEACH campuses, the percentage
of students with no in-school suspensions moderately increased, while the percentage of students with no out-of-school
suspensions slightly decreased. More intensive support may be needed, particularly at secondary campuses with
large numbers of struggling students, to ensure that maximum benefits of program participation are demonstrated.

Background                                                    deliver classroom management strategies through
      Classroom management is predicated on positive          campus leadership support, school staff training, parent
student-teacher relationships, which are essential toward     workshops, videos, and teacher coaching (Figure 1).
creating a highly successful community of learners            Campus leadership support consisted of intensive
(Wolk, 2003). Ineffective classroom management may
lead to exclusionary disciplinary practices that remove
students from classroom learning time, limit their ability             Campus
                                                                                                      School Staff
                                                                      Leadership
to build positive relationships with teachers, and increase            Support                         Training

risks for school dropout and entry into the juvenile
justice system (Bradshaw, O’Brennan, & McNeely,
2008; Fabelo et al., 2011; Bradshaw et al., 2018).
The moral, social, and psychological development
of youth may be challenged when they are excluded                 Parent                                     Teacher
from school along with their ability to gain careers             Workshops                                   Coaching
and pursue healthy lifestyles (Farn & Adams, 2016).
      To Educate All Children (TEACH) was founded
on the premise that healthy, safe, and calm classrooms
are essential for student learning. Consequently, the
                                                                                        Videos
Houston Independent School District (HISD) has
implemented TEACH for more than 10 years to                   Figure 1: The TEACH Model, 2018–2019

                                                                                                                         1
RESEARCH Educational Program Report - transforming the classroom environment in struggling schools through to educate all children (TEACH), 2019-2020
during the 2018–2019 academic year. Moreover, the evaluation
                                                                     assessed teachers’ perceptions of the program toward transforming
                                                                     the classroom environment during the current year. The research
                                                                     questions are as follows.

                                                                     Research Questions:
                                                                     1. What were the perceptions of teachers regarding TEACH
                                                                     processes and the extent that the program was beneficial toward
                                                                     managing the classroom environment?
                                                                     2. What was the performance of students at TEACH campuses on
                                                                     the reading and mathematics state assessments in 2019 compared
                                                                     to 2018?
                                                                     3. What was the impact of TEACH on students’ attendance and
                                                                     behavior during the 2018–2019 school year, considering previous
                                                                     year’s outcomes?
 Figure 2: TEACH Educational Coach providing one-on-one written
 feedback                                                                 There were several limitations to the study. It was not known
                                                                     whether teachers who completed the Process and End-of-Year sur-
                                                                     veys had direct exposure to TEACH professional development.
                                                                     However, all teachers and administrators participated in an initial
                                                                     six-hour training on TEACH practices and approximately, 20%
                                                                     to 30% of teachers and administrators participated in real-time,
                                                                     one-on-one coaching. In addition, teacher participation in surveys
                                                                     was voluntary. This may have resulted in selection bias due to the
                                                                     underrepresentation of educators of students in specific subgroups
                                                                     of the population who may have been more influenced by TEACH
                                                                     practices.

                                                                     Review of the Literature
                                                                           African American students are more likely to experience
                                                                     exclusionary discipline in elementary and secondary schools
                                                                     compared to their peers, while Latino and Native American
 Figure 3: TEACH Educational Coach sharing real-time feedback        secondary school students also experience disproportionately
                                                                     high rates of exclusionary discipline compared to White students
training and coaching to help school leaders implement the           (Losen, Hodson, Ee, & Martinez, 2015; Losen, Hodson, Keith,
TEACH curriculum. School staff training provided small-group          Morrison, & Belway, 2015). To offset these disparities, the research
sessions to expose teachers to practical classroom management        has shown that creating a positive classroom environment fosters
strategies. Workshops educated parents on TEACH skills and           essential developmental skills in students, such as acceptance
trained them on how to transfer acquired skills from school to       and determination, to be successful in academic areas and in
the home environment. The latest video technology was used           future careers (Corradino & Fogarty, 2016). Positive classroom
to record and replay coaching sessions. Teachers were provided       environments require the implementation of a continuum of
an individual coach to help them implement new skills at their       classroom management strategies by teachers (Jones, Jones, &
own pace in their classrooms (TEACH, n.d., Figures 2 and 3).         Vermete, 2013), including subtle redirections, non-verbal prompts,
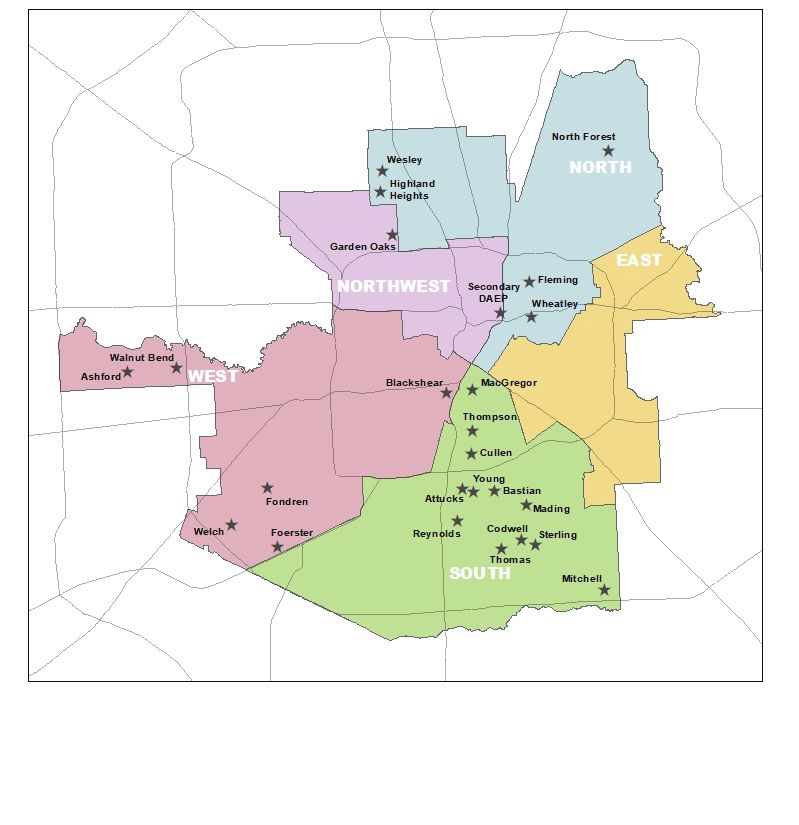
      During the 2018–2019 academic year, TEACH was                  and proximity (Larrivee, 2009; Kellogg & Lawson, 1993).
implemented in 25 HISD schools, including 15 elementary/K–8                A randomized-controlled trial conducted by Bradshaw
schools and 10 secondary schools (Appendix A, Table 1, p. 9). The    et al. (2018) found that coaching and ongoing support and
schools were predominately located in the southern geographical      professional development helped teachers adopt culturally-
area of Houston (Appendix B, p., 10) where the need for additional   responsive classroom management practices using a structured
strategies to improve academic learning among struggling students    problem-solving approach. The study documented significantly
was in high demand. This was an expansion of TEACH from 14           more proactive behavior management practices, anticipation of
elementary and middle schools in 2017–2018.                          student problems by teachers, higher student cooperation, and
      The total enrollment for TEACH schools in 2018–2019            fewer disruptive behaviors in classrooms led by coached teachers
was 15,113 students (Appendix C, Table 2, p. 11). The majority       relative to comparison-group teachers, particularly among African
of students were economically-disadvantaged (90.3%), African         American students. Professional development on classroom
American (56.9%), and male (52.2%). Moreover, students at            management and coaching was found to improve teachers’ ability
TEACH schools were far more likely to be African American            to transfer skills gained through these learning opportunities (Bush,
and economically disadvantaged and far less likely to be gifted/     1984; Centers for Disease Control and Prevention, 2009; Truesdale,
talented than students districtwide.                                 2003; Holland, 2005). Consequently, student achievement was
      This evaluation was designed to observe distal educational     higher in schools with strong learning communities, where
outcomes of students at campuses where TEACH was implemented         collective responsibility, collaboration and collegiality among
                                                                                                                                        2
RESEARCH Educational Program Report - transforming the classroom environment in struggling schools through to educate all children (TEACH), 2019-2020
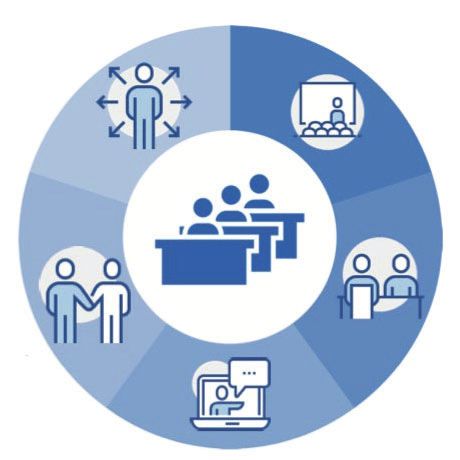
teachers were fostered (Little, 1993; Newmann & Wehlage, 1993;          dance rates. The level of statistical significance was p
RESEARCH Educational Program Report - transforming the classroom environment in struggling schools through to educate all children (TEACH), 2019-2020
TEACH Process Survey, 2018-2019

                     100                                                                                                                                      98.3            98.3
                                                                                                                               96.8            96.8
                     95                                                                     93.5            93.8
                                                                           91.4
                                                          90.5
       % Agreement

                     90
                                          85.2
                     85

                     80

                     75
                                    I am able to have TEACH sessions The amount of The strategies I am informed in          Monthly PLC Overall, I would The coaching       I welcome
                                          specific     directly reflect coaching I    used in PLC    advance when          sessions with a recommend the   feedback I     receiving real
                                       classroom or the needs of my receive is just   sessions and we are going to        TEACH trainer       TEACH         receive is   time coaching.
                                      student issues      campus.         right.       classroom      have a PLC           occur with the program to other   helpful.
                                    addressed during                                coaching closely    session.          right frequency.    teachers.
                                         TEACH                                           align.
                                         sessions.

Figure 5: Teacher Process Survey results, 2018–2019

receiving real time coaching” (98.3%) and “the coaching feedback                                              What was the performance of students at TEACH campuses
received was helpful” (98.3%). Another notable finding was                                                    on the reading and mathematics state assessments in 2019
that 93.5% of the sample perceived that “strategies used in PLC                                               compared to 2018?
sessions and classroom coaching closely align.” Moreover, 90.5%
of respondents noted that TEACH sessions directly reflect the                                                      To detect changes in students’ performance in reading and
needs of their campus. The highest level of disagreement was on                                               mathematics over time, the spring 2018 and spring 2019 combined
the survey item “I am able to have specific classroom or student                                              English and Spanish STAAR grades 3–8 tests in the content areas
issues addressed during TEACH sessions” (14.8%). Nevertheless,                                                were used for TEACH elementary, K–8, and middle schools.
96.8% of respondents indicated that they would recommend the                                                  STAAR English I EOC and Algebra I EOC exams were used to
TEACH program to other teachers.                                                                              measure the academic performance of students at TEACH high
     TEACH End-of-Year Survey results are shown in Figure 6                                                   schools and the Secondary Disciplinary Alternative Education
(Part I) and Figure 7 (Part II) for 98 respondents. The largest                                               Program (DAEP). Students’performance on the first administration
majority of respondents agreed that “TEACH strategies support                                                 of the tests based on the percent at or above Approaches Grade
and can be adapted to my personal teaching style” (95.6%) and                                                 Level standard was presented in this evaluation. The results
“transitions are smoother between activities when using TEACH                                                 can be found in Appendix E (p. 13). Changes in campus-level
strategies” (95.5%) (Figure 7a). The highest level of disagreement                                            student performance, from 2018 to 2019, are discussed below.
on the End-of-Year Survey was “Group sessions with TEACH are                                                       Figure 8 (p. 5) reflects the change in students’ reading
a good use of my time” (13.3%).                                                                               STAAR performance at TEACH elementary/K–8 campuses
     When asked what were the most helpful components                                                         from spring 2018 to spring 2019. It is evident that the majority
of TEACH, the highest percentage of respondents indicated                                                     of elementary/K–8 campuses showed increases in the percentage
“coaching” (59%). In addition, 38% of respondents replied that                                                of students at or above the Approaches Grade Level standard
“professional learning communities (PLCs)” is the most helpful                                                from 2018 to 2019 in reading and mathematics (67% and 53%,
component of TEACH.                                                                                           respectively).

                                                                                       TEACH, End-of-Year Survey, 2018-2019 (Part I)
                                    100
                                     98
                                                                                                                                                           95.5                 95.6
                                     96                                                                                                 94.3
                                                                                                                   94.2
                                     94           92.9                 93.3                 93.4
                      % Agreement

                                     92
                                     90
                                     88
                                     86
                                     84
                                     82
                                     80
                                          Because of the skills I I use many of the It is easier to gain and I believe that TEACH As a teacher, I am    Transitions are    TEACH strategies
                                          have learned through strategies I learned     maintain student strategies have made satisfied with the      smoother between support and can be
                                              TEACH, my          from TEACH every        attention using       a difference in my    professional    activities when using  adapted to my
                                            relationship with            day.         TEACH strategies.            classroom.     development I have TEACH strategies.     personal teaching
                                          students is now more                                                                      received from                                style.
                                           based on influence                                                                     TEACH this school
                                              versus power.                                                                              year.

Figure 6: Teacher End-of-Year Survey results, 2018–2019

                                                                                                                                                                                               4
100                                                       TEACH, End-of-Year Survey, 2018-2019 (Part II)
                              98
                              96
                              94
                % Agreement

                              92                                                                                                                                              90.8               90.9
                              90                                                                                                                      88.8
                                                                                                               88.2
                              88             86.7                 86.9                  87.1
                              86
                              84
                              82
                              80
                                    Group sessions with Because of the skills      With TEACH             Using TEACH             I find more time to  TEACH strategies Because of the skills I
                                    TEACH are a good      that I am learning        classroom           strategies helps me       focus on content in help me more easily have learned through
                                      use of my time.   through TEACH, it's management skills, I        better regulate my       my classroom since I manage small student    TEACH, my
                                                            increasing my       am better able to        own energy level          have started using  incidents without    relationship with
                                                            probability of      handle behavioral          throughout the        TEACH management them escalating into         students has
                                                           remaining in the      issues inside my           teaching day.              strategies.     major disciplinary       improved.
                                                        teaching profession. classroom; thereby,                                                           problems.
                                                                                   reducing my
                                                                              disciplinary referrals.

Figure 7: Teacher End-of-Year Survey results, 2018–2019

                                                     TEACH Elementary/K-8 Schools                                                                                               TEACH Middle Schools
                100                                                                                                                            100
                                                                                                                                                                         83                83
                     80                                                                                                                         80
                                        67

                                                                                                                                 Percent (%)
  Percent (%)

                     60                             53                                                                                          60

                     40                                                    33                                                                   40
                                                                    27                                                                                          17                                 17
                                                                                                        13                                      20
                     20                                                                         7                                                                                                                      -     -
                                                                                                                                                 -
                      -                                                                                                                                        Increased                   Decreased                  No Change
                                        Increased                  Decreased                   No Change
                                                            Reading      Math                                                                                                        Reading     Math

Figure 8: Changes in percent at or above Approaches Grade Level,                                                         Figure 9: Changes in percent at or above Approaches Grade Level,
TEACH elementary/K–8 schools, 2018 to 2019                                                                               TEACH middle schools, 2018 to 2019

     Figure 9 shows the change in students’ reading and
                                                                                                                                                                        TEACH High Schools/Secondary DAEP
mathematics STAAR performance at TEACH middle schools                                                                                                                100
                                                                                                                                               102
from spring 2018 to spring 2019. The majority of campuses had a
decrease in the percentage of students at or above the Approaches                                                                               82
Grade Level standard in reading (83%) and an increase in the
                                                                                                                                                62           50                                          50
                                                                                                                              Percent (%)

percentage of students at or above the standard in mathematics
over the two years (83%).                                                                                                                       42
     Figure 10 reflects the change in students’ STAAR English I                                                                                 22
and Algebra I EOC performance at TEACH high schools and the                                                                                                                           -    -                      -
                                                                                                                                                 2
Secondary DAEP from spring 2018 to spring 2019. It is evident
                                                                                                                                                             Increased               Decreased          No Change
that 50% of the campuses had an increase and 50% had no change                                                                                 (18)
in their performance on the English I EOC exam. In addition,                                                                                                                   English I EOC      Algebra I EOC
100% of the campuses showed an increase in the percentage of
students at or above the Approaches Grade Level standard on the                                                          Figure 10: Changes in percent at or above Approaches Grade Level,
Algebra I EOC.                                                                                                           TEACH high schools/Secondary DAEP, 2018 to 2019

What was the impact of TEACH on students’ attendance                                                                          A summary of the mean attendance rates by elementary/K–8
and behavior during the 2018–2019 school year, considering                                                               schools are shown in Figure 11a (p. 6). It is evident that eleven
previous year’s outcomes?                                                                                                of the fifteen (73.3%) schools showed an increase in attendance
                                                                                                                         rates, two had no change (13.3%), and two schools had a decrease
    A paired t-test was conducted to determine the impact of                                                             (13.3%) in attendance rates from 2018 to 2019. Positive changes
TEACH on attendance at targeted schools. The attendance rates                                                            at Ashford, Bastian, Blackshear, Garden Oaks K–8, Mading,
were aggregated by school for the 2017–2018 (pretest) and the                                                            Mitchell, and Wesley were statistically significant (p
TEACH Elementary and K-8 Schools, Pre - and Post-Attendance Rates
               98.0
                                                                                                                                    96.1 96.6                95.8 96.2      96.0 96.5
               96.0                    95.0            95.3          95.4     95.0 95.0                       95.5                                                                                                          95.2 95.4
                                                              94.5                                                                                                                         94.4 94.4     94.7 95.0
                                94.0            93.7                                       94.0 93.5                   93.8 93.3                                                                                                                94.1            93.9
               94.0                                                                                                                                                                                                                     93.4             92.9
                                                                                                       92.3
               92.0
Percent (%)

               90.0
               88.0
               86.0
               84.0
               82.0
               80.0
                               Ashford ES Bastian ES Blackshear Codwell ES Foerster ES Garden Oaks Highland                        MacGregor Mading ES Mitchell ES Reynolds ES Thompson Walnut Bend Wesley ES                                            Young ES
                                                         ES                                K-8     Heights                            ES                                          ES        ES
                                                                                                               Mean 2017-2018          Mean 2018-2019

Figure 11a: Mean attendance based on paired t-test analyses at TEACH elementary/K–8 schools, 2017–2018 vs. 2018–2019

                                         TEACH Middle Schools, Pre- and Post-Attendance Rates                                                                                                In-school Suspensions
                98.0                                                                                                                                 100.0
                                                                     95.8           95.4                             95.4 94.9
                96.0                                                                       94.4
                                                  93.1                      93.5                   93.3 93.4
                94.0             92.1                                                                                                                 80.0
                92.0                     91.2
 Percent (%)

                                                                                                                                                                                  59.2

                                                                                                                                       Percent (%)
                90.0                                      88.0                                                                                        60.0
                                                                                                                                                                         48.4
                88.0                                                                                                                                                                                     42.2
                                                                                                                                                                                                                   37.5
                86.0                                                                                                                                  40.0
                84.0
                82.0                                                                                                                                  20.0
                                                                                                                                                                                                                                          5.6          3.3
                80.0
                                Attucks MS        Cullen MS        Fleming MS Fondren MS Thomas MS               Welch MS                              0.0
                                                                                                                                                                            None                            1 to 3                        4 or More
                                                        Mean 2017-2018             Mean 2018-2019
                                                                                                                                                                                             2017-2018      2018-2019

Figure 11b: Mean attendance, paired t-test analyses at TEACH middle                                                                  Figure 12a: In-school suspensions, all TEACH schools, 2017–2018 vs.
schools, 2017–2018 vs. 2018–2019                                                                                                     2018–2019

schools (83.3%), while the attendance rate at one school remained                                                                        Figure 12a shows a moderate increase in the percentage of
unchanged (16.7%) over the two-year period. The decreases                                                                            students with no in-school suspensions from 2017–2018 to 2018–
at Attucks, Cullen, Fleming, and Fondren were statistically                                                                          2019 at all TEACH campuses. Moreover, there were moderate
significant (p
Discussion                                                         Washington, DC: The Council of Chief State School Officers.
     A positive school culture is pivotal toward improving student Retrieved from, http://www.ccsso.org/content/pdfs/Final%20
behavior (Wang et al., 1997). Embedded teacher professional        Meta%20Analysis%20Paper%20full.pdf
development, that includes coaching and feedback, have the             Bradshaw, C. P., O’Brennan, L. M., & McNeely, C. A. (2008).
potential to build on effective classroom management strategies     Core compe- tencies and the prevention of school failure and early
(Blank & de las Alas, 2009). TEACH provides educators with tools   school leaving. New Directions for Child and Adolescent Devel-
to create a calm, safe environment for students. This collaborativeopment, 122, 19–32. doi:10.1002/cd.226
model is aimed to build student’s confidence to perform better in      Bradshaw, C. P., Pas, E. T., Bottiani, J. H., Debnam, K. J., Re-
school and reinforce student learning, which is consistent with    inke, W. M., Herman, K. C., … Gregory, A. (2018). Promoting
the research (Little, 1993; Newmann & Wehlage, 1993; Louis &       Cultural Responsivity and Student Engagement Through Dou-
Marks, 1998).                                                      ble Check Coaching of Classroom Teachers: An Efficacy Study.
     This program evaluation assessed teachers’ perceptions of     School Psychology Review, 47(2), 118. https://doi.org/10.17105/
TEACH and students’ distal educational outcomes, including         SPR-2017-0119.V47-2 Bush, R. N. (1984). Effective staff devel-
reading, mathematics, attendance, and disciplinary actions over    opment in making schools more effective: Proceedings of three
a two-year period. The targeted population was comprised of        state conferences. San Francisco, CA: Far West Laboratory.
teachers and students at 15 elementary/K–8 and 10 secondary            Bush, R. N. (1984). Effective staff development in making
campuses that implemented the TEACH model in HISD during           schools more effective: Proceedings of three state conferences.
the 2018–2019 academic year. Among the 68 teachers who             San Francisco, CA: Far West Laboratory.
responded to a survey on TEACH processes, an overwhelming              Corradino, C. & Fogarty, K. (2016). Positive emotions and ac-
majority indicated that they welcome real-time coaching and that   ademic achievement. Retrieved from https://steinhardt.nyu.edu/
the coaching was helpful. Additional comments revealed that        appsych/opus/issues/2016/spring/corradino_fogarty
teachers considered the program effective and beneficial toward         Centers for Disease Control and Prevention. (2009). Fostering
managing the classroom environment. On the End-of-Year Survey,     School Connectedness: Improving School Health and Academic
most teachers were in agreement that TEACH strategies support      Achievement. Retrieved from, https://www.cdc.gov/healthyyouth/
and can be adapted to their teaching style and that transitions areprotective/pdf/connectedness_teachers.pdf
smoother between activities when using TEACH strategies. On            Darling-Hammond, L., Chung Wei, R., Andree, A., & Rich-
the combined English and Spanish STAAR grades 3–8 reading          ardson, N. (2009). Professional learning in the learning profession:
and mathematics tests, the majority of elementary/K–8 campuses     A status report on teacher development in the United States and
showed increases in the percentage of students who scored          abroad. Oxford, OH: National Staff Development Council.
at or above the Approaches Grade Level standard in reading             Fabelo, T., Thompson, M. D., Plotkin, M., Carmichael, D.,
and mathematics, while the majority of middle schools had a        Marchbanks, M. P., III, & Booth, E. A. (2011). Breaking schools’
decrease in reading and an increase in mathematics performance     rules: A statewide study of how school discipline relates to stu-
from spring 2018 to spring 2019. In addition, the high schools/    dents’ success and juvenile justice involvement. New York, NY:
Secondary DAEP campuses mostly showed an increase or no            Council of State Governments Justice Center, Public Policy Re-
change in students’ performance on the English I EOC exam,         search Institute at Texas A&M University. Retrieved from http://
while all schools showed an increase in the percentage of students justicecenter.csg.org/files/Breaking_Schools_Rules_Report_Fi-
at or above the Approaches Grade level standard on the Algebra     nal. pdf.
I EOC exam.                                                            Farn, A. & Adams, J. (2016). Education and interagency col-
     Paired t-test analyses showed gains in the mean attendance    laboration: A lifeline for justice- involved youth. Washington, DC:
rates at 73.3% of TEACH elementary/K–8 campuses and a slight       Center for Juvenile Justice Reform, Georgetown University Mc-
increase at one of the TEACH middle schools from 2017–2018         Court School of Public Policy. Available from http://cjjr.george-
to 2018–2019. TEACH high schools and the Secondary DAEP            town.edu/wp-       content/uploads/2016/08/Lifeline-for-Justice-In-
showed decreases in attendance rates over the same time period.    volved-Youth_August-2016.pdf.
Taken in account all TEACH schools, the percentage of students         Fitzpatrick, C., Conlon, A., Cleary, D., et al. (2013). Enhancing
with no in-school suspensions increased; however, there was a      the mental health promotion component of a health and personal
slight decrease in the percentage of students with no out-of-schooldevelopment programme in Irish schools. Adv Sch Ment Health
suspensions from 2017–2018 to 2018–2019.                           Promot. 6(2):122–38. [PMC free article] [PubMed]
     Considering these findings, school administrators should          Garet, M. S., Porter, A. C., Desimone, L., Birman, B. F., & Yoon,
ensure that all teachers have access to TEACH, particularly        K. S. (2001). What makes professional development effective? Re-
at the secondary level, and that students are equally exposed      sults from a national sample of teachers. American Educational Re-
to TEACH strategies and practices through their teachers and       search Journal, 38(4), 915-945. doi:10.3102/00028312038004915.
administrators. Conducting periodic progress monitoring of             Greenberg, M. T., Weissberg, R. P., O’Brien, M. U., Zins, J.
teachers’ implementation of TEACH strategies throughout the        E., Fredericks, L., Resnik, H., & Elias, M. J. (2003). Enhancing
year may help to ensure consistent use of the program and its      school-based prevention and youth development through coordi-
components.                                                        nated social, emotional, and academic learning. American Psy-
                                                                   chologist, 58, 466–474. doi: 10.1037/0003-066X.58.6-7.466.
References                                                             Gregory, A., Cornell, D., Fan, X., Sheras, P., Shih, T., & Huang,
   Blank, R. K., & de las Alas, N. (2009). Effects of teacher pro- F. (2010). Authoritative school discipline: High school practices
fessional development on gains in student achievement: How meta associated with lower student bullying and victimization. Journal
analysis provides scientific evidence useful to education leaders. of Educational Psychology, 102, 483–496. doi:10.1037/a0018562
                                                                                                                                      7
Holland, H. (2005). Teaching Teachers: Professional De-                Losen, D., Hodson, C., Keith, M. A., II, Morrison, K., & Bel-
velopment To Improve Student Achievement. AERA Research               way, S. (2015). Are we closing the school discipline gap? Los An-
Points, 3(1). Retrieved from https://files.eric.ed.gov/fulltext/      geles, CA: The Center for Civil Rights Remedies at the Civil Rights
ED491587.pdf                                                          Project, University of California Los Angeles. Retrieved from
     Houston Independent School District. (2019). STAAR               http://civilrightsproject.ucla.edu/ resources/projects/center-for-civ-
Grades 3-8 Spring 2018. Retrieved from https://www.hous-              il-rights-remedies/school-to-prison- folder/federal-reports/are-we-
tonisd.org/site/handlers/filedownload.ashx?moduleinstan-              closing-the-school-discipline-gap/ AreWeClosingTheSchoolDisci-
ceid=96404&dataid=225000&FileName=2018%20STAAR%20                     plineGap_FINAL221.pdf.
3-8%20Report.pdf                                                            Louis, K. S., & Marks, H. M. (1998). “Does Professional Com-
     Jones, K. A., Jones, J. L., & Vermete, P. J. (2013). Exploring   munity Affect the Classroom? Teachers’ Work and Student Experi-
the Complexity of Classroom Management: 8 Components of               ences in Restructuring Schools.” American Journal of Education,
Managing a Highly Productive, Safe, and Respectful Urban En-          Vol. 106, pp. 532–575.
vironment. American Secondary Education, 41(3), 21. Retrieved               Newmann, F., & Wehlage, G. (1993). Five standards of authen-
from http://search.ebscohost.com/login.aspx?direct=true&Auth-         tic instruction. Educational Leadership 50, no. 7:8–12.
Type=shib&db=f5h&AN=89935757&site=eds-live&scope=site                       Stracuzzi, N., & Mills, M. (2010). Teachers matter: Feelings of
     Kellogg, P., & Lawson, B. (1993). Envoy: Your personal           school connectedness and positive youth development among Coos
guide to classroom management. Battle Ground, WA: Mga Pub             County youth. New England.
Consortium.                                                                 TEACH. (n.d.). About TEACH. Retrieved from http://www.
     Kerr, D., Ireland, E., Lopes, J., Craig, R., & Cleaver, E.       toeducateallchildren.org/
(2004). Citizenship education longitudinal study: Second annu-              Texas Education Agency. (2017). State of Texas Assessments
al report: First longitudinal study. Retrieved from https://www.      of Academic Skills (STAAR®) performance labels and policy defi-
education.gov.uk/publications/eOrderingDownload/RB531.pdf             nitions. Retrieved from https://tea.texas.gov/...assessment/STA-
     Larrivee, B. (2009). Authentic classroom management: Cre-        AR_Performance_Labels_and_Policy_ Definitions.pdf
ating a learning community and building reflective practice. Bos-           Truesdale, W. T. (2003). The implementation of peer coaching
ton, MA: Allyn and Bacon.                                             on the transferability of staff development to classroom practice in
     Little, J. W. (1993). Teachers’ professional development in a    two selected Chicago public elementary schools. Dissertation Ab-
climate of educational reform. Educational Evaluation & Policy        stracts International, 64 (11), 3923.
Analysis, 15(2), 129–151.                                                   Wang, M. C., Haertel, G. D., & Walberg, H. J. (1997). Learning
     Losen, D. J., Hodson, C., Ee, J., & Martinez, T. (2015).         influences, in: H. J. Walberg and G. D. Haertel (eds) Psychology
Disturbing inequities: Exploring the relationship between racial      and Educational Practice (Berkley, CA: McCuthan), pp. 199–211.
disparities in special education identification and discipline. In          Wolk, S. (2003). Hearts and minds. Educational Leadership,
D. J. Losen (Ed). Closing the school dis- cipline gap: Equitable      61(1), 14–18.
remedies for excessive exclusion (pp. 89–106). New York, NY:
Teachers College Press.

                                                                                                                                           8
Appendix A

Table 1: TEACH Program Implementation in HISD by School as of 2018–2019
TEACH Schools                                                 Number of Years Participating in TEACH
Elementary/K–8 Schools
Ashford ES                                                                        1
Bastian ES                                                                        1
Blackshear ES                                                                     1
Codwell ES                                                                        1
Foerster ES                                                                       1
Garden Oaks K–8                                                                   4
Highland Heights ES                                                               1
MacGregor ES                                                                      4
Mading ES                                                                         5
Mitchell ES                                                                       3
Reynolds ES                                                                       1
Thompson ES                                                                       2
Walnut Bend ES                                                                    4
Young ES                                                                          1
Wesley ES                                                                         1
Secondary Schools
Attucks MS                                                                        3
Cullen MS                                                                         6
Secondary DAEP                                                                    2
Fleming MS                                                                        1
Fondren MS                                                                        1
North Forest HS                                                                   1
Sterling HS                                                                       1
Thomas MS                                                                         2
Welch MS                                                                          1
Wheatley HS                                                                       2

Note: ES = Elementary ; MS = Middle School, DAEP = Disciplinary Alternative Education Program

                                                                                                       9
Appendix B

             10
Appendix C

Table 2: Student Demographic Characteristics, 2018–2019
                                       TEACH Students                    Districtwide

                                  N                              N
                                15,113                  %     209,040                   %

Race/Ethnicity
Asian/Pacific Islander           174                    1.2    8,868                    4.2
African American                8,606                 56.9    48,920                    23.4

Hispanic                        5,617                 37.2    129,909                   62.1
American Indian                   23                    0.2     350                     0.2
Two or More Races                144                    1.0    2,578                    1.2
White                            549                    3.6   18,415                    8.8
Gender
 Female                         7,218                 47.8    103, 189                  49.4
 Male                           7,895                 52.2    105,851                   50.6
Eco Disadvantaged               13,648                90.3    167,106                   79.9
Special Education               1,577                 10.4    15,469                    7.4
Gifted/Talented (G/T)            862                    5.7   33,111                    15.8
English Learners                3,615                24.9     66,394                    31.6
Source: Chancery and PEIMS databases

                                                                                               11
Appendix D

Table 3: Teacher Process Survey Results, 2018–2019 (n=68)
                                                                       Strongly    Agree   Disagree   Strongly   N/A
Survey Items                                                            Agree                         Disagree
                                                                          %         %         %          %        %
I am informed in advance when we are going to have a PLC                 50.0      39.7      4.4        1.5      4.4
session.
Monthly PLC sessions with a TEACH instructor occur with the              33.8      55.9      1.5        1.5      7.4
right frequency.
TEACH sessions directly reflect the needs of my campus.                  38.8      46.3      6.0        3.0      6.0
I am able to have specific classroom or student issues addressed         36.8      39.7      10.3       2.9      10.3
during TEACH sessions.
The amount of coaching I receive is just right.                          32.4      45.6      5.9        1.5      14.7
The coaching feedback I receive is helpful.                              41.2      42.6      0.0        1.5      14.7
I welcome receiving real time coaching.                                  44.1      42.6      1.5        0.0      11.8

Table 4: Teacher End-of-Year Survey Results, 2018–2018 (n=98)
                                                                        Strongly   Agree   Disagree   Strongly   N/A
Survey Items                                                             Agree                        Disagree
                                                                           %        %         %          %        %
Because of the skills that I am learning through TEACH, it's in-         21.4      53.1      7.1        4.1      14.3
creasing my probability of remaining in the teaching profession.
Because of the skills I have learned through TEACH, my relation-          27.6     54.1      6.1        2.0      10.2
ship with students has improved.
 Because of the skills I have learned through TEACH, my relation-         25.5     55.1      3.1        3.1      13.3
ship with students is now more based on influence versus power.
TEACH strategies help me more easily manage small student inci-           25.5     55.1      7.1        1.0      11.2
dents without them escalating into major disciplinary problems.
 I believe that TEACH strategies have made a difference in my              29.9     53.6      3.1        2.1      11.3
classroom.
 Using TEACH strategies helps me better regulate my own energy            29.6     46.9      9.2        1.0      13.3
level throughout the teaching day.
 I find more time to focus on content in my classroom since I have        25.0     49.0      8.3        1.0      16.7
started using TEACH management strategies.
Group sessions with TEACH are a good use of my time.                      21.6     58.8      9.3        3.1      7.2
I use many of the strategies I learned from TEACH every day.              28.6     57.1      5.1        1.0      8.2
 TEACH strategies support and can be adapted to my personal               31.6     56.1      3.1        1.0      8.2
teaching style.
As a teacher, I am satisfied with the professional development I          32.7     51.0      3.1        2.0      11.2
have received from TEACH this school year.
It is easier to gain and maintain student attention using TEACH           32.7     54.1      4.1        2.0      7.1
strategies.
Transitions are smoother between activities when using TEACH              31.6     55.1      2.0        2.0      9.2
strategies.
With TEACH classroom management skills, I am better able to               25.8     50.5      9.3        2.1      12.4
handle behavioral issues inside my classroom; thereby, reducing my
disciplinary referrals.

                                                                                                                        12
Appendix E

                                                                                                                               STAAR 3-8 Reading
                  100

                       80                                                                                        74 73                                                                                                   74 74
                                                                                                                                                   69
                                                                                                                                             65                                 64                                                       62
                                                           59            60                                                                                                57
Percent (%)

                       60                            54                              55                                                                                                     53 55
                                        51 53                       49                    50                                                                                                               49 52
                                                                                                                                                                                                                                              53                         51
                                                                                                       47                                                                                                                                                    46               46
                                                                                                  43                                  43
                                                                                                                                38                                                                                                                      39
                       40

                       20

                            -
                                      Ashford ES Bastian ES Blackshear Codwell Foerster ES Garden Highland MacGregor Mading ES Mitchell                                                                   Reynolds Thompson Walnut Wesley ES Young ES
                                                                ES       ES               Oaks K-8 Heights    ES                 ES                                                                         ES        ES    Bend ES
                                                                                               2018 % At or Above Approaches                      2019 % At or Above Approaches

   STAAR 3-8 combined English and Spanish reading, first administration only, TEACH elementary/K–8 schools 2018 vs. 2019

                                                                                                                                     STAAR 3-8 Math
                    100

                            80                                                                                       74 74                                                            75                                            74
                                                                           67                                                                               70                                                                 70              68 66
                                                                                                                                                  62                            63                                                                                             65
                                                     61 58          61
                                        57 56                                         57 59                                                                                                      59 59
  Percent (%)

                            60                                                                             55                                                                                                   54 55                                                                52
                                                                                                      51
                                                                                                                                     45 47                                                                                                                          45
                                                                                                                                                                                                                                                               41
                            40

                            20

                            -
                                      Ashford ES Bastian ES Blackshear Codwell ES Foerster ES Garden                             Highland MacGregor Mading ES Mitchell ES Reynolds                                        Thompson            Walnut      Wesley ES Young ES
                                                                ES                            Oaks K-8                           Heights     ES                             ES                                               ES               Bend ES
                                                                                                  2018 % At or Above Approaches                         2019 % At or Above Approaches

STAAR 3-8 combined English and Spanish math, first administration only, TEACH elementary/K–8 schools, 2018 vs. 2019

                                                                      STAAR 3-8 Reading                                                                                                                             STAAR 3-8 Math
                                100                                                                                                                                    100
                                 90
                                 80                                                                                                                                        80
                                                                                                                                                                                                                                         66                                         65
                                                                                                                                                                                                                                                61
                                                                                                                                                         Percent (%)

                                 70                                                                                                                                                                                      57 53                                    57
                                                                                                                                                                           60                                                                                                 52
              Percent (%)

                                 60                                                            54 51                                  55                                                        48             48                                         50
                                                            45 43             45 44                                             48                                                     41                 39
                                 50        42 41                                                                43
                                                                                                                     38                                                    40
                                 40
                                 30
                                                                                                                                                                           20
                                 20
                                 10                                                                                                                                        -
                                 -                                                                                                                                                   Attucks MS Cullen MS Fleming MSFondren MSThomas MS Welch MS
                                        Attucks MS        Cullen MS      Fleming MS Fondren MS Thomas MS                       Welch MS
                                         2018 % At or Above Approaches                    2019 % At or Above Approaches
                                                                                                                                                                                2018% At or Above Approaches                         2019% At or Above Approaches

   STAAR 3-8 combined English and Spanish mathematics, first administration only, TEACH middle schools, 2018 vs. 2019

                                                                STAAR EOC English I                                                                                                                            STAAR EOC Algebra I
                                100                                                                                                                                100
                                 80                                                                                                                                    80                            70
                                                                                                                                                                                                                                           63        65
                                                                                                                                                   Percent (%)
              Percent (%)

                                 60                                                                                                                                    60                  47                       47    50

                                 40          34      34                         30                                                                                     40                                                                                                      28
                                                                      28                         29        29                     25
                                                                                                                          13                                           20                                                                                              13
                                 20

                                 -                                                                                                                                     -
                                         North Forest HS            Sterling HS                Wheatley HS           Secondary DAEP                                              North Forest HS                Sterling HS              Wheatley HS           Secondary DAEP

                                      2018 % At or Above Approaches                       2019 % At or Above Approaches                                                    2018 % At or Above Approaches                            2019 % At or Above Approaches

    STAAR EOC, first administration only, TEACH high schools/Secondary DAEP, 2018 vs. 2019

                                                                                                                                                                                                                                                                                          13
Appendix F

   Table 5: Paired T-test Attendance Analyses by TEACH Elementary Schools, 2017–2018 vs. 2018–2019
   TEACH Elementary/K–8          Mean         Mean                  Mean          Std.                             Sig.
   Schools                     2017–2018    2018–2019     N         Diff.         Devia.             t     df    (2-tailed)
   Ashford ES                     94.0         95.0      434         0.96       7.99402        2.499     433      .013*
   Bastian ES                     93.7         95.3      568         1.56       6.15824        6.041     567      .000*
   Blackshear ES                  94.5         95.4      323         0.89       4.68383        3.415     322     .001**
   Codwell ES                     95.0         95.0      345        (0.08)      4.21568        -.337     344       .736
   Foerster ES                    94.0         93.5      548        (0.43)      7.07910       -1.413     547       .158
   Garden Oaks K–8                92.3         95.5      694         3.19       17.33771       4.845     693     .000***
   Highland Heights ES            93.8         93.3      396        (0.48)      5.85006       -1.632     395       .103
   MacGregor ES                   96.1         96.6      489         0.50       8.35016        1.317     488       .189
   Mading ES                      95.8         96.2      363         0.40       3.37137        2.251     362      .025*
   Mitchell ES                    96.0         96.5      264         0.43       3.10814        2.272     263      .024*
   Reynolds ES                    94.4         94.4      366        (0.07)      5.69606        -.227     365       .821
   Thompson ES                    94.7         95.0      321         0.23       5.32608        .789      320       .431
   Walnut Bend ES                 95.2         95.4      514         0.24       5.61269        .986      513       .324
   Wesley ES                      93.4         94.1      263         0.71       4.47876        2.585     262      .010*
   Young ES                       92.9         93.9      226         0.97       9.87878        1.483     225       .139

 Table 4: Paired T-test Attendance Analyses by TEACH Middle Schools, 2017–2018 vs. 2018–2019
                               Mean          Mean                  Mean          Std.                             Sig.
 TEACH Middle Schools        2017–2018     2018–2019     N         Diff.         Devia.          t       df     (2-tailed)
 Attucks MS                     92.1          91.2      407        (0.93)      6.94263       -2.704     406     .007**
 Cullen MS                      93.1          87.8      320        (5.32)      9.27923       -10.248    319    .000***
 Fleming MS                     95.8          93.5      456        (2.21)      5.25614       -8.978     455    .000***
 Fondren MS                     95.4          94.4      942        (1.06)      4.99836       -6.485     941    .000***
 Thomas MS                      93.3          93.4      516        0.09        7.04686        .293      515      .769
 Welch MS                       95.4          94.9      619        (0.42)      6.36993       -1.623     618      .105

 Table 5: Paired T-test Attendance Analyses by TEACH High Schools, 2017–2018 vs. 2018–2019
 TEACH High/Secondary          Mean          Mean                  Mean          Std.                             Sig.
 DAEP Schools                2017–2018     2018–2019     N         Diff.         Devia.          t        df    (2-tailed)
 North Forest HS                92.0          87.9      887        (4.04)      9.89852       -12.144    886     .000***
 Sterling HS                    92.0          91.4      1355       (0.64)      7.35710       -3.216     1354    .001**
 Wheatley HS                    89.6          84.2      797        (5.35)      11.36442      -13.298    796     .000***
 Secondary DAEP                 78.5          69.1      118        (9.41)      14.68020      -6.963     117    .000***

Statistical Significance:
*p< .05
**p
You can also read