RESEARCH ON THE INFLUENCE OF THE APPLICATION OF SOME INNOVATIVE FERTILIZERS TO MAIZE CULTIVATION IN THE TRANSYLVANIA PLAIN - PHD STUDENT GABRIEL ...
←
→
Page content transcription
If your browser does not render page correctly, please read the page content below
PhD THESIS

Research on the influence of
the application of some
innovative fertilizers to maize
cultivation in the Transylvania
Plain
PhD student Gabriel BARȘON

Scientific coordinator Prof.univ.dr. Marcel M. DUDA

                                                      I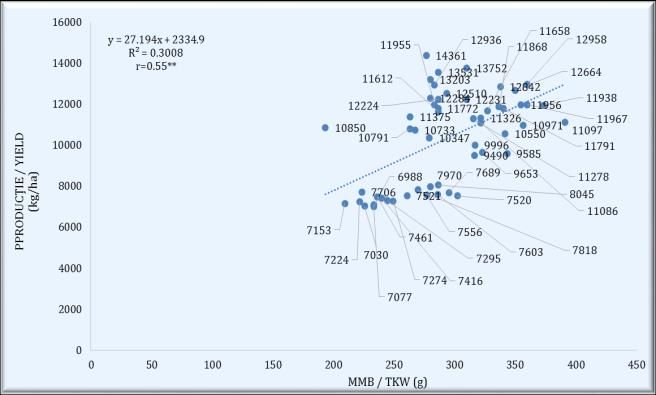
1. Corn
        1.1. Economic importance
       In terms of cultivated areas, corn ranks second in the world and first in production,
being surpassed only by wheat. Together with wheat, corn is the most important cereal
in the world (SOARE et al., 2018). what makes them. Due to its production potential, the
highest among cereals, it is known worldwide as the queen of cereals (TAJAMUL et al.,
2016).
      1.4. The situation of maize areas and productions in Romania
      In three decades, the area reserved for cultivation has never fallen below 2 million
hectares. Instead, in 10 years (1992, 1992, 1995, 1996, 1997, 1998, 1999, 2000, 2003,
2004), the surface was more than 3 million hectares, the absolute record being
registered in 1992, when 3.3 million ha were cultivated with corn grains
(https://www.lumeasatului.ro/articole-revista/ agrotehnica / 7471-evolution-of-corn-
areas-and-crops-in-the-last-30-years.html)
In 2019, the largest areas with corn were registered in the South-Muntenia region
(534,443 ha), followed by the South-East (502,721 ha).
By counties, the largest areas with corn were found in Arad (198,249 ha), Timiș (165,643
ha), Călărași (127,300 ha), Brăila (125,418 ha), Ialomița (112,242 ha), Botoșani (108,669
ha),       Buzău        (106,283       ha)       and       Tulcea       (101,749       ha)
(https://www.lumeasatului.ro/articole-revista/agrotehnica/7471-evolutia-
suprafetelor-si-recoltelor-de-porumb-in-ultimii-30-de- ani.html).
In 2019, by development regions, the largest harvests were recorded in South Muntenia
(3,579,476 tons) and West (3,337,845 tons).
The highest productions were made in the most favorable years from a climatic point of
view, respectively, 2018 - 7,644 kg / ha, 2019 - 6,502 kg / ha and 2017 - 5,959 kg / ha.
Over 4,000 kg per unit area were also obtained in 1991 - 4,072 kg / ha, 1997 - 4,171 kg /
ha, 2004 - 4,441 kg / ha, 2010 - 4,309 kg / ha, 2011 - 4,525 kg / ha, 2013- 4,488 kg / ha
and 2014 - 4,770 kg / ha. The negative record was recorded in 2007, when farmers
harvested an average of 1,526 kg of corn per hectare, followed by 2000, with 1,603 kg /
ha. For 2019, by development regions, the highest averages per hectare come from the
Western       area     (https://www.lumeasatului.ro/articole-revista/agrotehnica/7471-
evolutia-suprafetelor-si-recoltelor-de-porumb -in-the-last-30-years.html).

2. The role of fertilizers in the growth and development of
                        corn cultivation
          Mineral nutrients make a major contribution to increasing maize crop
production and maintaining soil productivity, as well as preventing soil degradation.
Improving the nutritional status of plants by applying fertilizers and maintaining soil
fertility has been the critical step in food production since the beginning of the "Green
Revolution", both in developed and developing countries (HUANG et al., 2020).

II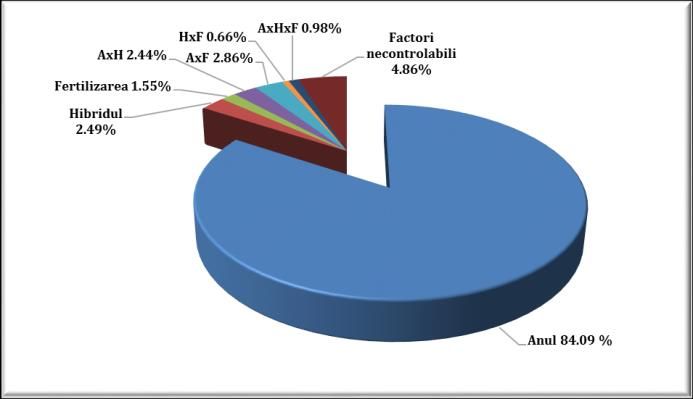
2.1. Classification of fertilizers
      Fertilizers are natural or synthetic products, mineral or organic, simple or
complex, applied in the soil, on the soil or on the plant and intended to complete the
nutrient reserve of the soil, to ensure the normal growth of plants.
      Classification of fertilizers:
    • by their nature: mineral fertilizers and organic fertilizers;
    • according to the method of obtaining: chemical or synthetic fertilizers and
        natural fertilizers
    • according to the size of the doses in which they are used: fertilizers with
        macroelements (N, P, K, S, Mg), applied in doses of tens or even hundreds of kg
        active substance (sa) / ha, usually every year, and fertilizers with
        microelements, applied of the order kg element / ha once every few years.
    • according to the number of essential nutrients that interest the fertilization
        system: simple fertilizers, with a single essential element of interest for
        fertilization, and complex or mixed fertilizers, with two or more essential
        elements.
    • according to the conditioning method: solid fertilizers (crystallized, powder,
        granules, in the form of tablets), liquid fertilizers and fertilizers in the form of
        suspensions (BUDOI, 2001).
                            3. Objectives pursued
      In order to achieve this general objective, three main directions have been
pursued:
      3.1. The influence of differentiated fertilization on biological traits in three
commercial maize hybrids.
      3.2. Quality and quantity of maize production, depending on the fertilization
applied.
      3.3. The attack of Fusarium sp. and Ostrinia nubilalis in commercial maize
hybrids, depending on the fertilizer applied.

4. Particularities of the natural environment in which the
                experimentation took place

      4.7 Thermal              and     pluviometric         regime      in    years      of
experimentation
         Due to the recorded temperatures, 2018 was characterized as a warm year
and in terms of falling precipitation it was a normal year. 2019 was a warm year, in
terms of temperatures and normal, in terms of rainfall, with a water deficit in June and
July. In 2020, the recorded temperatures slightly exceeded the 60-year average, but
from a rainfall point of view, most of the precipitation fell in July, exceeding the 60-
year monthly average by approximately 100 mm.

                                                                                         III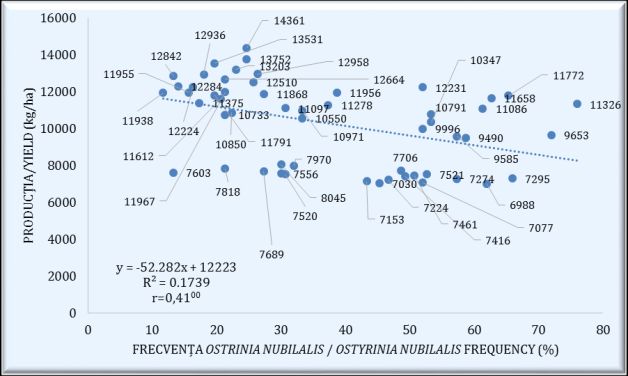
5. Material and methods used
        5.1. Biological material - TURDA 332 - FAO 380, TURDA 344 - FAO 380,
PR37N01 - FAO: 380 corn hybrids.
        5.2. Field research methods
         Factor A: year
♦ A1 - 2018; ♦ A2 - 2019; ♦ A3 - 2020
         Factor B: corn hybrid
♦ B1. Turda 332; ♦ B2. Turda 344; ♦ B3. Pioneer PR 37N01;
         Factor C: fertilization
♦ C1. Basic fertilization; ♦ C2. Eurofertil Top 51 NPK; ♦ C3. Synertec NK35 N; ♦ C4.
Fertiactyl Starter; ♦ C5. Rootip Basic + Power; ♦ C6. Novatec Classic.
        5.3. Observations and determinations made
        5.3.1 Observations and notations
        Biometrizations in the field: ►plant height; ►the insertion height of the cob;
►number of leaves above the cob, ►the width of the leaves; ►length of leaves.
Biometrization at harvest and after harvest:
►frequency and intensity of Fusarium sp .; ►MBB was determined; ►hectolitre mass;
►quality analyzes (100 g / variant); ►the frequency of Ostrinia nubilalis attack has
been calculated.
        5.3.2 Determinations performed
► qualitative indices were determined using the NIR Tango apparatus.
        5.4. Statistical-mathematical methods used
       ➢ the attack of fusariosis and corn borer was noted in percentages
       ➢ the chemical composition of the grain (starch and protein) were given in
percentages (%);
       ➢ the production was expressed in kg / ha, for the statistical processing and for
the graphic representation the expression in t / ha was used;
       ➢ statistical calculation, graphical representation and correlations were made
using POLIFACT and EXCEL programs.

                         6. Results and discussion
          Mineral fertilizers, chemical or organic, are components that increase
productivity and help plant development. In this thesis we proposed a study on the
effect of differentiated fertilization on the quality and quantity of maize production, on
some biological characteristics but also their influence on the attack of the main
diseases of maize (fusariosis) but also the pest Ostrinia nubilalis.
       6.1. Results on the effect of differentiated fertilization on
biological traits in the studied hybrids
6.1.1. Results regarding the size of the plants and the insertion
height of the cob

IV
In the climatic conditions of the three experimental years, the height of corn
plants had different heights, from 2.38 m in 2018 to 2.73 in 2020. The three hybrids in
2018 had the lowest height , and the climatic conditions in 2019 and 2020 favored
corn plants, the highest average size was recorded in 2020. Among the hybrids studied,
the highest hybrid was Turda 344, with an average height of 2.66 m.

             Fig. 6.1 The factors contributing (%) involved in plant size (2018-2020)

          Figure 6.1 shows the statistical-mathematical analysis of the share of factors
involved in plant growth (plant size). The figure shows the predominant action of
climatic conditions (57.92%) being followed by the interaction of hybrid x x (7.74%)
and the genetic factor (6.54%). A much lower participation in the total variance with
close relative values is found in the case of interactions between factors (year x hybrid
x fertilization 1.69%, hybrid x fertilization 1.35%) (Fig. 6.1).

   6.1.2. Results on the number of leaves above the cob, the length and
                            width of the leaves
         The data from the literature reveal that most of the characters that are of
agronomic interest show a continuous variability, being polygenically controlled
(COPÂNDEAN ANA, 2012). Although it is a genetically determined character, the
number of leaves superior to the cob, can change every year depending on the size of
the plants, in the plants with a higher height and the number of leaves above the cob is
higher. Regarding the average number of leaves above the cob in the three hybrids
studied, from the data presented in table 6.11 we can conclude that there are no
significant differences between them, but the hybrid with the most leaves above the
cob was PR37N01, with an average of 5.75 leaves. Fertilization variants had a different
influence on the number of leaves above the cob, most of the upper leaves of the cob
were noted in the variant where NPK + CAN was applied (5.76 leaves) and the lowest
number of leaves above the cob was noted in the variety in which fertilization was
done with Novatec Classic (5.57).
Table 6.11
     The average of leaves number above the cob to commercial hybrids (2018-2020)
  Nr.crt    Hibridul     Nr. frz. deasupra       % față de        Dif. față de mt.      Semnif. dif.
                                                                                                       V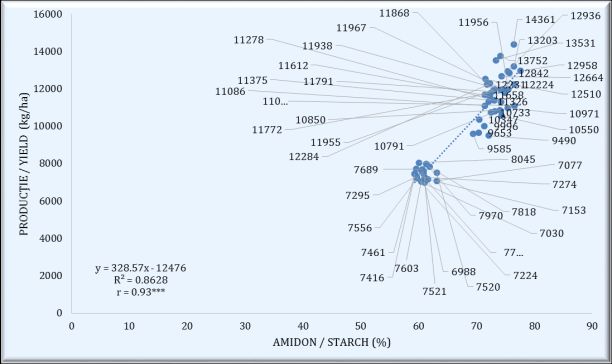
No.       Hybrid              șt.                 martor           Dif. to control     Signif. of the
                               Leaves no.            % to control                               dif.
                              above the cob
    1.       PR37N01              5.75                  100.0                 0.00               Mt.
    2.       Turda 332            5.60                  97.4                 -0.15                -
    3.       Turda 344            5.59                  97.3                 -0.16                -
 DL (p 5%)                                                                    0.16
 DL (p 1%)                                                                    0.22
 DL (p 0.1%)                                                                  0.31

    6.2. Results on the effect of differentiated fertilization on
productivity traits in the studied hybrids
           6.2.1 Results on the mass of a thousand grains
Table 6.27
            The influence of climatic conditions on the TKW to commercial hybrids
                              MMB
  Nr.crt         Anul                    % față de martor       Dif. față de mt.         Semnif. dif.
                              TKW
   No.           Year                     % to control          Dif. to control       Signif. of the dif.
                               (g)
    1.          Media         294             100.0                  0.00                    Mt.
    2.          2018          321              109                     27                    ***
    3.          2019          254              86                     -40                    000
    4.          2020          307              105                     13                     **
 DL (p 5%)                                                           7.64
 DL (p 1%)                                                           12.64
 DL (p 0.1%)                                                         23.66
Table 6.29
                         The influence of fertilization variant on the TKW
                                              MMB         % față de       Dif. față de      Semnif. dif.
 Nr.crt        Varianta de fertilizare
                                              TKW          martor              mt.         Signif. of the
  No.           Fertilization variant
                                               (g)       % to control    Dif. to control       dif.
   1.     NPK +CAN                            290           100.0              0.00             Mt.
   2.     Eurofertil+CAN                      306           105.4               14              **
   3.     NPK+Sinertec                        297           102.2                7               -
   4.     NPK +CAN+Fertiactyl Starter         294           101.4                4               -
   5.     NPK+CAN+Rootip+Energevo             295           101.7                5               -
   6.     Novatec Clasic                      281            96.9               -9               -
 DL (p 5%)                                                                     9.70
 DL (p 1%)                                                                    12.83
 DL (p 0.1%)                                                                  16.58
         In the climatic conditions of 2018 and 2020, the mass of one thousand grains
was higher, with very significant positive differences compared to the control (table
6.27). in 2019, the low rainfall in June and July negatively influenced the grain
formation, so that their weight was lower, with very significant negative differences
compared to the control.
         Additional fertilization has differently influenced the mass of a thousand
grains. As we can see in table 6.29 this parameter had values higher than the control in
four of the experimental variants, but only in the variety to which Eurofertil + CAN was
applied, it exceeded the control with statistical assurance differences (306 g) (table
6.29).

           6.2.3 Yield results

VI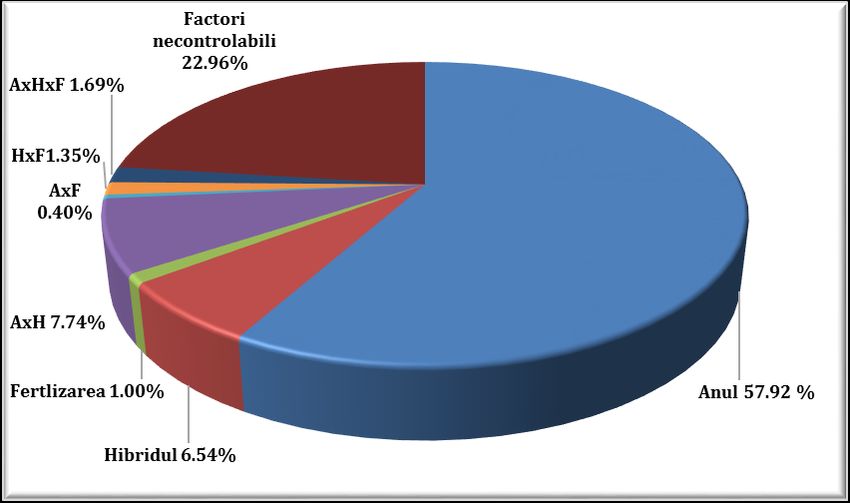
Production is genetically determined but is largely influenced by climatic
conditions during the growing season and applied technology. Climatic conditions
often positively or negatively influence the yields obtained from crops. Against the
background of the climatic conditions in 2018, the average production was 10965 kg /
ha, with a distinctly significant negative difference compared to the control (table
6.39). In the climatic conditions of 2019, the productions were low, the average per
experience did not exceed 8000 kg and the difference from the control was very
negative. This can be explained by the low rainfall in June and July and the very high
average temperatures in these months. In 2020, the highest productions were obtained
with very significant positive differences compared to the control (table 6.39).
Regarding the average production of the three hybrids studied, we can see that only
the Turda 344 hybrid had a lower average value, with very significant negative
differences compared to the control hybrid (Table 6.40).
Table 6.39
                       The influence of climatic condition on the corn yield
                              Producția       % față de
  Nr.crt       Anul                                           Dif. față de mt.       Semnif. dif.
                                Yield          martor
   No.         Year                                           Dif. to control     Signif. of the dif.
                               (kg/ha)       % to control
   1.          Media            10293           100.0              0.00                  Mt.
   2.          2018             10965           106.5               672                   **
   3.          2019             7482             72.7             -2811                  000
   4.          2020             12432           120.8              2139                  ***
 DL (p 5%)                                                          381
 DL (p 1%)                                                          630
 DL (p 0.1%)                                                       1179
Table 6.40
                          Yield average of commercial hybrids (2018-2020)
                               Producția                                              Semnif. dif.
  Nr.crt       Hibridul                    % față de martor    Dif. față de mt.
                                 Yield                                               Signif. of the
   No.         Hybrid                       % to control       Dif. to control
                                (kg/ha)                                                  dif.
    1.       PR37N01             10478           100.0               0.00                 Mt.
    2.       Turda 332           10608           101.2               130                   -
    3.       Turda 344            9794            93.5               -684                000
 DL (p 5%)                                                           252
 DL (p 1%)                                                           353
 DL (p 0.1%)                                                         498

        The share of participation of experimental factors in the formation of
production is presented in Figure 6.7. In the three experimental years, the greatest
influence on the production had the climatic conditions, the involvement of this factor
in obtaining the production was in the proportion of 84.09%. The hybrid also
contributed in higher percentages, 2.49%, the interaction between it and the climatic
conditions (year x hybrid 2.44) but also the interaction between year x fertilization
(2.86%) (figure 6.6).

                                                                                                  VII
Fig. 6.6 The factors contributing (%) involved in corn yield (2018-2020)
Figure 6.7 shows the positive relationship that exists between the mass of a
thousand grains and production. The positive relationship between the two
parameters is also confirmed by the value of the regression coefficient "r", which is
statistically assured. In the figure we can see that the highest values of production are
found next to the high values of MMB.
Fig. 6.7 The realtion between yield and TKW (2018-2020)
6.3. Results on the effect of differentiated fertilization on
production quality
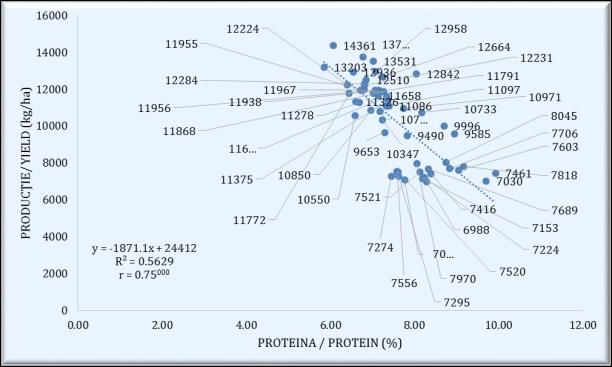
An overview of the negative relationship between protein content and
production is provided by Figure 6.9. The inclination of the regression line confirms
once again this inverse link between production and protein, the value of the
regression coefficient being statistically assured as very significant negative.
The positive relationship between production and starch content is shown in
Figure 6.11. The value of the regression coefficient is statistically assured, very
significantly positive. In the figure it can be seen that the highest values of production
are correlated with the highest values of starch content.
VIIIFig. 6.9 The realtion between yield and protein content (2018-2020)
Fig. 6.11 The realtion between yield and starch content (2018-2020)
6.4. Results regarding the effect of differentiated fertilization
on the attack of Fusarium sp. and Ostrinia nubilalis Hübn.
Figure 6.16 shows the relationship between the frequency and intensity of
Fusarium sp. and productions from the three experimental years. The attack of
fusariosis on cobs did not significantly influence the production of the three corn
hybrids, under experimental conditions, confirmed by the inclination of the regression
line but also by the values of the regression coefficient that were not statistically
assured.
There is an inverse relationship between the frequency of Ostrinia nubilalis
attack and the production of maize hybrids, confirmed by the inclination of the
regression line and the value of the regression coefficient (r = 0.4100), a statistically
significant negative value (figure 6.17). From the data presented in the figure we can
conclude that at a lower frequency of the attack of the corn borer, lower yields were
obtained, depending on climatic conditions and applied fertilization.
IXFig. 6.16 The relationship between the frequency and intensity of the Fusarium sp attack of. and
production (2018-2020)
Fig. 6.17 The relationship between the of Ostrinia nubilalis attack and yield (2018-2019)
7. Conclusions
Following this study, the following conclusions can be drawn:
❖ in 2019 there was a slight increase in plant size values only for the variant to
which NPK + CAN + Fertiactyl Starter was applied, a significant positive difference;
against the background of the climatic conditions from 2020, the highest value of the
plant size was registered for the variant to which Eurofertil + CAN was applied, (2.79
m);
❖ most of the upper leaves of the cob were noted in the variant to which NPK +
CAN was applied (5.76 leaves); the PR37N01 hybrid had the highest number of leaves
Xsuperior to the cob, in all fertilization variants (5.62-5.89);
❖ the average mass of one thousand grains was the highest in the variant to
which Eurofertil + CAN was applied;
❖ the highest value of the mass of one thousand grains was registered for the
hybrid PR37N01, by fertilization with NPK + CAN + Fertiactyl Starter;
❖ the application of innovative fertilizers lead to higher production increases,
especially in interaction with a favorable year from a climatic point of view;
fertilization in 2018 and 2020 brought higher production increases to the control, in
most fertilization options;
❖ the average protein content of the three hybrids differs, the hybrid with the
lowest protein content was Turda 332 and at the opposite pole was the Turda 344
hybrid with a higher protein content;
❖ additional fertilization influenced the protein content, in the variant to which
NPK + CAN + Rootip + Energevo was applied, the protein content was the highest
(7.83%) and in the variant in which Novatec Clasic was applied, the protein content
was the lowest (6.98%);
❖ the conditions from the years of experimentation influenced the production of
corn but also the starch content; there was a decrease in starch content in 2019
(60.80%), the year in which the lowest productions were registered and an increase in
2018 and 2020 years in which the productions were also higher;
❖ in the climatic conditions of 2018, the attack of Fusarium sp. in all three
hybrids and in all experimental variants;
❖ the most favorable year for the Ostrinia nubilais attack was 2018, the
frequency of the cob attack being 48.44%.
Selective Bibliography
1. BUDOI GH., 2001, Agrochimie II – Îngrășăminte, tehnologii, eficiență, Editura Didactică
şi Pedagogică, R.A. Bucureşti.
2. COPÂNDEAN ANA, 2012, Variabilitatea Unor Caractere Morfoproductive La Unele Linii
Consangvinizate De Porumb, An. I.N.C.D.A. Fundulea, Vol. Lxxx, Electronic (Online) Issn
2067–7758, Genetica Şi Ameliorarea Plantelor.
3. HUANG F., Z. LIU, P. ZHANG, Z. JIA , 2020, Hydrothermal effects on maize productivity
with different planting patterns in a rainfed farmland area, Soil & Tillage Research, 1-12.
4. SOARE E., I.A. CHIURCIU, A. V. BĂLAN, L. DAVID, 2018, World Market Research On
Maize, “Agriculture For Life Life For Agriculture” Conference Proceedings 1(1):216-222,
DOI: 10.2478/Alife-2018-0032
5. TAJAMUL R., K. SHAH, K. PRASAD, P. KUMAR, 2016, Maize—A Potential Source Of
Human Nutrition And Health: A Review, Cogent Food & Agriculture, 2:1, 1166995, DOI:
10.1080/23311932.2016.116699
***https://www.lumeasatului.ro/articole-revista/agrotehnica/7471-
evolutia-suprafetelor-si-recoltelor-de-porumb-in-ultimii-30-de-
ani.html).
XIYou can also read