Resilient Coverage: Exploring the Local-to-Global Trade-off
←
→
Page content transcription
If your browser does not render page correctly, please read the page content below
Resilient Coverage: Exploring the Local-to-Global Trade-off
                                                        Ragesh K. Ramachandran1 , Lifeng Zhou2 , James A. Preiss1 and Gaurav S. Sukhatme1

                                            Abstract— We propose a centralized control framework to
                                         select suitable robots from a heterogeneous pool and place
                                         them at appropriate locations to monitor a region for events
                                         of interest. In the event of a robot failure, the framework
                                         repositions robots in a user-defined local neighborhood of the
                                         failed robot to compensate for the coverage loss. The central
arXiv:1910.01917v2 [cs.RO] 15 Apr 2020

                                         controller augments the team with additional robots from the
                                         robot pool when simply repositioning robots fails to attain a
                                         user-specified level of desired coverage. The size of the local
                                         neighborhood around the failed robot and the desired coverage
                                         over the region are two objectives that can be manipulated
                                         to achieve a user-specified balance. We investigate the trade-
                                         off between the coverage compensation achieved through local
                                         repositioning and the computation required to plan the new
                                         robot locations. We also study the relationship between the size
                                         of the local neighborhood and the number of additional robots
                                         added to the team for a given user-specified level of desired
                                         coverage. We use extensive simulations and an experiment with                            Fig. 1: An illustration of our framework.
                                         a team of seven quadrotors to verify the effectiveness of our
                                         framework. Additionally, we show that to reach a high level of                 resilient objectives, thereby resulting in the most preferable
                                         coverage in a neighborhood with a large robot population, it                   resilient actions suitable for the task.
                                         is more efficient to enlarge the neighborhood size, instead of
                                         adding additional robots and repositioning them.
                                                                                                                           We consider a scenario in which a central decision-
                                                                                                                        maker or controller selects an appropriate set of robots
                                                                  I. I NTRODUCTION                                      from a collection of heterogeneous robots to perform a
                                            Real-world applications of robots require resilience. A                     monitoring task. The robots are selected based on various
                                         multi-robot team holds the promise of resilience in a failure-                 criteria such as their reliability, cost of deployment and size
                                         prone environment [1]. That is because, if some robots in the                  of the sensing area. The selected robot team is placed in
                                         team fail, the remaining ones can continue the task by recon-                  the environment such that the coverage of the robot team
                                         figuration via replanning [1], [2]. For example, in a multi-                   over the environment is maximized. The coverage of a
                                         robot coverage problem, in the event of a robot failure, the                   robot team over a domain is the probability that the robot
                                         neighbors of a failed robot can reposition themselves to fill                  team detects some event of interest in the domain (e.g.
                                         the coverage gap induced by the failed robot [1]. Alternately,                 intrusion of adversarial agents in the domain). Coverage also
                                         when a resource, such as a sensor or a computation unit on                     quantifies the monitoring performance of the robot team over
                                         a robot fails, the robot team repositions itself to reconfigure                the domain. A precise definition of coverage is given in
                                         the communication network to maintain the availability of                      Section II-B. While performing the monitoring task, it is
                                         resources among the robots in the team [2].                                    possible that some robots may fail to operate. Consequently,
                                            In practice, the resilience objective depends on specific                   the central controller needs to decide whether it is possible to
                                         task(s) that the robots are performing. For example, in an                     monitor the environment at an acceptable performance level
                                         urgent, time-critical task, such as using robots to fight fire [3]             by (1), team reconfiguration (i.e. repositioning the remaining
                                         or deliver medical supplies [4], the failures need to be                       (active) robots) or (2), by providing additional robots to raise
                                         handled in a short amount of time. In tasks such as mine                       the monitoring performance of the team to an acceptable
                                         mapping [5] and plant monitoring [6], when some robots                         level. The central controller makes this decision based on
                                         fail, the improvement of task performance is more important                    parameters set by a user. Figure 1 gives an illustration of
                                         even if it takes time. In this paper, we propose a framework                   our framework.
                                         that provides a user with the flexibility to choose different                     Our framework is as follows. If a robot fails, the users
                                                                                                                        selects a neighborhood of size L ∈ R+ (an L-neighborhood)
                                           1 Department of Computer Science, University of Southern California,
                                                                                                                        around the failed robot. For ease of computation, we use
                                         Los Angeles, CA 90089, USA (email: {rageshku,japreiss,
                                         gaurav}@usc.edu).                                                              a square which circumscribes a circle of radius L as
                                           2 Department of Electrical and Computer Engineering, Virginia Tech,          the user-defined L-neighborhood. In formal terms, the L-
                                         Blacksburg, VA 24061, USA (email: lfzhou@vt.edu).                              neighborhood is a ball of size L centered around the failed
                                           This work was supported in part by the Army Research Laboratory as
                                         part of the Distributed and Collaborative Intelligent Systems and Technology   robot in the ∞-norm. Active (non-failed) robots within the
                                         (DCIST) Collaborative Research Alliance (CRA).                                 L-neighborhood are then required to reposition to achieve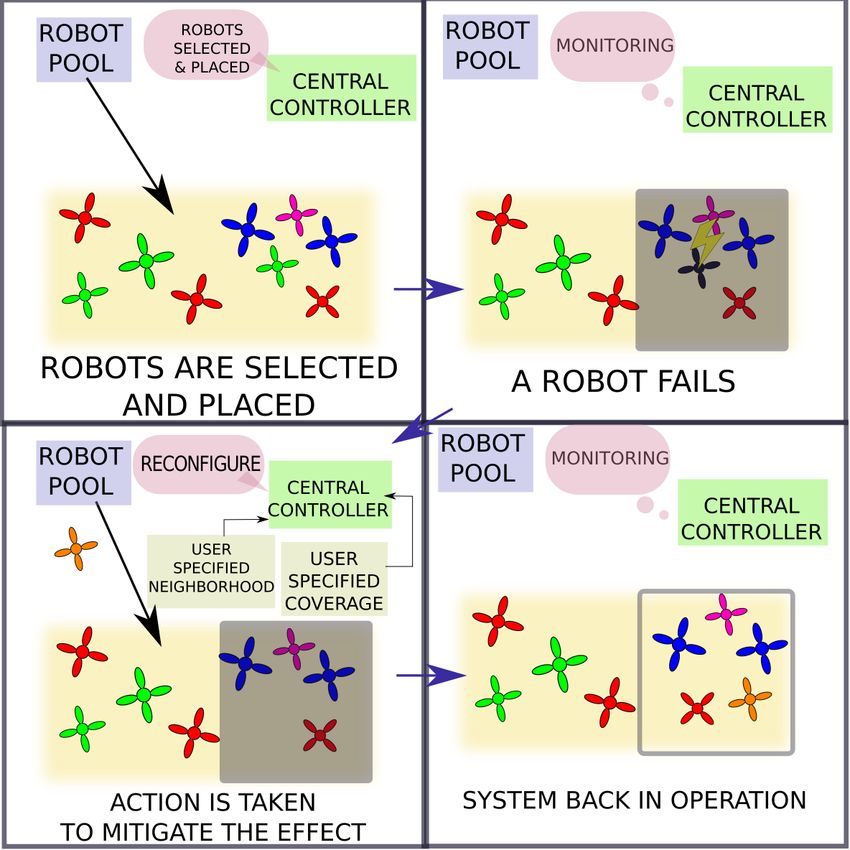
the desired level of coverage demanded by the user. The                          II. P ROBLEM F ORMULATION
coverage requirement is expressed by a single parameter
                                                                    Consider a pool of N ∈ N+ heterogeneous robots labeled
γ ∈ [0, 1] which is defined as the ratio of the coverage
                                                                 as {1, 2, · · · , N } with varying deployment costs and sensing
attained by the robots after repositioning to the coverage
                                                                 ranges. A central controller is tasked with selecting robots
before the robot failure in the L-neighbourhood.
                                                                 from the pool and employing the selected robots to efficiently
   If the robots inside the L-neighborhood fail to attain the    monitor a compact area of interest. We refer to this area
user specified coverage level by repositioning themselves,       of interest as Q ⊂ R2 . The central controller monitors the
then the central controller augments the robot team with a       activities of the selected team and takes appropriate measures
new set of robots to sufficiently meet the user’s demand.        in the event of a robot failure.
Notably, a smaller L would result in faster reconfiguration,        The framework in this paper is presented as solutions to
but may not contribute enough to the coverage demand if the      four problems: (1) initial team selection (2) global placement,
γ value is high. The parameters L and γ help the user to trade   (3) local reconfiguration and (4) intermediate robot selection.
off between the coverage attained and the reconfiguration        Initial team selection deals with the problem of selecting
efficiency when dealing with robot failures. We specifically     the smallest set of robots from the robot pool to perform
investigate this trade-off in this paper.                        the task of monitoring Q while satisfying constraints on the
   Related work. Multi-robot coverage is a well studied topic    cost of deployment and reliability. Once a team is selected,
in robotics [7]–[10]. Following the seminal paper [7], most      it is optimally placed in the region of interest (Q) so that
approaches focus on constructing an objective function com-      the region can be monitored for events of interest. The
monly called a coverage functional. It quantifies the coverage   solution to the global placement problem dictates the optimal
achieved by a robot team and corresponding strategies which      locations for placing the robot team in Q. In the event of
optimize the coverage functional. Although, significant re-      a robot failure, based on the user specified parameters L
search has gone into defining good coverage functionals,         and γ, the central controller tries to compensate for loss in
even extending the idea to non-Euclidean spaces [10], most       monitoring performance by repositioning the active robots
are non-convex and the solutions are only local optima.          in a local neighborhood of the failed robot (specified by
Recently, researchers have started to exploit the diminishing    L). We refer to this as the local reconfiguration problem.
returns property of some functions (submodularity [11])          As the user can specify a desired level of local coverage
for obtaining 1 − 1/e suboptimal solutions using greedy          through the parameter γ, if the local reconfiguration does
strategies [11]–[13]. Similar to the works [12], [13], in this   not yield the level of local coverage demanded by the user,
paper, we use a greedy algorithm to achieve suboptimal           then the central controller selects and places additional robots
coverage over the environment by the robots.                     from the robot pool such that the demanded local coverage
   Resilience in multi-robot strategies is currently an active   is satisfied. Since this robot selection problem occurs during
area of research [1], [14]–[16]. The approach in [1] fo-         the task execution, we call it the intermediate robot selection
cuses on building resilient strategies for multi-robot sweep     problem. We formalize these problems in the forthcoming
coverage problems. In contrast, here we introduce resilient      subsections. Our solutions to these problems are detailed in
strategies to handle robot failures in blanket coverage prob-    Section III.
lems. Section II-B describes the blanket coverage problem in
detail. In [14]–[16], the authors design robust strategies for   A. Initial team selection
task execution assuming at most a certain fixed number of           As mentioned earlier, a central controller is tasked with
robots would fail during the execution of a task. Whereas, in    the process of selecting a team of robots that meet certain
our paper, we consider if some robot fails, how to actively      requirements from the robot pool. One requirement is the
coordinate the remaining robots to compensate for the loss       reliability of the robots in the selected team. We describe
from the failure. We present our framework as four different     the probability that a robot will operate successfully for
problems and our strategies as solutions to these problems.      a given time period [T0 , T ] by using a reliability function
   Notations. We use P(·) to represent the probability of        [17]. The reliability functionR T for robot i ∈ [N ] is defined
occurrence of an event. For any positive integer Z ∈ N+ ,        as, Ri (T0 , T ) = exp{− T0 λi (τ )dτ }, where λi (τ ) is the
[Z] denotes the set {1, 2, · · · , Z}. We use R+ , R≥0 and Rd    instantaneous rate of failure of the robot i due to various
to denote positive real numbers, non-negative real numbers,      factors, e.g., battery drain, processor failure, actuator failure,
and d-dimensional real vectors with d ∈ N+ , respectively.       etc. It is reasonable to assume that λi (τ ) is a non-decreasing
The vector of ones is represented as 1. For any countable        function. We approximate the bathtub model [17] of λi (τ )
set X , |X | denotes its cardinality and 2X is its collec-       with a quadratic function. Specifically, we define λi (τ ) =
tion of subsets or power set. A non-negative set function        λi0 + ki τ 2 . The parameters of this function are computed
f : 2X → R≥0 is said to be submodular if ∀A ⊆ B ⊂ X and          through data fitting [17]. Let tfi denote the random variable
∀x ∈ X \B, f (A ∪ {x}) − f (A) ≥ f (B ∪ {x}) − f (B). The        representing the failure time of robot i. According to our
condition implies that the function has a diminishing returns    reliability model, the failure time of the robot is described
property. Moreover, the function is monotone if ∀A ⊆ B,          as,
f (A) ≤ f (B) and normalized if f (∅) = 0.                                       P(tfi ∈ [T0 , T ]) = 1 − Ri (T0 , T ).         (1)
Therefore, if we assume that robot failures are independent Once a robot team is selected for the task, the central
events, then the probability that a set of S ∈ 2[N ] robots controller has to assign appropriate locations to robots in the
fail during the time interval [T0 , T ] can be computed as
Q selected team such that the coverage over the area of interest
i∈S (1 − Ri (T0 , T )). is maximized. In the next subsection, we formally define the
Suppose a particular task requires a set of J distinct notion of coverage used in this paper and mathematically
resources for its successful execution and γ̄j is the minimum describe our robot placement problem.
amount of resource j ∈ [J] required by the team to perform
B. Global placement
the task. Let Γj : 2[N ] → R+ be a mapping which maps a
robot team to the amount of resource j the team possesses Our formulation of the multi-robot domain coverage prob-
as a whole. In this paper, we assume the Γj has an additive lem is similar to the ones presented in [7], [12]. After obtain-
structure, namely, ing a robot team S with |S| ≤ N by solving Problem 1, the
X coverage problem deals with placing these robots such that
Γj (S) = Γij , (2) the probability of detecting events of interest (e.g. arrival of
i∈S an adversarial target in the area) over an area is maximized.
We proceed by formulating our coverage problem as a
where S ∈ 2[N ] and Γij ≥ 0 is the amount of resource j
blanket coverage problem [18]. The map φ : Q → R+
maintained by robot i. In addition, we define C(S) as the
represents a probability density function which quantifies the
cost of deploying the robot team S. Next we present the first
amount of information or probability of occurrence of an
problem in this paper.
event of interest over Q. In other words, the probability that
Problem 1 (Initial team selection). Find the minimum an event of interest occurred in the region D ⊆ Q can be
number of robots from a pool, such that the selected robot written as:
team is equipped with sufficient resources to monitor a Z
region of interest under the constraints that the total cost P(e ∈ D) = φ(p)dp (9)
D
of deployment is below a budget β and the probability that
all the robots fail before the monitoring task is completed is where P(e ∈ D) represents the probability that an event
below a threshold α ∈ [0, 1]. More formally, of interest occurred
R in D. Consequently, φ(·) has a bounded
support Q and Q φ(p)dp = 1. Denote the set containing the
min |S| (3) positions of robot set S as X|S| = {x1 , x2 , · · · x|S| }, where
S∈2[N ]
xi ∈ R2 . The sensing performance of robot i at a point p is a
subject to, non-increasing function of the distance between p and xi [7].
Consequently, we define the sensing performance function
C(S) ≤ β (4) of the robot i ∈ S as si : R≥0 → (0, 1] as a non-increasing
Y
(1 − Ri (0, T )) ≤ α, T > 0 (5) function of kxi − pk. An example of such a function which
i∈S is used for the simulations in this paper is
X
Γij ≥ γ̄j ∀j ∈ [J] (6) si (kxi − pk) = exp (−ηi kxi − pk), (10)
i∈S
where ηi is the sensing decay rate of robot i. Let the random
where T is the time for which the robots are entrusted with
variable dpi ∈ {0, 1} model the event of detecting an event
the monitoring task.
of interest which occurred at p ∈ Q by robot i, then
For ease of computation, we adopt the following structure (
for the budget constraint (Equation 4): p si (kxi − pk) if p ∈ Ai
P(di = 1|xi , p) = (11)
X 0 otherwise.
C(S) = Ci ≤ β, Ci > 0, (7)
i∈S We use P(dpi ) instead of P(dpi = 1|xi , p) for brevity. If
we assume that the detection probabilities of different robots
where Ci is the cost of deploying robot i. Since in this are independent, then the probability of detection of an event
paper, the task under consideration is coverage, we substitute of interest by the robot team, given that the event occurred
the resource constraint (Equation 6) with the following at a point p, can be computed as,
constraint, Y
X P(∪dpi = 1|X|S| , p) = 1 − [1 − P(dpi )] . (12)
hAi i ≥ δhAQ i, δ > 1, (8) i
i∈S
i∈S
Therefore, the probability of detecting events of interest in
where hAi i is the sensing area associated with robot i and Q by a team of robots, S, is
hAQ i is the area of Q. If ai is the finite sensing range of Z
robot i, then its sensing region is Ai = {p : kxi − pk ≤ ai }. H(X|S| , Q) = P(∪dpi = 1|X|S| , p)φ(p)dp. (13)
Q i
δ is a predefined parameter which determines the amount of
redundancy in the selected robot team in terms of the total Note that this quantity is a measure of the coverage attained
area that the team can ideally cover. by the robots over the environment Q. Also, the coveragefunctional value quantifies the monitoring performance of robotsSsuch that total probability of failure of the new team,
the robot team over Q. We formally define this robot team S new {S \rf } (newly selected robots and the active robots),
placement problem as, is less than α. hAf i is the sensing area of the failed robot.
Problem 2 (Global placement). Given a team of robots, III. M ETHODOLOGY
S, compute their positions X|S| ⊆ Q such that the coverage
functional H(X|S| , Q) is maximized. In this section, we describe in detail the strategies adopted
After the robots, S, reach their appropriate locations in Q by the central controller to solve the problems presented in
dictated by the solution to Problem 2, the central controller Section II.
enters a monitoring mode. It monitors the activities of the A. Robot selection strategies
robot team and initiates actions that enable the robot team
to maintain a user-specified level of coverage when a robot Recall that we consider two types of robot selection
in the team fails. problems in our framework: (1) initial team selection (Prob-
lem 1) and (2) intermediate robot selection (Problem 4).
C. Resilient coordination to robot failure Mathematically, both robot selection problems can be cast
After the global placement, the robot team starts monitor- as mixed integer linear programming (MILP) [19].
ing the environment. As time goes by, robots may fail due to Initial team selection solution. We first describe the
internal and/or external factors, such as the battery drain or MILP associated with Problem 1. Let the vector Π :=
the adversarial attack. We model this failure by Equation 1. [π1 , π2 , · · · , πN ]> denote the collection of binary decision
If a robot fails, it loses its monitoring functionality and stops variables which encode the robot team selection. Then the
contributing to the coverage functional H(X|S| ). The central following MILP formally describes Problem 1 as,
controller employs the standard heart beat signal mechanism minimize 1> Π (17)
[1, Section 4.1] to detect the failure of a robot. The central Π∈{0,1}N
>
controller listens to a periodic heart beat signal send by each subject to [C1 , C2 , · · · , CN ] Π ≤ β (18)
robot and assumes a robot has failed if the controller did not h i>
receive the robot’s heart beat signal within a pre-defined time R̃1 , R̃2 , · · · , R̃N Π ≤ α̃, (19)
interval. We denote the failed robot by rf and the remaining >
[hA1 i, hA2 i, · · · , hAN i] Π ≥ δhAQ i, (20)
active robots in the team by S \ rf . We seek to design a
resilient strategy that can react and compensate for the loss where R̃i = log(1 − Ri (0, T )) and α̃ = log(α). Solving the
from a robot failure by reconfiguring the robots which lie in MILP above yields the solution to Problem 1.
a local neighborhood around the failed robot. Formally, Intermediate robot selection solution. Since Problem 4
is similar in formulation to Problem 1, it can be solved using
Problem 3 (Local reconfiguration). Given that a robot
a similar MILP. Let Πp be vector of length N such that its
failed, reposition the robots in its local neighborhood to
i-th element is 1 if the robot with label i exists in the robot
mitigate the coverage loss caused by the robot failure. We
pool, otherwise 0. Then the MILP formulation for Problem 4
defer the details of this problem to Section III-C.
can be written as:
If the robots in a user-defined local neighborhood around
min 1> Π (21)
the failed robot fails to provide the desired level of coverage Π∈{0,1}N
by reconfiguring, then the central controller selects robots h i>
from the robot pool and deploys them to achieve the desired R̃1 , R̃2 , · · · , R̃N Π ≤ α̃(Tf ), (22)
coverage level. The problem can be described as, >
[hA1 i, hA2 i, · · · , hAN i] Π ≥ hAf i, (23)
Problem 4 (Intermediate robot selection). Π ≤ Πp . (24)
min |S new | (14) Equation 24 ensures that only the robots currently avail-
S new ∈2[N̂ ]
able in the robot pool can be selected. Solving the MILP
subject to, above results in the selection of a minimum set of robots
Y from the the robot pool satisfying the conditions in Prob-
(1 − Ri (0, T − Tf )) ≤ α(Tf ), 0 < Tf < T (15) lem 4.
i∈S new
X
hAi i ≥ hAf i (16) B. Initial placement
i∈S new
After solving Problem 1, the central controller selects an
where S new is the newly selected robot set and [N̂ ] is initial robot team S. The selected robot team is then tasked
the current set of robots in the robot pool. α(Tf ) = to monitor the environment, which we formally describe in
α
(1−Rj (Tf ,T )) with Tf denoting the time instant when Section II-B as Problem 2. The objective is to maximize
Q
j∈S\rf
the failure happens. Note that, α(Tf ) is the maximum the total coverage functional H(X|S| , Q) by finding a set of
probability of failure corresponding to the newly selected |S| placement locations X|S| . Similar to [12], if we finelyAlgorithm 1: Greedy Placement C. Tunable resilient coordination
Input: • Robot team S and ground location set Q̂; In this section, we describe the resilient coordination that
Monitoring function H(X|S| , Q̂).
• the central controller employs to mitigate the effect of robot
Output: Placement set X|S| . failures on the monitoring task. Our resilient coordination
1: X|S| ← ∅ is a combination of the solutions to both Problem 3 and
2: while |X|S| | < N do Problem 4. We refer to this combined solution as tunable
3: s = argmax H(X|S| ∪ {s}, Q̂) − H(X|S| , Q̂) resilient coordination.
s∈Q̂\X|S| In the first step, the robots in a neighborhood of the
4: X|S| ← X|S| ∪ {s} failed robot coordinate to counter the coverage loss due
5: end while to the robot failure (solution to Problem 3). For the failed
robot rf , we refer to the robots inside a neighborhood of
size L around it as its L-neighbors and denote them as
Algorithm 2: Tunable Resilient Coordination RL f . Also, we use N
L
to represent the L-neighborhood.
1: XfL ← ∅ N̂L ⊆ Q̂ is the set of grid cells in Q̂ contained in N L .
[XfL , ∼] = Algorithm 1(RL We denote the robots outside the L-neighborhood of the
2: f , N̂L )
3: X|S\rf | = XfL ∪ XfO failed robot rf as RO f . Notably, the neighborhood size L is
4: if H(X|S\rf | , N̂L )/H(X|S| , N̂L ) ≥ γ then a user-defined tuning parameter, which measures the extent
5: Terminate to which a user wants to utilize the currently active robots in
6: else the team. We first reposition the failed robot’s L-neighbors
7: Request a new robot set S new by solving the MILP (RL f ) using Algorithm 1 to counter the coverage loss through
in Problem 4 a local repositioning RL f inside N̂L . This yields a new set of
RL L new positions XfL for RL f (Algorithm 2, line 2). It is noteworthy
8: f = Rf ∪ S
[XfL , ∼] = Algorithm 1(RL that, after this step, only the positions of RL f change. The
9: f , N̂L )
10: X|S\rf | = XfL ∪ XfO positions of RO f , denoted X O
f , remain unaltered. Thus, we
11: end if obtain a new configuration for the active robots, denoted by
X|S\rf | (XfL ∪ XfO , Algorithm 2, line 3). We denote the
coverage of the current robot team (S \ rf , active robots)
within L-neighborhood by H(X|S\rf | , N̂L ).
discretize Q into a finite collection of W ∈ N+ grid cells as In the second step, we compare the coverage of the
Q̂ = {Q̂1 , Q̂2 , · · · , Q̂W }, then the optimal coverage problem new configuration, H(X|S\rf | , N̂L ), with that of the con-
using at most |S| robots can be expressed as figuration before the robot failure, H(X|S| , N̂L ), in the L-
neighborhood. We denote γ ∈ [0, 1] as a user-defined ratio.
max H(X|S| , Q̂) (25) If H(X|S\rf | , N̂L )/H(X|S| , N̂L ) ≥ γ, the new configuration
X|S| ∈Q̂
is good enough to compensate for the loss and the resilient
s.t. |X|S| | ≤ |S|, Q̂ ⊆ Q. coordination is done (Algorithm 2, lines 4-5). Otherwise, the
central controller solves the MILP (Problem 4) to select a
where H(X|S| , Q̂) is the coverage function defined on the new robot set from the robot pool (Algorithm 2, line 7),
discretized environment Q̂. inserts the new robot set into L-neighborhood of the failed
It turns out that the discrete form of the coverage func- robot (Algorithm 2, line 8), redoes the local repositioning
tional in Equation 25 is a normalized monotone submod- (Algorithm 2, line 9) and obtains the configuration for the
ular function and therefore has the diminishing returns new team (Algorithm 2, line 10).
property [11], [12], [14]. The diminishing returns property Recall that the parameter γ encodes the desired coverage
captures the notion that the more robots participate in a level required by the user. For example, if γ is set to
monitoring task, the less gain one gets by adding an extra 1, then the user forces the central controller to adopt a
robot towards the task. Also, in Problem 2, we consider a strategy that maintains the same level of coverage over the L-
cardinality constraint, i.e., |X|S| | ≤ |S|. That is, we can place neighborhood as before (without the robot failure). A higher
the robots in no more than |S| locations. This is because the value of γ demands a higher level of coverage and possibly
robot team only has |S| robots in total. more new robots from the robot pool.
The maximization of submodular functions under a cardi-
nality constraint is generally NP-hard [11], [12]. However, IV. S IMULATION
a simple greedy algorithm that selects an element with the
maximal marginal gain on the submodular function in each We validate our framework for resilient coverage through
round can give a constant-factor (1 − 1/e) approximation of simulations based on Problems 1-4 and their corresponding
the optimal [11]. We use the greedy algorithm [11] for solv- solutions in Section III.
ing the monitoring problem (Problem 2) in Algorithm 1. The Simulation setup. We generate a pool of 50 heterogeneous
running time of Algorithm 1 can be bounded as O(|S|2 W ). robots with mean-life span: 420, and a standard deviation30 30 30
45
47 33 36 40
38 27
25 25 25 25 25
15 14 14
13 12
20 20 8 20
41
48 34
31 32 31 7
15 9 15 15 32
4
37
10 10 10
6
8
16 22 18
30 3
5 5 26 5
40 29
37 41
47
0 0 0
0 5 10 15 20 25 30 0 5 10 15 20 25 30 0 5 10 15 20 25 30
(a) Initial placement with L = 5 (b) Initial placement with L = 7.5 (c) Initial placement with L = 10
30
30 30 36 40
45
33 25
38 47
25 25 25
12 34
15 14 27
13 25 20
20 20 8
4
48 15 32 18
15 31 32 15 31 14
9 37
10 29
10 10 6
40 16 3 22
30 26 5
5 5
37
41
47
0 0 0
0 5 10 15 20 25 30 0 5 10 15 20 25 30 0 5 10 15 20 25 30
(d) Repositioning with L = 5 (e) Repositioning with L = 7.5 (f) Repositioning with L = 10
Fig. 2: The figures illustrate three simulated failure instants. The failed robots are colored in black and the active robots are
colored in red. The numbers indicate the labels of the robots selected from a pool of 50 robots. The inner dotted square
depicts the local neighborhood. Blue circles indicate regions of high coverage value (≥ 0.97), green circles shows the regions
with coverage value between 0.50 and 0.97.
210 140
14
120
Number of robots requested
205
12
Coverage value
100
Running time
200 10
80
195 60 8
40 6
190
20
185 4
0
L=10 L=15 L=20 L=10 L=15 L=20 2
L=10 L=15 L=20 L=25 L=30
(a) Coverage value (b) Running time
Fig. 3: (a) Comparison of the coverage over the domain for Fig. 4: Number of new robots requested for different local
different neighborhood sizes L. (b) The computational time neighborhood size when γ = 1.
(in seconds) required to find the locations of the robots in
the neighborhood for different neighborhood sizes. α = 0.3 and δ = 1. We select a robot team from a pool of
50 heterogeneous robots to cover a square domain of size
that is 10% of the mean. The reliability function parameters 30 × 30 during a time period, 500. Thus, we set the area of
for each robot are calculated based on its life span [17]. the domain as hAQ i = 900.
The sensing area and the cost of a robot are generated We place the robots in the square domain based on the
proportionally to its life span. We assume that the most positions generated from Algorithm 1. The robots are tasked
expensive robot costs 50 and has a sensing area of 200. We with monitoring the square domain for a time period of 500.
set the parameters in the MILP (Equation 17) as β = 500, To simulate a robot failure, we choose a random time260 60
L=10
Percentage Coverage increase
55
250 L=15
50
L=20
Coverage value
240 45
40
230
35
220 30
L=10 25
210 L=15
20
L=20
200 15
0 5 10 15 20 25 30 35 40 0 5 10 15 20 25 30 35 40
Robots added Robots added
(a) Coverage value (b) Percentage increase
Fig. 5: (a) A plot showing the variation in coverage value of
the team over the domain, when robots are added to a failed
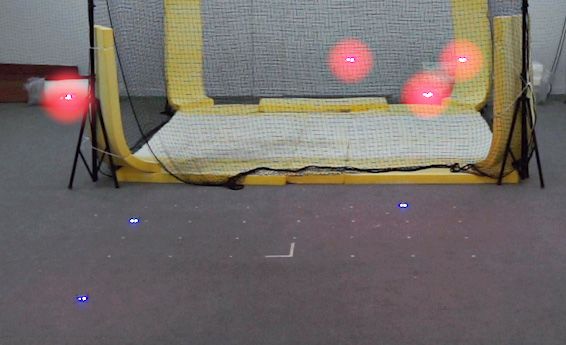
robot’s neighbour and repositioned within the neighborhood, Fig. 6: Demonstration of Algorithm 2 with seven quadrotors.
for different neighborhood sizes L. (b) The plot depicts the Quadrotors highlighted with a red circle are currently active.
percentage increase in the coverage value over the domain Three quadrotors have suffered hardware failures and landed.
for the data presented in Figure 5a. Details of the experiment are available in Section V.
during 0 ∼ 500. At the chosen random time, we pick the 10) the change in percentage increase by adding 40 robots as
failed robot based on the reliability value using a roulette compared to 10 robots is roughly ≈ 5%, while this change
wheel technique [20]. is roughly tripled (≈ 15%) when L = 20. One possible
Results. Figure 2 depicts three random failure instants and reason can be that the coverage functional is submodular
the repositioning of the active robots after a robot failure. In with the diminishing returns property. This means that adding
all cases, the L-neighbors of the failed robot (black dot) try more robots may not substantially increase the coverage
to compensate the coverage loss induced by the failed robot when a large number of robots are already placed in a small
through reconfiguration. neighborhood. Therefore, as a rule of thumb, we propose that
To investigate the trade-off between the size of L- it is better to use a small γ with a small L if the user needs
neighborhood and the coverage attained by repositioning L- to compensate efficiently for a coverage loss. However, if a
neighbors without adding new robots from the pool, we user wants to reach a high coverage, i.e., γ is large, enlarging
simulate 10 trials of random robot failure. In each trial, the size of L-neighborhood can be necessary.
we compute the coverage functional value attained by the
reconfigured robots for different values of L ∈ {10, 15, 20}. V. E XPERIMENT
The results are presented in Figure 3a. Also, Figure 3b shows We demonstrate the practical application of our approach
the computational time required by Algorithm 1 for different on a hardware system with seven quadrotors. Our experiment
values of L. From Figure 3, it is clear that there exists a is built around a real-time implementation of Algorithm 2
trade-off between the coverage value attained through local with γ = 0.0. By setting γ = 0.0, the condition in
repositioning of L-neighbors and the computational time Algorithm 2, line 4 is always true, ensuring that no new
required to compute the reconfiguration. Therefore, a user robots are needed to be deployed to achieve the desired
can utilize this trade-off to choose a preferred neighborhood coverage. This is done purely for the ease of experiment
size, L. implementation. After taking off and moving to a coverage
Moreover, we simulate another 10 trials of robot failure formation, we simulate a sequence of hardware failures in
to quantify the number of new robots added to the local the robot team. When a failure occurs, the affected robot
L-neighbors with γ = 1 in Figure 4. Figure 4 shows immediately begins a landing trajectory. Meanwhile, the
that the number of new robots requested decreases when system queries a human operator to select the neighborhood
the L-neighborhood size increases, which is intuitively true. size L around the failed robot. The user is presented with
Comparing the results in Figure 3 and Figure 4 one could a graphical interface displaying the robots’ positions and an
arrive at the wrong conclusion that adding new robots to illustration of the neighborhood perimeter, allowing them to
achieve the desired coverage is equivalent to increasing L. choose the trade-off between coverage and repositioning cost
We use Figure 5 to throw some light on this misconception. based on the current scenario.
Again, we simulate 10 trials of robot failure. In each trial, Real hardware experiments require a multi-robot motion
a failed robot is chosen randomly and its L-neighbors are planning algorithm to generate collision-free trajectories be-
locally reconfigured. We refer to the coverage functional tween the initial and repositioned placements. Since motion
value of this configuration as the base coverage. Then planning is not the main focus of this paper, we make
using Algorithm 1, we add new sets of robots with sizes several assumptions to simplify this subproblem. First, we
{10, 20, 30, 40} in the L-neighborhood in terms of different assume a homogeneous robot team such that each goal
L values, L ∈ {10, 15, 20}. The coverage values and the position can be filled by any robot in the team. Second,
percentage increase of the coverage over the base coverage we assume that the robots are of negligible size compared
is shown in Figure 5. Figure 5 shows that for a small L (L = to their distances in the coverage formation. These twoassumptions allow a simple motion planning solution using a [3] K. Harikumar, J. Senthilnath, and S. Sundaram, “Multi-uav oxyrrhis
goal assignment that minimizes the sum of distances between marina-inspired search and dynamic formation control for forest fire-
fighting,” IEEE Transactions on Automation Science and Engineering,
each robot’s start position and goal position, and following vol. 16, no. 2, pp. 863–873, 2018.
straight-line trajectories. Such an assignment cannot have [4] E. Ackerman and E. Strickland, “Medical delivery drones take flight
intersecting trajectories except for degenerate cases [21]. in east africa,” IEEE Spectrum, vol. 55, no. 1, pp. 34–35, 2018.
[5] S. Thrun, D. Hahnel, D. Ferguson, M. Montemerlo, R. Triebel,
Our implementation verifies that the trajectories do not pass W. Burgard, C. Baker, Z. Omohundro, S. Thayer, and W. Whittaker, “A
too closely to account for the size of the robots. In the system for volumetric robotic mapping of abandoned mines,” in 2003
general case of heterogeneous robots, or when the robot sizes IEEE International Conference on Robotics and Automation (Cat. No.
03CH37422), vol. 3. IEEE, 2003, pp. 4270–4275.
are large compared to the formation size, a more advanced [6] U. Weiss and P. Biber, “Plant detection and mapping for agricultural
motion planning algorithm such as [22] can be used. robots using a 3d lidar sensor,” Robotics and autonomous systems,
Our experiment is implemented on the Crazyswarm plat- vol. 59, no. 5, pp. 265–273, 2011.
[7] J. Cortes, S. Martinez, T. Karatas, and F. Bullo, “Coverage control
form [23] composed of miniature quadrotors in an indoor for mobile sensing networks,” IEEE Transactions on robotics and
motion capture space, shown in Figure 6. After the operator Automation, vol. 20, no. 2, pp. 243–255, 2004.
chooses the value of L, we generate a new configuration [8] M. Schwager, F. Bullo, D. Skelly, and D. Rus, “A ladybug exploration
strategy for distributed adaptive coverage control,” in 2008 IEEE
using Algorithm 2 and solve the optimal assignment problem International Conference on Robotics and Automation. IEEE, 2008,
using the Hungarian algorithm [24]. Each robot receives its pp. 2346–2353.
new goal position over the radio and executes a smooth [9] M. A. Batalin and G. S. Sukhatme, “Spreading out: A local approach
to multi-robot coverage,” in Distributed Autonomous Robotic Systems
straight-line trajectory using onboard polynomial trajectory 5. Springer, 2002, pp. 373–382.
planning, sensor fusion, and control. A video of this exper- [10] S. Bhattacharya, R. Ghrist, and V. Kumar, “Multi-robot coverage and
iment is available in the supplementary material. exploration on riemannian manifolds with boundaries,” The Interna-
tional Journal of Robotics Research, vol. 33, no. 1, pp. 113–137, 2014.
[11] G. L. Nemhauser, L. A. Wolsey, and M. L. Fisher, “An analysis of
VI. C ONCLUSION approximations for maximizing submodular set functions–i,” Mathe-
matical programming, vol. 14, no. 1, pp. 265–294, 1978.
This article presents a novel centralized framework for [12] X. Sun, C. G. Cassandras, and X. Meng, “Exploiting submodularity
robot team selection and placement in a region such that to quantify near-optimality in multi-agent coverage problems,” Auto-
matica, vol. 100, pp. 349 – 359, 2019.
the coverage over the region is maximized. Additionally, [13] X. Sun, C. G. Cassandras, and K. Gokbayrak, “Escaping local optima
the framework provides a resilient coordination strategy to in a class of multi-agent distributed optimization problems: A boost-
handle robot failures during a monitoring task. In particular, ing function approach,” in 53rd IEEE Conference on Decision and
Control, Dec 2014, pp. 3701–3706.
the framework rearranges the robots in a user-specified local [14] L. Zhou, V. Tzoumas, G. J. Pappas, and P. Tokekar, “Resilient active
neighborhood around the failed robot to attain a user-defined target tracking with multiple robots,” IEEE Robotics and Automation
coverage level. If local repositioning does not achieve the Letters, vol. 4, no. 1, pp. 129–136, 2019.
[15] K. Saulnier, D. Saldana, A. Prorok, G. J. Pappas, and V. Kumar,
desired coverage, the framework augments the robot team “Resilient flocking for mobile robot teams,” IEEE Robotics and
with new robots from a pool to meet the coverage demanded Automation Letters, vol. 2, no. 2, pp. 1039–1046, 2017.
by the user. By specifying the size of the local neighborhood [16] L. Guerrero-Bonilla, A. Prorok, and V. Kumar, “Formations for
resilient robot teams,” IEEE Robotics and Automation Letters, vol. 2,
and the desired coverage level, the user can trade off the no. 2, pp. 841–848, 2017.
amount of coverage attained and the computational time [17] S. B. Stancliff, J. M. Dolan, and A. Trebi-Ollennu, “Mission relia-
required to achieve the desired coverage level. bility estimation for repairable robot teams,” International Journal of
Advanced Robotic Systems, vol. 3, no. 2, p. 24, 2006.
Our framework is validated through simulations and a [18] A. V. Savkin, T. M. Cheng, Z. Xi, F. Javed, A. S. Matveev, and
proof-of-concept experiment using a team of seven quadro- H. Nguyen, Optimal Distributed Blanket Coverage Problem. John
tors. From the simulation results, we infer that adding more Wiley & Sons, Ltd, 2015, ch. 6, pp. 87–95.
[19] A. Schrijver, Theory of Linear and Integer Programming. New York,
robots to the robot team may not always result in sufficient NY, USA: John Wiley & Sons, Inc., 1986.
increase in the coverage due to the diminishing returns [20] T. Back, Evolutionary algorithms in theory and practice: evolution
property of the coverage function. strategies, evolutionary programming, genetic algorithms. Oxford
university press, 1996.
We are currently working on rigorously analyzing the [21] M. Turpin, N. Michael, and V. Kumar, “Capt: Concurrent assignment
interplay between user-defined parameters and the coverage and planning of trajectories for multiple robots,” I. J. Robotics Res.,
performance. A future avenue is to incorporate decentralized vol. 33, no. 1, pp. 98–112, 2014.
[22] W. Hönig, J. A. Preiss, T. K. S. Kumar, G. S. Sukhatme, and
submodular optimization [25] into our framework and study N. Ayanian, “Trajectory planning for quadrotor swarms,” IEEE Trans.
the trade-off between centralized and decentralized compo- Robotics, vol. 34, no. 4, pp. 856–869, 2018.
nents in the framework. [23] J. A. Preiss, W. Hönig, G. S. Sukhatme, and N. Ayanian, “Crazyswarm:
A large nano-quadcopter swarm,” in ICRA. IEEE, 2017, pp. 3299–
3304.
R EFERENCES [24] H. W. Kuhn, “The hungarian method for the assignment problem,”
Naval research logistics quarterly, vol. 2, no. 1-2, pp. 83–97, 1955.
[1] J. Song and S. Gupta, “Care: Cooperative autonomy for resilience [25] R. K. Williams, A. Gasparri, and G. Ulivi, “Decentralized matroid
and efficiency of robot teams for complete coverage of unknown optimization for topology constraints in multi-robot allocation prob-
environments under robot failures,” Autonomous Robots, pp. 1–25, lems,” in Robotics and Automation (ICRA), 2017 IEEE International
2019. Conference on. IEEE, 2017, pp. 293–300.
[2] R. K. Ramachandran, J. A. Preiss, and G. S. Sukhatme, “Resilience
by reconfiguration: Exploiting heterogeneity in robot teams,” in 2019
IEEE/RSJ International Conference on Intelligent Robots and Systems
(IROS), Nov 2019, pp. 6518–6525.You can also read