Restaurant Tra ic Trends Su ary - CANADA - NATIONAL July 1 -31, 2020
←
→
Page content transcription
If your browser does not render page correctly, please read the page content below

Restaurant Tra ic
Trends Su    ary

CANADA - NATIONAL
July 1 -31, 2020
IN RESTAURANTS

                     Corneli, Montreal

                   Click to
                  play video

Canadians are enjoying
the restaurant experience

                  The Station Pub, Calgary

 www.ubmedia.ca                              2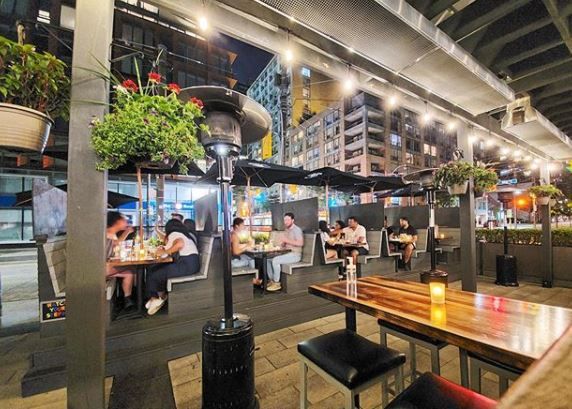
IN RESTAURANTS

                                       Cabana, Toronto

                 Brewster’s Craft Brewery, Regina

www.ubmedia.ca                        July, 2020    3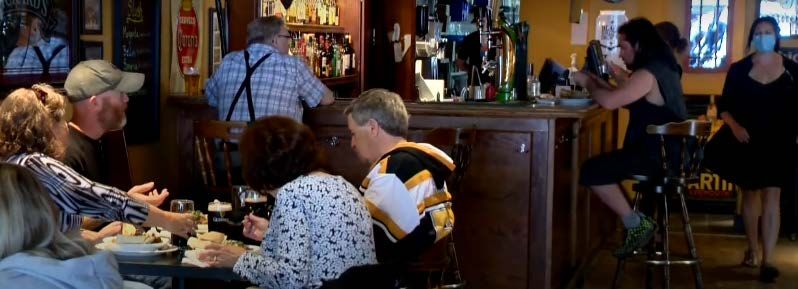
IN RESTAURANTS

O’Hanlon’s Irish Pub, Regina

                               Olympic Billiards, Calgary

www.ubmedia.ca                                       July, 2020   4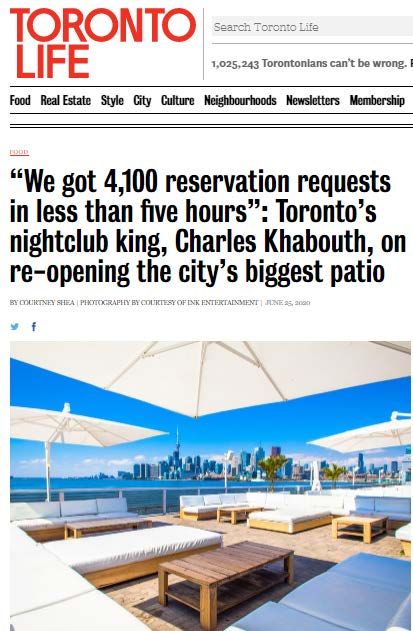
N RESTAURANTS
                         Score on King, Toronto

                 JT’s Bar & Grill, Edmonton

www.ubmedia.ca             July, 2020         5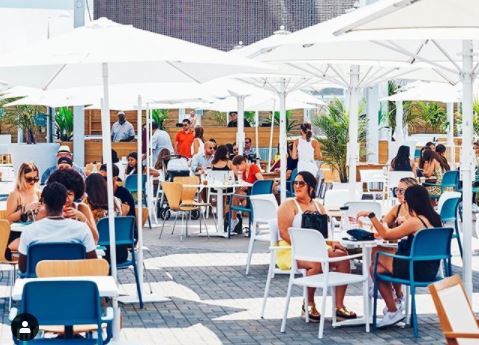
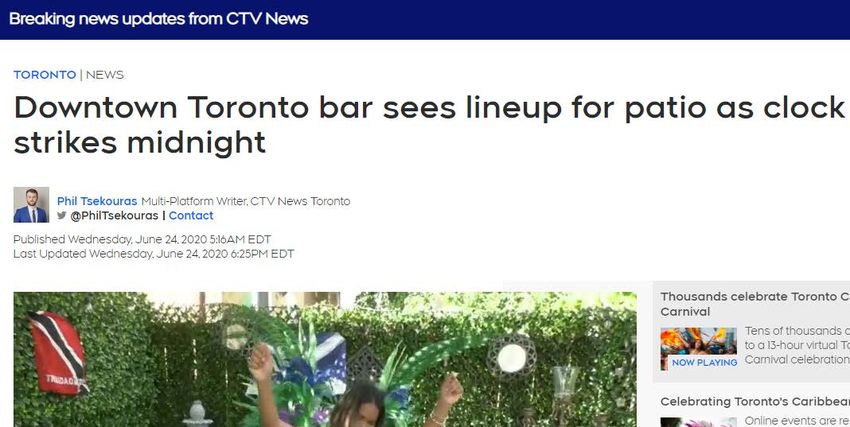
IN THE NEWS

                 July
                 2020

www.ubmedia.ca          6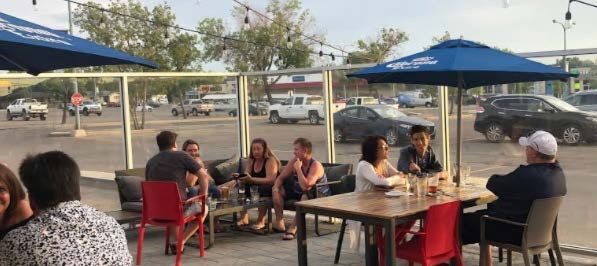
IN THE NEWS

                 July
                 2020

www.ubmedia.ca          7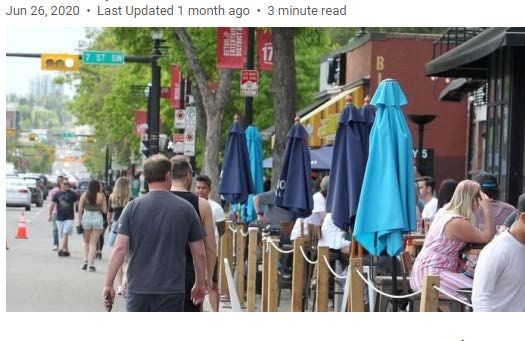
JULY 2020 RESTAURANT
AUDIENCE INSIGHTS OVERVIEW
UB Media commissioned independent third party mobile data reporting to provide in-
depth analyses restaurant visitors from March through July, 2020 in five key markets
nationwide: British Columbia, Alberta, Saskatchewan, Quebec, and Ontario. Multiple
reports provide detailed analyses including traffic, daytime/evening locations,
demographics (census), brand affinity, audience persona, and path to visit. Data was
pulled using device IDs and GPS signals ethically sourced through mobile applications.

British Columbia Executive Summary
Coming out of July, British Columbia is back to its best 2020 pre-COVID traffic levels,
possibly reflective of British Columbians’ confidence in getting back to safely connecting
with friends and family over a pint or some good eats. This is a remarkable improvement,
as BC experienced the most radical decline in traffic of the western provinces measured
when COVID struck. While Friday remains one of the highest traffic days, there is a healthy
uptick in visits on Thursdays when compared to June, as well as a considerable spike in
late afternoon visits. Similar to 2019, over 50% of visitors live/work within five miles of the
restaurants visited, and also reside in Kitsilano, Surrey, Fairview, Arbutus Ridge, and
Yaletown. Friday remains the most popular day to visit with lunch and dinner showing
peak visitation hours.

In 2019, the audience measured was twice as likely to visit a hotel and/or gas station than
the average resident in the market. In 2020 the audience jumps to six and a half times
more likely to visit a hotel within Canada and over two and a half times more likely to visit
a gas/auto station. This suggests that audiences captured may comprise part of the
national trend during COVID: exploring their own ‘back yards’ and playing tourist in
Canada. They’re also twice as likely to shop at brick-and-mortar stores - an interesting
departure from the highly-adopted online shopping habits.

In 2019, Nordstrom Canada was the third most frequented retailer before or after visiting a
restaurant. In 2020, Shopper’s Drug Mart has superseded Nordstrom for the coveted spot.
Banking institutions and Walmart remain high on the list of visits before or after visiting a
restaurant. More than 40% of visitors are parents, over 60% choose a vehicle (car/truck,
male/female average) as their main mode of transportation, and over 25% have an
annual household income of over $100,000. The top five identified audience types include
business travellers, fast foodies, the fitness-minded, online shoppers, and fashionistas.

Alberta Executive Summary
Coming out of July, Alberta continues its strong traffic showing, holding steady at 98%
visitation levels when compared to its best pre-COVID traffic levels in March 2020. Fridays
and Saturdays are the most popular visitation days, with peak visitation hours at lunch
and dinner. Of note, there was an increase in traffic on Thursdays as compared to June,
and a considerable spike in the lunch crowd and at 5 pm.

       www.ubmedia.ca                                                                        8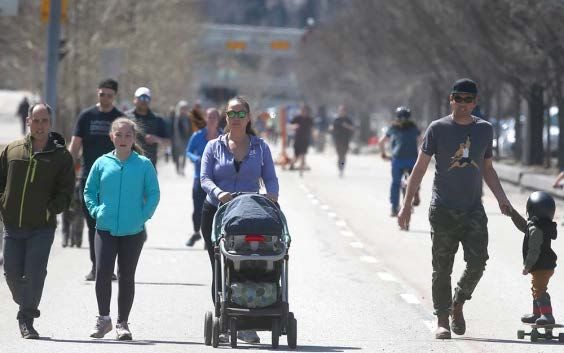
JULY 2020 RESTAURANT
AUDIENCE INSIGHTS OVERVIEW

Cont’d: Alberta Executive Summary
This may suggest that Albertans are getting back to work and/or to their regular lunch
routines and dinner experiences. Visitors to restaurants are almost two and a half times
more likely than the average resident in the market to visit a liquor store and over one and
a half times more likely to visit a grocery store on their way to or from a restaurant.
Most visitors live/work between 1-10 miles of the areas polygoned. Retailers, convenience
stores, and grocery stores are among the top ten locations visited before or after visiting
a restaurant. Demographic comparisons from 2019 to 2020 remain similar: more than 60%
of visitors measured are parents, over 70% (male/female average) use a vehicle as their
main mode of transportation, and approximately 55% have an annual household income
of more than $100,000.
Of further interest, almost 50% of the 18 to 29-year-old portion of the demo captured use
online dating apps for casual dating experiences, and 38% of 30 to 49-year-olds use
similar apps. Rounding out the top five identified audience types are the celeb-obsessed,
fast foodies, online shoppers and parents - perhaps visiting between errands or around
family sporting events.

Saskatchewan Executive Summary
As predicted, Saskatchewan is back to its best March 2020 pre-COVID traffic levels, thanks
to local governments easing restaurant restrictions. Of all the western markets measured,
Saskatchewan shows the most consistent traffic trends year-over-year. Thursday to
Saturday remain the highest visitation days, with 6-9 pm showing peak visitation hours.
‘Night owl’ visits (2-3 am) have shifted to regular dinner and evening visits coming out of
July, as evidenced by the new 4-5 pm and 8-9 pm visitation spikes. This may suggest that
the locals are back to their pre-COVID work/play/rest routines. Visitors to restaurants are
one and a half times more likely to visit a casual dining establishment than the average
resident in the market. More than 25% live/work 1-2 miles away from the areas polygoned.
In both 2019 and 2020 grocery, home improvement, liquor, gas/convenience and QSR
establishments were among the top 10 locations visited before or after dining at a
restaurant. More than 50% of visitors are parents, approximately 80% use a vehicle
(male/female average) to get around, and more than 30% have an annual household
income of over $100,000.

Restaurant visitors in Saskatchewan are nine times more likely than the average person in
the market to visit a liquor store such as the Saskatchewan Liquor Store, and two times
more likely to visit a convenience store such as 7-Eleven. The top five identified audience
types include business travellers, the celeb-obsessed, fast foodies, online daters and
online shoppers.

       www.ubmedia.ca                                                                     9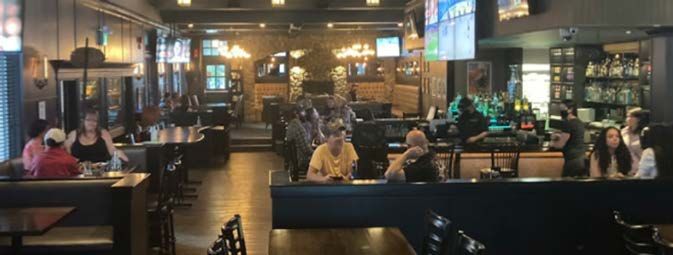
JULY 2020 RESTAURANT
AUDIENCE INSIGHTS OVERVIEW

Ontario Executive Summary
As one of the two provinces nationwide most impacted by COVID, and among the last to
“re-open”, Ontario, and especially the GTA, is demonstrating strong traffic recovery as it
moves through its re-opening phases. In July restaurants were at approximately 80%
traffic compared to the best 2020 pre-COVID levels (March), and are well on their way to
meeting, if not surpassing those pre-COVID levels as summer progresses. Weekends and
Mondays are the most popular visitation days, with peak visitation hours at 8 pm as
compared to 2019 when peak visitation hours were at 6 pm.

The expectation is that peak hours and days may shift as Ontarians head back to work and
lunch crowds increase. Visitors to restaurants are almost one and a half times more likely
to visit a liquor store than the average resident in the market and twice as likely to visit a
gym. Over 20% of visitors live/work within one mile of a venue, and over 25% live/work
between 10-25 miles. In July, Parks Canada topped the list of locations visited before or
after dining at a restaurant. Rounding out the top 10 locations visited before or after dining
in a restaurant in July are retailers, gas stations, big box stores and liquor stores. Over 15% of
the audience captured have a household income of over $100,000 and over 70% walk
and/or use transit. In both 2019 and 2020 restaurants attracted business travelers, fast
foodies, and the fitness minded. July also saw an influx of pet owners and online shoppers.

Quebec Executive Summary
Like most provinces, Quebec experienced the same dramatic drop in traffic in April as its
neighbours, thanks to the pandemic. Coming out of July traffic levels are quickly
approaching best 2020 pre-COVID levels, reaching almost 80%. The expectation is that
Quebec will reach 100% of its pre-COVID traffic levels in August. Of note, in 2019 visitors to
restaurants were two and half times more likely to visit a casual dining venue than the
average person in the market, while in 2020 that likelihood has jumped to three and half
times. In both years, visitors were also twice as likely to visit a grocery store before or after
visiting a restaurant than the average person in the market. Saturday is the peak traffic
day followed by Sunday and Friday, with the highest traffic at lunch and dinner, and
consistent traffic outside of those hours. The main mode of commuting for 68% of the
male audience captured is vehicular followed by over 20% (male/female) using public
transportation. Less than 18% of the audience captured have a household income of
$100,000 or more. In both 2019 and 2020 business travelers, fast foodies and sports junkies
were among the top audiences visiting venues. 2020 has seen an influx of pet owners and
online shoppers. In 2019 the top places visited before or after dining at a restaurant
included La Maison Simons, Sports Experts, Éconofitness, and Hudson’s Bay. In 2020 this
behaviour shifted as evidenced by visits to 7-Eleven, Best Buy, Earls Restaurants and Esso
Canada.

       www.ubmedia.ca                                                                         10
Traffic Trends by Market
This report evaluates the growth in foot traffic to restaurants from March to the end of July,
2020 in five major markets nationwide: British Columbia, Alberta, Saskatchewan, Ontario,
and Quebec.
Highest Traffic Visitation Index
ALBERTA
Lowest
Traffic March 2020 April 2020 May 2020 June 2020 July 2020
Highest Traffic Visitation Index
BRITISH COLUMBIA
Lowest
Traffic March 2020 April 2020 May 2020 June 2020 July 2020
Highest Traffic Visitation Index
SASKATCHEWAN
Lowest
Traffic March 2020 April 2020 May 2020 June 2020 July 2020
www.ubmedia.ca July, 2020 11Traffic Trends by Market
This report evaluates the growth in foot traffic to restaurants from March to the end of July,
2020 in five major markets nationwide: British Columbia, Alberta, Saskatchewan, Ontario,
and Quebec.
Highest Traffic
Visitation Index
ONTARIO
Lowest
Traffic March 2020 April 2020 May 2020 June 2020 July 2020
Highest Traffic Visitation Index
QUEBEC
Lowest
Traffic March 2020 April 2020 May 2020 June 2020 July 2020
Audience sample size:
ON: March to EO July : 4393; PQ: March to EO July: 3337; SK: March to EO July: 1883; AB: March to EO July: 2690; BC: March to EO July: 1292
www.ubmedia.ca July, 2020 12You can also read