Results for the Half Year Ending July 2021
←
→
Page content transcription
If your browser does not render page correctly, please read the page content below
Results for the
            Half Year Ending
                         July 2021

Date:          Embargoed until 07.00hrs, Wednesday 29 September 2021

Contacts:      Lord Wolfson, Chief Executive
               Amanda James, Group Finance Director (analyst calls)
               NEXT PLC                                             Tel: 0333 777 8888

               Alistair Mackinnon-Musson                           Email: next@rowbellpr.com
               Rowbell PR                                          Tel: 020 7717 5239

Photographs:   http://www.nextplc.co.uk/media/image-gallery/campaign-images

                                                                                           1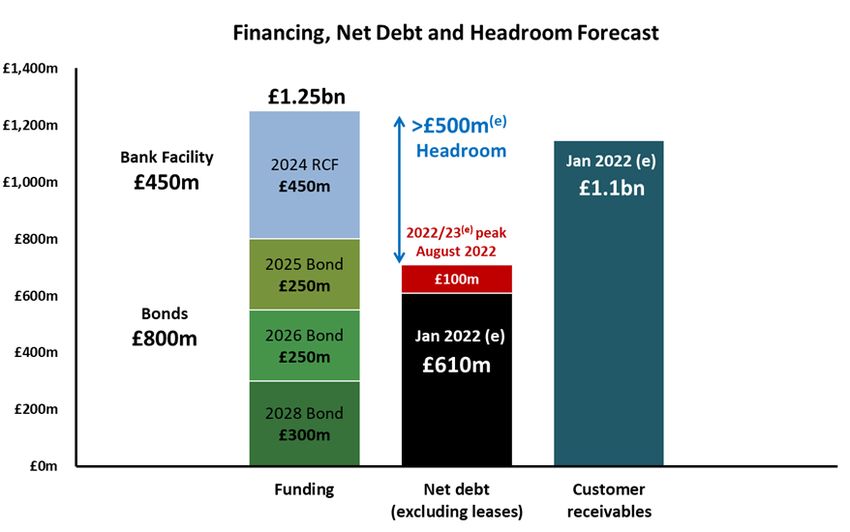
CONTENTS
PART ONE HEADLINES, FINANCIAL SUMMARY AND BIG PICTURE................................................... 3
HEADLINES .................................................................................................................................. 3
FINANCIAL SUMMARY.................................................................................................................. 4
BIG PICTURE ................................................................................................................................ 5
   ONLINE OPPORTUNITIES                                                                                                                     6
   THE BIG UNCERTAINTIES                                                                                                                    8
   THE CHALLENGES AHEAD                                                                                                                     9
PART TWO THREE IMPORTANT QUESTIONS ANSWERED ............................................................. 10
ARE THE CUSTOMERS WE RECRUITED DURING LOCKDOWN HERE TO STAY? ................................ 10
CAN OUR WAREHOUSE CAPACITY COPE WITH THE GROWTH EXPECTED ONLINE? ........................ 12
   MAXIMISING BOXED CAPACITY 2021-2023                                                                                                     12
   PICKING AND CAPACITY FORECAST TO JANUARY 2022                                                                                           13
IS OUR TECHNOLOGY READY? .................................................................................................... 14
   A TECHNOLOGY DRIVEN BUSINESS                                                                                                            14
   LEGACY SOFTWARE - A VALUABLE INHERITANCE AND A CHALLENGE                                                                                14
   TIMETABLE COSTS AND CONTINUED DEVELOPMENT                                                                                               15
   REORGANISATION                                                                                                                          16
PART THREE GROUP FINANCIAL PERFORMANCE AND FULL YEAR GUIDANCE ............................... 17
FIRST HALF SALES AND PROFIT ANALYSIS.................................................................................... 17
   FULL PRICE SALES PERFORMANCE BY MONTH                                                                                                   17
   SALES AND PROFIT BY DIVISION                                                                                                            18
   FIRST HALF LOCKDOWN SALES AND PROFIT IMPACT                                                                                             19
FULL YEAR SALES, PROFIT OUTLOOK AND GUIDANCE .................................................................. 20
   FULL PRICE SALES GUIDANCE                                                                                                               20
   PROFIT GUIDANCE                                                                                                                         20
   STOCK LEVELS, INFLATION, LABOUR SUPPLY AND BREXIT                                                                                       22
PART FOUR
ONLINE, FINANCE AND RETAIL FINANCIAL PERFORMANCE, COMMENTARY AND GUIDANCE ........ 24
NEXT ONLINE ............................................................................................................................. 24
   FULL PRICE SALES BY DIVISION                                                                                                            24
   CUSTOMER RECRUITMENT AND ANALYSIS                                                                                                       25
   ONLINE PROFIT AND NET MARGIN                                                                                                            27
   LABEL                                                                                                                                   29
   ONLINE MARKETING                                                                                                                        32
   TOTAL PLATFORM                                                                                                                          34
NEXT FINANCE ........................................................................................................................... 35
NEXT RETAIL .............................................................................................................................. 38
   FULL PRICE SALES                                                                                                                        38
   RETAIL PROFIT & LOSS                                                                                                                    39
   LEASE RENEWALS AND COMMITMENTS                                                                                                          41
   RETAIL SPACE FORECAST TO JANUARY 2022                                                                                                   42
PART FIVE OTHER GROUP ACTIVITY, CASH FLOW AND NET DEBT ................................................ 43
OTHER BUSINESS ACTIVITIES ...................................................................................................... 43
INTEREST, TAX, PENSIONS AND ESG............................................................................................ 44
   INTEREST                                                                                                                                44
   TAX                                                                                                                                     44
   PENSION SCHEME                                                                                                                          44
   ENVIRONMENTAL, SOCIAL AND GOVERNANCE (ESG)                                                                                              45
CASH FLOW, DIVIDENDS, NET DEBT & FINANCING ...................................................................... 46
   CASH FLOW                                                                                                                               46
   DIVIDENDS                                                                                                                               47
   NET DEBT, BOND AND BANK FACILITIES                                                                                                      47
CAPITAL EXPENDITURE ............................................................................................................... 48
APPENDIX .................................................................................................................................. 49

                                                                                                                                            2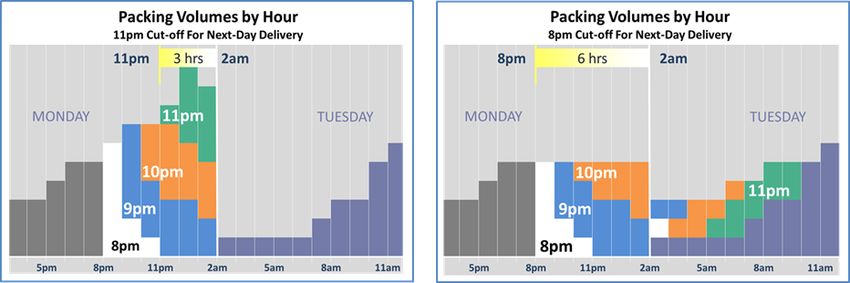
PART ONE
     HEADLINES, FINANCIAL SUMMARY
            AND BIG PICTURE

HEADLINES
Performance in the Six Months to July 2021
      ●   Brand full price sales1 up +8.8% versus 2019 (and +62% against 2020).
      ●   Profit before tax of £347m, up +5.9% versus 2019.

Sales Performance in the Last Eight Weeks
      ●   Full price sales in the last eight weeks were up +20% versus 2019, materially exceeding our
          expectations. This compares with our previous guidance for the second half of +6%.

Upgraded Guidance for the Full Year to January 2022
      ●   We are increasing our full price sales guidance for the rest of the year to be up +10% versus
          2019.
      ●   Forecast profit before tax (post-IFRS 16) now £800m, up +6.9% versus 2019 and +£36m ahead
          of our previous guidance of £764m.
      ●   Year end net debt2 forecast at £610m, a reduction of £502m against two years ago.
      ●   Earnings Per Share forecast to be 516.9p, up +9% versus two years ago.

    NOTES ON THE PRESENTATION OF SALES AND PROFIT
    Throughout this document, unless otherwise stated, comparisons of sales, profit and debt will be
    explained relative to two years ago (2019/20). The disruption to last year (2020/21) from COVID means
    that one year comparisons are generally not meaningful.
    All profit figures given are stated on an IFRS 16 basis. A full explanation of the impact of IFRS 16 is
    given in the Appendix on pages 49 to 54.

1
  Full price sales are Total sales excluding VAT, less items sold in our mid-season and end-of-season Sale events, our Clearance
  operations and through Total Platform. These are not statutory sales (refer to Note 3 of the financial statements).
2
  Net debt excludes lease liabilities.

                                                                                                                               3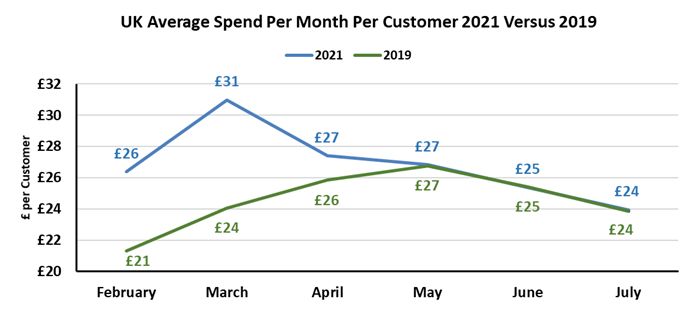
FINANCIAL SUMMARY
Brand full price sales in the first half were up +8.8% on 2019 and Brand total sales3 (including
markdown and Total Platform sales) were up +8.4%. On a statutory basis, total Group sales were up
+5.2%. Profit before tax (post-IFRS 16) was £347m, which was up +5.9% versus two years ago.

SALES BY DIVISION
                                                                                        2 Year                              1 Year
    TOTAL SALES (VAT EX.) £m                   July 2021          July 2019              var %          July 2020            var %
    Online                                        1,522.5           1,004.9              +52%                862.6           +76%
    Retail                                          540.1              874.3             - 38%               344.6           +57%
    Finance                                         119.2              134.0             - 11%               127.9             - 7%
    Brand                                         2,181.8           2,013.2             +8.4%             1,335.1          +63.4%
    Other                                             33.9              45.6             - 26%                21.7           +56%
    Total Group sales                             2,215.7           2,058.8             +7.6%             1,356.8          +63.3%
    Total Group statutory sales                   2,119.5           2,014.5             +5.2%             1,332.7          +59.0%

PROFIT4 AND EARNINGS PER SHARE
                                                                                        2 Year                              1 Year
    PROFIT £m and EPS                            July 2021         July 2019             var %           July 2020           var %

    Online                                            318.0            182.5             +74%                 133.8         +138%
    Retail                                           (17.8)              90.8          - 120%               (144.0)          - 88%
    Finance (after funding costs)                      65.6              75.8            - 13%                 61.6            +6%
    Brand                                             365.8            349.1            +4.8%                  51.4         +612%
    Sourcing, Property and Other5                      11.0              13.9                                (35.0)
    Recharge of interest to Finance                    15.7              17.8                                  17.7

    Operating profit                                  392.5            380.8            +3.1%                  34.1       +1051%
    Lease interest                                   (27.3)            (32.1)                                (29.2)
    External interest                                (18.5)            (21.3)                                (21.4)

    Profit / (loss) before tax                        346.7            327.4            +5.9%                (16.5)
    Taxation                                         (57.1)            (60.5)                                    5.0

    Profit / (loss) after tax                         289.6            266.9            +8.5%                (11.5)
    Earnings Per Share                              226.8p            204.4p          +11.0%                 (9.0)p

3
  Total sales are VAT exclusive sales including the full value of commission based sales (refer to Note 3 of the financial
  statements). The difference in the respective growth of Total Sales and Statutory sales is explained in the Appendix.
4
  Profit by division in July 2020 and 2019 is re-stated for IFRS 16. A full explanation of the impact of IFRS 16 is given in the
  Appendix on page 52.
5
  Other includes Franchise, Lipsy and other Group costs (see page 43).

                                                                                                                               4
BIG PICTURE
WHERE WE STAND TODAY
General Slim’s advice...
General William Slim observed that, in battle, nothing is ever as good or as bad as the first excited
reports would have it6. His observation would have been very helpful for those managing a business
through the pandemic. As it turned out, our gloomiest projections, made at the nadir of the crisis,
were a long way off the mark.
Throughout the pandemic, demand for goods Online was stronger than we could have hoped,
particularly in Home and Childrenswear. This served to fill much of the gap left by Retail store closures,
a trend that appears to have strengthened in the lockdown at the start of this year.
An unexpected post lockdown bounce
When stores opened in mid April, the Retail bounce-back was far stronger than we anticipated. Sales
in Retail stores have done better than planned, while Online sales have fallen back less than we
expected. It appears that the wider economy has not suffered the long term damage many feared,
for the moment at least. And, in particular, employment has held up well.
The positive sales trend has continued through August into the second half, despite significant stock
shortages caused by COVID disruption to international supply chains. As a result (and not without
some embarrassment) we are upgrading our guidance for the fourth time this year.
Things may not be as good as they appear today
It would be wise to heed the other half of the General’s advice; it is almost certain that underlying
conditions are not as good as they currently appear. The combined effect of pent-up demand for
clothing, record savings ratios7, and far fewer overseas holidays has materially boosted sales in recent
months. The impact of these factors must inevitably diminish as time goes on. It also seems likely
that increases in the cost of living, along with the potential effect of seasonal labour shortages on our
delivery service, may moderate demand in the months ahead (see page 22).
But we have the prospect of a return to long term growth
But despite these caveats, stepping back from the noise of day-to-day trading, the longer-term outlook
for NEXT appears to be more positive than it has been for many years.
There are two reasons for this optimism: firstly, the financial drag of our Retail business has
diminished. Secondly, within the last two years the scale and breadth of our Online opportunities
have materially increased. The combined effect of (1) the development of our own NEXT product
ranges, (2) the accelerated increase in our customer base, (3) the growing success of LABEL and (4)
the launch of our Total Platform business, hold out the prospect of a return to long term growth for
the Group.
6
Slim, Field-Marshal Viscount William. Defeat Into Victory, Chapter XII.
7
Saving ratios reported by the ONS for the last four quarters were as follows: 19.9% in Q1 2021; 16.1% in Q4 2020; 14.3%
in Q3 2020; and 25.9% in Q2 2020. This compares to a previous record of 14.4% in 1993.
5ONLINE OPPORTUNITIES
The development of the NEXT Brand continues at pace
Liberated from the physical constraints of the four walls of retail shops, our product teams have
flourished; pushing the boundaries of our designs; with greater choice of fabrics, prints and fits across
a wider range of sizes and over a broader span of prices. In addition, they have expanded into new
product categories, extending the reach of the NEXT brand, from performance sportswear through to
garden furniture.
In all of these efforts we are guided and constrained by one overarching principle - we must genuinely
create value for our customers; whether through better design, improved quality or an unexpectedly
good price - and preferably all three. Simply producing products that are widely available elsewhere
with a NEXT label sewn in, is no recipe for success - we must be, at all times, better by design.
Growing ambitions for LABEL
Alongside the diversification of our own product offer, we have continued to broaden the offer of
third-party Clothing, Home and Beauty goods sold on our website. This has been achieved partly
through the addition of new brands, but mainly through the extension of ranges from existing
partners. In this respect, the proliferation of our Platform Plus operating system, which allows us to
draw on stock only available in our partner’s warehouse for distribution through our own fulfilment
network, has been particularly important (see page 29).
Our ambition remains simple: we want to be our branded partners’ most profitable third-party route
to market. We recognise that LABEL can only be successful if it treats its Brands as valued clients
rather than ‘suppliers’. To that end, in August, we lowered our commission rate on clothing for the
third time in three years; passing on the benefits of the economies of scale we have achieved this year.
We have further enhanced our branded offer through the manufacture of products under licence from
partner brands, such as Baker childrenswear by Ted Baker and Men’s formalwear by Joules. This
business focuses on specialist product areas, such as childrenswear, upholstered furniture and
lingerie. It allows us to combine our experience in product sourcing and product technology, with the
design inspiration of partner brands, delivering products that neither business could produce alone.
Promoting LABEL through co-funded marketing
Up until this year, we have struggled to profitably promote LABEL products through adverts placed on
third-party media. The margin we make on sales generated by these adverts is insufficient to pay for
their cost because, of course, much of the profit rightly goes to our partners.
This year we have successfully collaborated with selected partner brands to co-fund external digital
campaigns. The results have been very encouraging, with both parties making strong returns on
adverts neither would profit from if we funded them alone. We are looking to aggressively extend
this program in the year ahead and hope it will further increase awareness of LABEL’s extensive offer.
6Customer growth and increasing returns on digital marketing
In January of this year, our active8 Online customer base had increased to 8.4m, an increase of 40% in
two years. Of course, lockdown has played a big part in boosting customer numbers. However, we
believe there is also another factor at play here. Over the last few years, we have progressively
increased our investment in marketing professionals, data scientists, and marketing software.
Alongside these investments, we have deepened our working relationships with key digital partners.
The result of these investments has been a sustained increase in the measurable returns delivered by
digital marketing. This has enabled us to materially increase investment, without compromising our
profit hurdles. In the current year, we expect to spend at least £100m marketing Online9, and we
intend to further increase this investment by at least another £15m next year. (See page 32.)
Total Platform is born...
Total Platform takes us beyond the confines of our own website, offering client brands the benefits of
our technology, warehousing, logistics and other infrastructure, for the benefit of their own online
operation. We now have six clients signed up to Total Platform: Childsplay Clothing, Laura Ashley,
Victoria’s Secret10, Aubin, Reiss and GAP11. Four of these clients are successfully trading on the
Platform with the others launching over the next twelve months. See page 34.
The delivery of the Reiss Platform, in Spring 2022, will be our most ambitious and comprehensive to
date. It will materially increase Total Platform’s capabilities, providing services such as delivery to
wholesale customers, concession partners and overseas retail stores, along with a suite of tax and
import functionality, including the provision of bonded UK warehousing.
Equity investments in client brands
In the process of developing this new business, we have come to believe that the potential to create
value for clients is so great, that it is worth the Group investing in new clients as and when they sign
up for the service. To that end, we have acquired equity stakes in Victoria’s Secret UK and Eire (51%),
Aubin (33%), Reiss (25%) and Gap UK and Eire (51%).
8
Active Online customers are those who have placed an Online order or received a standard account statement in the last
20 weeks.
9
Online marketing includes all costs associated with Online advertising and web-creation, including the cost of staffing the
marketing department.
10
This venture is jointly owned with Victoria's Secret parent company, Victoria’s Secret & Co. The JV has a seven year licence
for Victoria's Secret and Pink products in the UK and Eire.
11
This venture is jointly owned with Gap Inc. The JV has a seven year license to sell Gap products in the UK and Eire (see
page 34).
7THE BIG UNCERTAINTIES
There are four big uncertainties as we move forward into the second half of the year. The first is an
internal question about the stability and future performance of the new Online customer base
recruited during lockdown. The other three questions relate to the external environment, and the
extent to which stock shortages, inflation and labour shortages might affect the months ahead.
Are lockdown customers here to stay?
There is a possibility that customers recruited during lockdown, having been forced by necessity to
shop online during the pandemic, will spend less, and not be as loyal as the pandemic recedes. It is
too early to give a definitive answer to this question, but the evidence we have is encouraging. It
suggests that the retention and re-order rates of customers recruited during lockdown are at least as
good as customers recruited in more normal times, if not better (for more detailed analysis see page
10).
Will stock shortages materially affect the business this year?
Disruption to our supply chain means that stock levels are lower than planned and, currently, 12%
down on two years ago. These stock levels are far from optimal and have noticeably affected sales in
some categories and in stores. However, our recent over-performance would imply that the business
as a whole has not materially suffered, perhaps because, with so much choice available, it is easier to
find alternatives on our website. The situation is currently improving and we expect stock to return
to more normal levels by December.
Is cost price inflation pushing up our prices?
Average selling price inflation in the current season is running at around 2%, with price rises focused
mainly on larger Home products. This inflation, driven by rising shipping costs, is more than we would
like but, we believe, not enough to materially restrain sales. Looking to next year we anticipate selling
price inflation of around 2.5% in the first half and that inflationary pressures in shipping will begin to
ease as we move through the second half of next year. For more detailed analysis see the outlook on
page 23.
Will labour shortages affect our operations?
Generally, we have not experienced difficulties in recruiting staff, particularly in our stores. Our main
concern is staffing for the seasonal peaks in warehousing and logistics. Without the contribution of
overseas workers to assist with these peaks, we suspect customer deliveries may take longer to arrive
as we go into the peak trading season. For further analysis and NEXT Comment see page 23.
8THE CHALLENGES AHEAD
Execution is 90% of the battle
It would be a mistake to be overly impressed with the possibilities for NEXT Online without
appreciating the scale of the work required to make a success of them. It is not enough for us to have
a plausible 'strategy'; success will, in the main, depend upon the quality of our execution; on our ability
to adapt and develop our organisation to deliver sensible decisions and actions at every level. Failure
to execute well, in most areas of the business, will materially undermine our ability to grow sales and
profits. In the coming months two areas are of particular importance: Warehousing and Technology.
Ensuring our warehouses keep up with demand
Until we open our new highly mechanised boxed warehouse towards the end of 2023, servicing
growth Online through our existing warehouses will be a challenge. We have meticulously planned
the next two years and continue to invest, innovate, recruit and mechanise to ensure we maximise
capacity within our existing estate. Our warehouse teams have done an outstanding job, and already
delivered significantly more production than we thought possible. Over the next two years we are
confident that we can achieve our ambitions for Online growth and take on a limited number of new
Total Platform clients, but it will require further investment and near perfect execution. See page 12.
Modernising our Technology
If we are to continue to deliver the software at the pace the Company needs, we will have to invest a
considerable amount of time, money and thought in modernising the codebase of all eight of our main
software systems. This process began two years ago, and the aim, over time, is to dramatically
improve our development capabilities alongside improving the scalability of our software.
This is not a high risk big-bang development, but rather, a piece-by-piece rewrite of our systems,
undertaken alongside the continuing development of our legacy code; in such a way that it does not
impede the pace at which we develop new applications for the business. See page 14.
The many other challenges
We do not mean to imply here that Warehousing and Technology are the only executional challenges
we face. They are the biggest, but there are many others. Our product teams must continue to push
the boundaries of their designs; our LABEL business must continue to recruit new clients whilst
increasing our offer with existing brands; we are planning a step-change in the level of our Online
customer service we provide, with all the new skills and technology that requires; Total Platform must
deliver the Reiss and Gap platforms, whilst building a pipeline of potential new clients; our Retail
teams must continue to manage down the costs of our store portfolio whilst developing new and
better ways to complement our Online business; our Online marketing teams must maximise the full
potential of digital marketing whilst rigorously adhering to the financial disciplines that keep their
endeavours profitable....the list goes on!
A daunting but exciting world...
The daunting fact is this: little other than outstanding execution and constant innovation, across the
entire business, will enable us to maximise the ever-changing opportunities and challenges of an
increasingly online world. It is a tall order, but we are in the fortunate position of having that chance.
9PART TWO
THREE IMPORTANT QUESTIONS
ANSWERED
This section focuses on answering three important questions:
● Are the Online customers we recruited during lockdown here to stay?
● Can our warehouse capacity cope with the growth expected online?
● Is our technology ready?
This section seeks to answer each question in turn.
ARE THE CUSTOMERS WE RECRUITED DURING
LOCKDOWN HERE TO STAY?
In the last eighteen months we have seen a significant increase in our customer base. So perhaps the
most important question at this point is how the customers recruited during the pandemic will behave
going forward. It is too early to give a definitive answer, but the initial signs are encouraging with
lockdown customers appearing to perform in a very similar, if not better, way to customers recruited
in more normal times.
Customers recruited last year have now been trading with us for between six and eighteen months
and provide some insight into their ongoing sales per customer and retention rates.
ANALYSIS OF CUSTOMER RETENTION RATES
The table below shows the number of customers recruited in the twelve months to January 2021 and
compares them to those recruited in the year ending January 2019 (i.e. customers recruited before
the pandemic). It is split into four quarterly cohorts.
The second line in both tables shows the number of customers in each cohort that are still active in
September 2021 and September 2019 respectively. The percentage given in the last line in each table
is the retention rate. As can be seen the average retention rates of customers recruited during
lockdown is actually rather better than the historic rates, which is encouraging.
2020/21 Recruitment Feb - April May - July Aug - Oct Nov - Jan TOTAL
Customers recruited 369k 761k 749k 1,431k 3,310k
Still active in Sept. 2021 85k 183k 183k 275k 726k
Retention rate 23.2% 24.0% 24.5% 19.2% 21.9%
2018/19 Recruitment Feb - April May - July Aug - Oct Nov - Jan TOTAL
Customers recruited 436k 451k 496k 806k 2,189k
Still active in Sept. 2019 80k 92k 104k 147k 423k
Retention rate 18.4% 20.4% 21.0% 18.3% 19.3%
10THE OUTLOOK FOR CUSTOMERS GOING INTO NEXT YEAR
We do not expect the same surge in recruitment this year as we experienced last year during the pre-
Christmas lockdown. So, we expect our customer numbers at the end of the year to be no higher
than the numbers in January 2020. However, the quality of the customer base going into next year is
likely to be materially better than at the start.
This is because new customers, and in particular those recruited in the run up to Christmas, have very
low retention rates. This year we are not expecting the same surge in pre-Christmas recruitment, so
the proportion of high quality, established customers should be much greater. This is demonstrated
in the graph below.
11CAN OUR WAREHOUSE CAPACITY COPE WITH
THE GROWTH EXPECTED ONLINE?
The growth in our Online business, along with the addition of new Total Platform customers, has
placed considerable pressure on warehouse capacity. The warehouse closest to its limits is our boxed
garment warehouse which handles around 70% of our Online sales.
In the longer term, additional capacity will be provided by a new, highly mechanised boxed warehouse
(Elmsall 3). This building is currently under construction next to our current site, so that it can be
integrated with existing operations. Phase 1 is planned to be operational in October 2023 and will
increase capacity by +45%. Phase 2, which extends the mechanisation within the new building, is
expected to add a further +45% and we believe this could be delivered within 18 months of deciding
to fit out the additional space.
Over the next two years, the challenge will be to accommodate Online growth within our existing
estate. To that end, we plan to deliver a number of capital projects and changes to working practices
that will materially enhance capacity in our existing warehouses.
MAXIMISING BOXED CAPACITY 2021-2023
2021
Our weekly boxed picking capacity of 3.9 million units is fifteen percent higher than it was two years
ago. During the current year, warehouse capital projects have increased capacity through:
● The addition of a fifth packing sorter, at a cost of £7m, increasing boxed packing capacity by 10%.
● The replacement and upgrading of the reserve to forward conveyor system (at a cost of £5.4m).
● The addition of auxiliary conveyors to improve the warehouse resilience.
● The addition of 40,000 forward picking locations.
2022
In July 2022, floorspace will become available in the shell building of our new Elmsall 3 warehouse.
The plan is to take some of the space not needed for the first phase of mechanisation, and use it to
create additional forward picking locations. A sixth packing sorter will also become operational in our
existing warehouse. Overall, these will deliver a 15% increase in picking capacity which will, amongst
other things, allow us to take on Total Platform operations for Gap (see page 34) and potentially one
further client.
2023
In October 2023 the first mechanised phase of Elmsall 3 will be operational, increasing capacity by
+45%.
12PICKING AND CAPACITY FORECAST TO JANUARY 2022
The chart below shows our boxed warehouse’s weekly picking volumes for the year to date and our
forecast picking for the rest of this year. The dark blue area chart shows weekly full price pick volumes
and the lighter blue area shows markdown pick volumes. The red line shows our picking capacity.
For most of the rest of this year, we expect that demand will be comfortably within our capacity
constraints, though there are likely to be some pressure points in December.
Do we have the capacity to beat our forecasts?
In the event we beat our forecasts, we can operate above our current capacity limits BUT only at the
expense of our service levels. This is because we can bring forward our cut-off time for next-day
delivery, from 11 pm to slightly earlier in the day, and move picking and packing customer parcels
from peak evening hours to a much quieter period in the early hours of the following morning. The
two charts below help illustrate this point.
The chart on the left shows an example of packing volumes by hour (orders placed after 11 pm are
shown in green, orders placed after 10 pm are shown in orange, and so on). With an 11 pm cut-off
for next-day delivery, there is a three hour window to pack all parcels before the 2 am deadline for
leaving the warehouse. The chart illustrates the evening peak and the spare capacity that exists in
the early morning of the next day.
By way of example, by moving to an 8 pm cut-off (the chart on the right), we can move packing
volumes into the early hours of the following day, when there is plenty of capacity. We then have six
hours to pack orders placed before 8 pm for next-day delivery.
13IS OUR TECHNOLOGY READY?
A TECHNOLOGY DRIVEN BUSINESS
A Culture of In-House Development
NEXT has traditionally taken the view that designing and delivering great IT systems is an intrinsic part
of being a great retailer. Over the years we have written almost all of our major operational systems
applications in-house - from tills to websites, warehousing to buying, merchandising, business
reporting, call centres, resource planning, stock allocation and more.
Of course, we buy in some software packages; either to deliver specialist coding routines, such as the
artificial intelligence (AI) behind our website search engine, or for generic functions such as payroll
and general ledger. But it would be as unthinkable for us to contract out our core operational systems
as it would be to contract out the designing of our clothing ranges. It may come as a surprise to many
that we now employ as many people in our Technology teams as we do in our Buying and Merchandise
departments. This is indicative of just how important technology has become to the development of
NEXT’s business.
LEGACY SOFTWARE - A VALUABLE INHERITANCE AND A CHALLENGE
The Inheritance
NEXT’s repository of bespoke specialist retail software, alongside the ability to rapidly adapt and
design those systems, has been central to the development of our Online business. So much so, that
we are beginning to deploy those systems through Total Platform for the benefit of other brands who
want to turbocharge the development of their online businesses.
We believe that this in-house first approach to building retail applications has meant that we have
been able to deliver better systems, at less cost and greater speed. But the relentless focus on
delivering new applications and constant modification of existing systems has left us with a significant
challenge. The reality is that many of our legacy systems, though robust and effective, are becoming
more and more inefficient to develop.
The Nature of the Challenge
The layers of historic code are making the development of new code more difficult. In particular, the
interdependence of our systems within large monolithic coding structures, means that a change in
one application can have unforeseen consequences in other systems. This makes testing and
deploying new systems take much longer than it should. And in a world where the business can often
only move as fast as its technology, that is a hindrance.
The Solution
Two years ago we began the process of modernising our website software, which is now well
underway for our E-commerce platform. As set out in our results presentation in March 2020, the
process does not involve a big-bang rewrite of the entire system, with all the risks and costs involved
in such developments. Instead, we are taking a step-by-step approach, redeveloping individual
modules of code that are written and released to run alongside a (progressively smaller) legacy
system.
Vitally, the modernisation process segregates code into discrete ‘containers’, independent
applications (‘products’) that can be adapted and changed without the need to retest the whole
system. As this process continues, this endeavour will give us the ability to design, build, test and
deliver systems at a faster rate and lower cost than ever before.
14TIMETABLE COSTS AND CONTINUED DEVELOPMENT
Timetable
Over the next four years we plan to modernise all eight of our major system domains. The timetable
is set out in the chart below (we have split E-Commerce into major and minor projects).
Costs
We currently estimate that the capital and revenue costs for this year and the next two years will
amount to £466m, of which £112m will be capitalised. The graph below puts these modernisation
costs into context, showing expenditure over the last three years.
Time and Tide Wait for None
NEXT’s IT systems cannot afford to stand still while its platforms are modernised over the next three
years. So we will continue delivering new applications on legacy systems whilst rewriting those
systems in the background. Inevitably, there will be some wasted code - new applications developed
in our legacy systems will have to be rewritten a short time afterwards in new code. We think it is a
price worth paying; the retail environment is not going to stand still while we modernise, so nor can
we. The costs of this parallel development have been factored into our modernisation costs.
15REORGANISATION
The twin challenges of modernising our software whilst continuing to develop new applications
requires us to rethink how we organise our Technology teams.
Explanatory note: Confusingly for a retailer, in the technology sector software applications are
normally referred to as ‘products’ and we have adopted that convention here. So bear with us
- when we refer to products in this section we are referring to software applications not
garments!
Project to Product Based Structure
Over the last six months we have begun the process of reorganising the way in which our Technology
teams are structured. This involves moving from a project-based management structure, where teams
are geared up to managing individual projects that might range across a number of different
applications, to an application or product-based structure.
In yesterday’s world, where applications rarely changed, it made sense to organise scarce systems
resources to serve individual projects. Today, most applications are in constant flux and business
processes are ever more complex. So, developers need a forensic understanding of the code and the
business processes their products facilitate. Our new structure retains knowledge where it is most
useful and allows them to focus on the constant improvement of their part of the business.
Aligning and Enhancing our Infrastructure Expertise
We are also reorganising the Infrastructure teams that manage our network, mainframe, till and cloud
technology. This reorganisation has two elements:
● The alignment of our Infrastructure engineers to sit alongside the Development product areas
they serve.
● The addition of greater expertise through the recruitment of senior specialists (architects) in
all critical infrastructure technologies. This will make us less dependent on external advice
and ensure that we engineer the latest infrastructure technologies into new developments.
Recruitment and Rewards
In the last four years we have doubled our developer resource to around 500 employees and, in total,
our Technology team has grown to around 1,100. In order to make our roles more attractive, we have
recently reviewed the Technology grading structure, career paths, benefits and starting salaries. The
aim is to create an environment where good people can advance their careers in a department
teeming with opportunities.
16PART THREE
GROUP FINANCIAL PERFORMANCE
AND FULL YEAR GUIDANCE
FIRST HALF SALES AND PROFIT ANALYSIS
FULL PRICE SALES PERFORMANCE BY MONTH
Brand full price sales in the first half were up +8.8% versus 2019.
Full price sales were down in February and March, when most of our Retail stores were closed for ten
weeks. They recovered strongly once the majority of our stores reopened on 12 April, boosted, we
believe, by pent-up demand in April and very warm weather in June.
Full price sales in the second half have also started strongly. We believe that August and, to some
degree, the beginning of September were boosted by more people taking holidays in the UK. For the
rest of the year we are forecasting full price sales to increase by +10% which is more in line with the
sales growth we saw in July and September.
17SALES AND PROFIT BY DIVISION
Brand total sales12 (including markdown and Total Platform sales) were up +8.4%. On a statutory
basis, total Group sales were up +5.2%. Profit before tax (post-IFRS 16) was £347m, which was up
+5.9% versus two years ago.
SALES BY DIVISION
2 Year 1 Year
TOTAL SALES (VAT EX.) £m July 2021 July 2019 var % July 2020 var %
Online 1,522.5 1,004.9 +52% 862.6 +76%
Retail 540.1 874.3 - 38% 344.6 +57%
Finance 119.2 134.0 - 11% 127.9 - 7%
Brand 2,181.8 2,013.2 +8.4% 1,335.1 +63.4%
Other 33.9 45.6 - 26% 21.7 +56%
Total Group sales 2,215.7 2,058.8 +7.6% 1,356.8 +63.3%
Total Group statutory sales 2,119.5 2,014.5 +5.2% 1,332.7 +59.0%
PROFIT13 AND EARNINGS PER SHARE
2 Year 1 Year
PROFIT £m and EPS July 2021 July 2019 var % July 2020 var %
Online 318.0 182.5 +74% 133.8 +138%
Retail (17.8) 90.8 - 120% (144.0) - 88%
Finance (after funding costs) 65.6 75.8 - 13% 61.6 +6%
Brand 365.8 349.1 +4.8% 51.4 +612%
Sourcing, Property and Other14 11.0 13.9 (35.0)
Recharge of interest to Finance 15.7 17.8 17.7
Operating profit 392.5 380.8 +3.1% 34.1 +1051%
Lease interest (27.3) (32.1) (29.2)
External interest (18.5) (21.3) (21.4)
Profit / (loss) before tax 346.7 327.4 +5.9% (16.5)
Taxation (57.1) (60.5) 5.0
Profit / (loss) after tax 289.6 266.9 +8.5% (11.5)
Earnings Per Share 226.8p 204.4p +11.0% (9.0)p
12
Total sales are VAT exclusive sales including the full value of commission based sales (refer to Note 3 of the financial
statements). The difference in the respective growth of Total Sales and Statutory sales is explained in the Appendix.
13
Profit by division in July 2020 and 2019 is re-stated for IFRS 16. A full explanation of the impact of IFRS 16 is given in the
Appendix on page 51.
14 Other includes Franchise, Lipsy and other Group costs (see page 43).
18FIRST HALF LOCKDOWN SALES AND PROFIT IMPACT
Estimating Lost Sales
Estimating lost sales during lockdown is not straightforward. It is necessary to take a view of what
Retail stores would have taken were they to have been open and how much sales Online benefitted
from the store closures. For the purposes of this exercise, we have assumed that, versus 2019:
● Retail sales would have been -12%, a compound annual growth rate (CAGR) of -6%.
● Online sales would have been up +30%, a CAGR of +14%.
Estimated Loss of Profit in Retail
We estimate Retail lost around c.£250m of full price sales whilst stores were closed, recovering £20m
from pent-up demand once they reopened. This would have resulted in Retail lost profit of -£86m, as
explained in the table below.
£m (e) Sales Profit impact
Sales lost during 10 week lockdown (250) (135)
Sales gained from post-lockdown pent-up demand 20 10
Net impact of lockdown (230) (125)
Business rates relief15 20
Other cost savings during lockdown (utilities and
maintenance) 5
Central costs recharged to the Online business 14
Estimate of Retail profit impact from lockdown (86)
Estimated Profit Gained Online and Total Impact
We estimate that Online gained c.£155m of full price sales which, after accounting for (1) the benefit
from the lower returns rate during lockdown (see page 26) and (2) additional recharges from Retail,
boosted profit by +£66m.
So, for the Group, we estimate that the profit impact of lockdown was around -£20m as set out in the
table below.
£m (e) Sales Profit impact
Online sales over-achievement 155 60
Benefit of lower returns rate 20
Central costs recharged from Retail to the Online business (14)
Estimate of Online profit impact from lockdown 155 66
Estimate of Retail profit impact from lockdown (230) (86)
Estimate of lost Group sales and profit (75) (20)
15
Business rates relief claimed only for the period of time the stores were closed. The £29m of business rates relief the
Company is entitled to in this financial year, for the period the stores have been open, will be returned to the Government
(see page 41).
19FULL YEAR SALES, PROFIT OUTLOOK AND GUIDANCE
FULL PRICE SALES GUIDANCE
Forecast For the Rest of the Year in Context
We have increased our full price sales estimate for the rest of the year from up +6%, to +10%. The
table below shows the full year figures in the context of what we have achieved in the first half and
second half to date, along with our forecast for the rest of the year.
Full price sales 2021/22 versus
2019/20 (2 years)
First half +8.8%
Second half to date +20%
Rest of year +10%
Second half +12.4%
Full year +10.7%
Full Year Forecast by Division
Our guidance for full year full price sales is set out by business division in the table below.
Full year
Full price sales 2021/22 versus 2019/20 (2 years) H1 actual H2 guidance guidance
Online +55% +34% +44%
Retail - 40% - 11% - 25%
NEXT Finance interest income - 11% - 5% - 8%
Total full price sales +8.8% +12.4% +10.7%
PROFIT GUIDANCE
Full year Versus Previous
Profit before tax, EPS and net debt guidance 2019/20 guidance16
Group profit before tax £800m +6.9% £764m
Earnings Per Share 516.9p +9.4% 494.1p
Year end net debt (excluding lease liabilities) £610m - 45% £610m
16
The previous guidance of £764m, given in our July Trading Statement, is on an IFRS 16 basis and is comparable with the
new guidance of £800m. July’s Trading Statement gave guidance both pre-IFRS 16 (£750m) and post-IFRS 16 (£764m).
All profit figures are now given post-IFRS 16.
EPS guidance was not issued in our July Trading Statement, the figure quoted was our forecast at that time.
20FULL PRICE SALES AND PROFIT MOVEMENTS
The graphic below sets out how the forecast change in full price sales in each business division is
expected to impact on profit, relative to 2019/20, along with the cost savings and cost increases we
are forecasting for the full year.
COST SAVINGS AND COST INCREASES FOR THE FULL YEAR (e)
A summary of the significant cost savings and cost increases is summarised below.
Cost savings £m Jan 2022 (e)
Catalogues and photography +30
Fully depreciated assets +25
Lower occupancy costs and other Retail savings +24
Lower Online returns rate (£20m in H1) +24
Business rates relief +20
Lower external interest costs +9
Other Group savings +8
Total cost savings +140
Cost increases £m Jan 2022 (e)
Inflation (including wage inflation) - 40
Staff incentives - 33
Warehousing and distribution - 15
NEXT Technology - 15
Freight - 15
Lower clearance rates - 11
Other cost increases -6
Total cost increases - 135
21STOCK LEVELS, INFLATION, LABOUR SUPPLY AND BREXIT
Brexit
The financial and operational costs of Brexit have not been material for NEXT, mainly as a result of
the extensive preparation undertaken over the last three years. The only meaningful increase in costs
is from inflated brokerage costs, levied by freight forwarders and third-party customs agents,
amounting to around £5m. We expect to eliminate the majority of these costs by next year through
renegotiation and potentially bringing some processes in-house.
Stress in the Supply Chain
Over the last few months, the combination of resurgent demand in developed economies, alongside
continuing COVID disruption in factories and shipping routes, has delayed deliveries and produced a
sharp spike in ‘spot’ shipping prices.
Inflation Today
NEXT had pre-purchased the majority of this year’s shipping requirements, so the squeeze on
transport prices only affected around 15% of our shipments. These increases have added around 2%
to average selling prices in the second half, with large Home goods bearing the brunt of the increase.
Stock Levels Today
For the last few months stock levels have been below optimal and are currently -12% down against
two years ago, though part of this shortfall results from the over-performance against our sales
targets.
With stock levels so low, we need to ask how we have managed to exceed our sales expectations at
all? We think the answer lies partly in just how strong demand has been post lockdown. But we also
suspect that, Online at least, we can now manage with lower stock covers; because the breadth of
choice on our website is at the point where many stock-outs can be substituted with a similar
alternative item.
Steady Improvement and Forward Looking Prices
International supply chains are steadily improving, as shipping backlogs clear and factories return to
more normal levels of operation. Looking ahead to next year, the price of future shipping contracts is
falling and already much lower than today’s spot prices. The graph below shows NEXT stock levels
(excluding LABEL) through the year and our forecast looking forward. As can be seen we are already
recovering from the low point and expect stock levels to return to more normal levels as we go into
December.
22Outlook for Prices in the Year Ahead
We expect cost price inflation in the first half of next year to average at +2.5%, with fashion prices
rising +1% and Homeware by +6%.
We anticipate cost price inflation to rumble on through most of next year, albeit at levels that are not
overly worrying. So perhaps inflation will be rather less temporary than official guidance might
suggest, but certainly not as concerning as some of the more excited reports we read.
Labour Shortages
As yet, we are not experiencing material difficulties in recruiting for stores and most head office
functions. However, some areas of the business are beginning to come under pressure, most notably
staffing for peak seasonal demand in warehousing and logistics. We anticipate that, without some
relaxation of immigration rules, we are likely to experience some degradation in our service in the run
up to Christmas.
NEXT COMMENT
The HGV crisis was foreseen, and widely predicted for many months. For the sake of the wider UK
economy, we hope that the Government will take a more decisive approach to the looming skills
crisis in warehouses, restaurants, hotels, care homes, and many seasonal industries. A demand
led approach to ensuring the country has the skills it needs is now vital.
23PART FOUR
ONLINE, FINANCE AND RETAIL
FINANCIAL PERFORMANCE,
COMMENTARY AND GUIDANCE
NEXT ONLINE
FULL PRICE SALES BY DIVISION
The table below sets out the full price sales performance of our main Online divisions (NEXT Brand
UK, LABEL UK and Overseas) in the first half and by quarter.
Q1 Q2
Full price sales £m July 2021 July 2019 Var % var % var %
NEXT Brand UK 685 469 +46% +63% +29% note 1
LABEL UK 338 199 +70% +71% +67% note 2
Total UK Online 1,023 668 +53% +65% +41%
Overseas (nextdirect.com) 290 194 +49% +59% +36% note 3
Overseas aggregators 54 18 +210% +152% +271% note 4
Total Overseas 344 212 +62% +67% +56%
Total Online full price sales 1,367 880 +55% +65% +44%
There are four points of potential interest to note in the quarterly performance table on the right-
hand side:
1. Online sales growth of NEXT UK branded products markedly retreated when our stores
reopened, explaining the discrepancy in growth between Q1 and Q2.
2. LABEL UK sales did not appear to be affected much by the reopening of Retail stores, suggesting
that there is not a great deal of high street competition for our LABEL UK business.
3. Overseas, we believe that much of the discrepancy between Q1 and Q2 is explained by the
earlier timing of Eid, which brought sales forward from Q2 to Q1.
4. Overseas aggregators, such as Zalando (including Zalando Fulfilment Solutions), Otto and
others, are an increasingly important channel of growth. Growth accelerated in Q2 as result of
increasing stock levels.
24CUSTOMER RECRUITMENT AND ANALYSIS
Credit, Cash and Overseas Customers
Customers can be divided into three distinct groups, each of which have very different characteristics:
● UK Credit customers who pay through a NEXT credit account17 (nextpay or next3step).
● UK Cash customers who pay using credit, debit or other tender types.
● Overseas customers trading through our international websites.
The table below explains how our customer base has developed over the last two years in terms of
total customer numbers, sales per customer and total sales value. We do not have visibility of the
customers trading through overseas aggregators, but have added sales through these sites to the
table below for completeness.
AVERAGE CUSTOMERS SALES PER CUSTOMER SALES VALUE
First half 2021 2019 % 2021 2019 % 2021 2019 %
UK Credit 2.7m 2.6m +7% £256 £204 +25% £701m £525m +34%
UK Cash 3.7m 2.0m +85% £88 £72 +22% £322m £143m +125%
Overseas 1.9m 1.3m +45% £148 £145 +3% £290m £194m +49%
Aggregators - - - - £54m £18m +210%
TOTAL 8.3m 5.9m +42% £157 £147 +7% £1,367m £880m +55%
Spend Per Customer
In the UK, growth has been driven by increasing numbers of active customers and a more than 20%
increase in sales per Credit and Cash customer. We believe that the increase in spend per customer
was driven by a combination of lockdown, which served to transfer spending from shops, and the
effect of increasing the breadth of our offer.
The graph below shows the average spend per customer by month for H1 2021 and H1 2019. It can
be seen that spend per customer decreased this year once lockdown was lifted and was in line with
two years ago.
17
Both NEXT credit offers are authorised and regulated by the FCA.
25The Benefit of Low Return Rates
The first half benefitted from much lower returns rates (31% versus 41% two years ago). This meant
that although full price sales were up +55%, the value of stock dispatched was up only +34%. This
resulted in a saving of £20m from reduced handling costs. This change was due to two factors:
● The mix of stock being ordered. For example, more low-returning Home and Childrenswear
and less high-returning formalwear and dresses.
● An underlying change in customer behaviour.
We calculate that around 70% of the fall resulted from the change in the mix of products sold, with
the balance coming from a change in customer behaviour. As the pandemic recedes, our product mix
and returns rates have returned to more normal levels. This is demonstrated in the chart below,
which shows weekly returns rates versus two years ago.
The solid blue line shows the observed returns rate this year, the dotted blue line shows the returns
rate we would have expected from the mix of products dispatched this year. The gap between these
lines represents the change in consumer behaviour, and shows how this effect has diminished over
time.
Online Deliveries and Returns via Retail Stores
During the pandemic more customers elected to have goods delivered to home, rather than stores.
This trend has slowly reversed as life returns to normal, as shown in the table below. It remains to be
seen whether this trend will continue if and when more people return to working in offices.
Percentage serviced by Retail stores Pre-pandemic March 2021 Sept 2021
Orders 49% 32% 36%
Returns 83% 56% 72%
TOTAL 55% 34% 44%
26ONLINE PROFIT AND NET MARGIN
Profit and Net Margin by Division
Change in margin
Online division Total sales £m Profit £m Margin % vs July 2019
NEXT Brand UK 780 205 26.3% +6.0%
LABEL UK 373 62 16.6% +2.1%
Overseas 352 50 14.1% - 2.6%
Total Platform 18 1.3 7.4%
Total Online 1,522 318 20.9% +2.7%
The movements in margins in each division from 2019 are shown in the right-hand column and are
explained as follows:
● NEXT Brand UK profitability improved due to savings made in catalogue production (+£19m),
significantly lower returns rates (+£15m), and leverage over fixed costs.
● LABEL UK profitability also improved due to significantly lower returns rates (+£5m) and
savings made in catalogue production (+£3m).
● Overseas margin has declined primarily due to COVID related distribution surcharges (-£11m).
● Total Platform launched during 2021. Net margin of 7% is in line with our profitability target
of between 5% and 8%. For clarity, this profit excludes any equity related profit (see page
34).
27Online Margin Analysis
Overall Online margin in the first half has improved from 18.2% to 20.9%. The margin impact of major
cost categories is summarised below.
Net margin on total sales to July 2019 (IFRS 16 basis) 18.2%
Bought-in gross Bought-in margin reduced for three reasons: - 1.4%
margin (1) significant disruption in the shipping industry resulted in much
higher freight costs (see page 22). This reduced margin by -0.4%.
(2) a higher proportion of sales came from lower margin third-party
LABEL brands, reducing margin by -0.7%.
(3) the increased participation of NEXT Childrenswear and Home
products reduced gross18 margin by -0.3%.
Lower surplus Surplus stock was only up +12%, compared to full price sales growth of +1.0%
+55%. This improvement (though slightly lessened by marginally lower
end-of-season Sale clearance rates) increased margin by +1.0%.
Warehousing & Margin improvement as a result of: +0.6%
distribution (1) lower returns rates (+1.3%).
(2) leverage over fixed costs (+0.1%).
(3) COVID related freight surcharges for overseas parcels (-0.8%).
Catalogues and We are no longer printing catalogues, which improved margin by +1.9%
photography +1.5%. Photography costs did not increase in line with sales, boosting
margin by a further +0.4%.
IT IT costs were up +30%, as we increased our investment in Technology +0.4%
teams and projects (see page 15). However, this increase was less
than the increase in sales, increasing margin by +0.4%.
Central costs Central costs, including our contact centre and head office +0.2%
departments, did not increase in line with sales, boosting margin by
+0.2%.
Net margin on total sales to July 2021 (IFRS 16 basis) +20.9%
Forecast for Online Sales and Profit for the Full Year
Full price Online sales in the first eight weeks of the second half were up +43% versus two years ago
and are forecast to be up +32% for the rest of the year. This would result in full price sales being up
+44% for the full year. Based on this forecast, we estimate that Online profit will be around £590m,
with an operating margin of around 20% (versus 19.1% two years ago).
18
NEXT Childrenswear and Home have lower bought-in gross margins than adult clothing, but as a result of
lower returns rates they achieve comparable net margins.
28LABEL
In the first half, LABEL full price sales were up +70% versus two years ago, adding £139m to the
turnover of the Group. This section gives more detail on the shape of the business and how it is
developing.
Analysis of LABEL Growth
Drivers of Growth
The following four developments have accelerated the growth of LABEL sales during the first half of
the year:
● Platform Plus significantly broadened our offer. This technology enables us to sell stock
located in our partners’ warehouses which we collect and distribute to customers through our
network (generally) within two days.
● The addition of third-party Home product ranges.
● The growth of our Branded Beauty offer.
● The development of Licensed product ranges in conjunction with partner brands.
Contribution to Growth by Product Category
The table below sets out the growth in full price sales by category.
Full price sales £m July 2021 July 2019 Var %
Fashion: clothing, footwear and accessories 195 126 +54%
Sports 79 49 +61%
Home 45 17 +170%
Branded Beauty 19 7 +184%
Total full price sales 338 199 +70%
Contribution to Growth Made by New and Continuous Brands
We have added 320 new brands over the last two years and, in the last six months, new brands include
Reiss, Laura Ashley, and Beauty brands including MAC, Bobbi Brown and Tom Ford.
The table below shows the contribution to the £139m increase in LABEL turnover made by new and
continuous brands, broken down by product category. New brands, though important, are only
contributing around a third of our growth, with the lion’s share of growth coming from developing
our offer from existing brands (particularly through Platform Plus).
Beauty stands out, with the addition of new brands making a huge difference. We expect to add more
brands later this year and anticipate the Beauty business will turnover c.£55m in the year.
Full price sales growth vs July 2019 £m New brands Continuous brands Total
Fashion: clothing, footwear and accessories + 29 + 40 + 69
Sports +1 + 29 + 30
Home + 13 + 15 + 28
Branded Beauty +8 +4 + 12
LABEL full price sales growth + 51 + 88 + 139
Contribution to full price sales growth +26% +44% +70%
29Growth of Commission Versus Wholesale Brands
Over 60% of LABEL’s full price sales were achieved through brands that operate on a commission
basis. As summarised below, commission sales grew faster than wholesale brands. The commission
model remains our preferred mode of operating and continues to offer partner brands the prospect
of higher growth rates along with improved net margins.
Full price sales £m July 2021 July 201919 Var %
Commission 212 113 +88%
Wholesale 126 86 +47%
LABEL full price sales 338 199 +70%
The Increasing Importance of ‘Platform Plus’
The advantages of Platform Plus are that it gives us access to a much broader assortment of stock
whilst ensuring we can take ownership of customer service from the moment the goods leave a
partner’s warehouse. More recently we have developed Platform Plus to help optimise the items we
have available in our own warehouse. The system now pre-emptively orders additional units of
popular Platform Plus items, where we anticipate there is a high probability of another future sale.
Two Ways of Working
Our Platform Plus model allows customers to order items stocked in our partners’ warehouses and
are, generally, delivered through our distribution networks. Platform Plus functions in two ways:
● Delivered by NEXT: These items are collected from our partners’ warehouses and delivered
through our logistics network, so that they can be consolidated with other items in the same
order and delivered, generally within two days of order.
● Direct dispatch: These are typically large Home items, not ordered with other items, which
can be dispatched directly to the customer without the risk of de-consolidating an order.
We have refined our direct dispatch process to allow goods to be collected by NEXT’s designated
carriers (as opposed to being delivered through partners’ carriers). This has two advantages. Firstly,
it generally achieves a lower overall delivery cost. More importantly, it gives us much greater visibility
and control of the delivery process and associated service.
A Dramatic Increase in Capability and Sales
Our Platform Plus technology is now live with almost 250 brands, and is expected to account for
£116m (15%) of LABEL sales, compared with £25m (5%) two years ago. The tables below show how
sales and the numbers of brands connected have increased since 2019/20.
Jan 2022 (e) Jan 202020 Jan 2022 (e) Jan 2020
£m sales £m sales No. of brands No. of brands
Delivered by NEXT 75 11 +593% 140 44 +218%
Direct dispatch 41 14 +203% 105 69 +52%
Total 116 25 +375% 245 113 +117%
19
Please note that the table categorises sales according to whether a brand was trading as wholesale or commission in the
six months to July 2021, therefore July 2019 figures are restated to give a like‐for‐like brand performance.
20
Platform Plus sales and brands for Jan 2020 have been restated. Sales of some NEXT products that are Direct Dispatch
are no longer being classified under Platform Plus because their sales are reported within NEXT UK, not LABEL UK.
30You can also read


