Results Presentation for 2H2020 and the Period from 6 February 2020 (Listing Date) to 31 December 2020 - 1 February 2021
←
→
Page content transcription
If your browser does not render page correctly, please read the page content below
Results Presentation for 2H2020 and the Period from
6 February 2020 (Listing Date) to 31 December 2020
1 February 2021
Important Notice
This announcement is for information only and does not constitute or form part of an offer, invitation or solicitation of any offer to
purchase or subscribe for units in Elite Commercial REIT (“Units”) in Singapore or any other jurisdiction nor should it or any part of it
form the basis of, or be relied upon in connection with, any contract or commitment whatsoever. This presentation may contain
forward-looking statements that involve assumptions, risks and uncertainties. Actual future performance, outcomes and results may
differ materially from those expressed in forward-looking statements as a result of a number of risks. Representative examples of
these factors include (without limitation) general industry and economic conditions, interest rate trends, cost of capital and capital
availability, competition from other developments or companies, shifts in expected levels of occupancy rate, property rental income,
charge out collections, changes in operating expenses, property expenses, governmental and public policy changes and the
continued availability of financing in the amounts and the terms necessary to support future business.

You are cautioned not to place undue reliance on these forward-looking statements, which are based on the Manager’s current view
on future events. No representation or warranty express or implied is made as to, and no reliance should be placed on, the fairness,
accuracy, completeness or correctness of the information or opinions contained in this presentation. Neither the Manager nor any of
its affiliates, advisers or representatives shall have any liability whatsoever (in negligence or otherwise) for any loss howsoever
arising, whether directly or indirectly, from any use of, reliance on or distribution of this presentation or its contents or otherwise
arising in connection with this presentation.

The past performance of Elite Commercial REIT is not indicative of future performance. The listing of the Units on the Singapore
Exchange Securities Trading Limited (“SGX-ST”) does not guarantee a liquid market for the Units. The value of the Units and the
income derived from them may fall as well as rise. The Units are not obligations of, deposits in, or guaranteed by Elite Commercial
REIT, the Manager or any of their respective affiliates. An investment in the Units is subject to investment risks, including the possible
loss of the principal amount invested. The Unitholders have no right to request the Manager to redeem or purchase their Units while
the Units are listed. It is intended that Unitholders may only deal in their Units through trading on the SGX-ST.

 Oversea-Chinese Banking Corporation Limited ("OCBC") and UBS AG, Singapore Branch ("UBS") are the joint issue managers for
 the Offering. OCBC, UBS, CGS-CIMB Securities (Singapore) Pte. Ltd. and China International Capital Corporation (Singapore) Pte.
 Limited are the joint bookrunners and underwriters for the Offering (collectively, the "Joint Bookrunners").

                                                                                                                                         1
Contents
• Financial Highlights
• Portfolio Overview & Operational Highlights
• Capital Management
• Maiden Portfolio Acquisition Since Listing
• Outlook
• Details & Timeline of Distribution
• Appendix

                         Crown House, Grantham   Upper Huntbach Street, Stoke On Trent
                                                                                         2
Financial Highlights
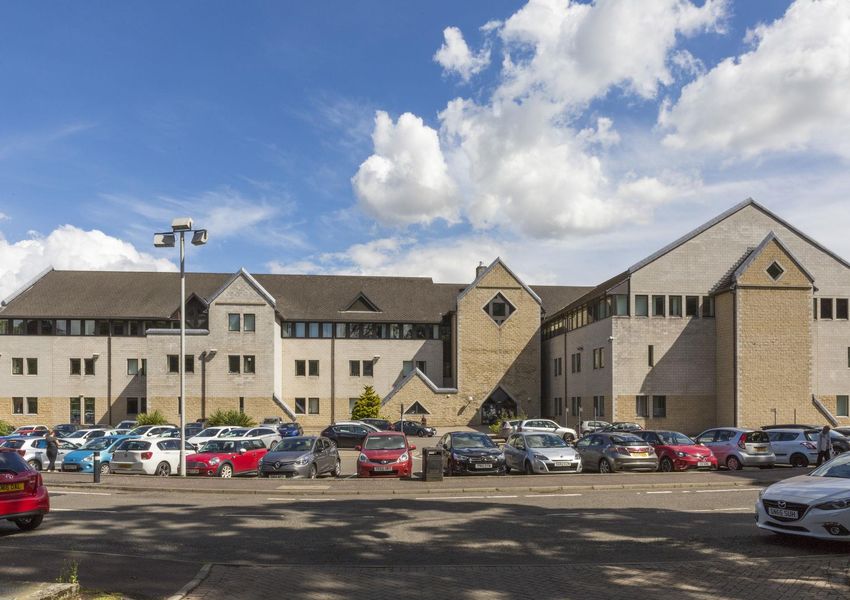
Parklands, Falkirk
3
Outperformance in a challenging environment
6 February 2020 (Listing date) – 31 December 2020

• Outperformance of actual distributable income to unitholders and DPU against IPO Forecast
  – Actual distributable income to unitholders exceeds 2.1% : £14.8 million vs £14.5 million
  – Actual DPU exceeds 2.3%: 4.44 pence vs 4.34 pence

• Uplift in portfolio valuation
  – Fair value gain of investment properties of £15.9 million
  – Fully occupied as of 31 December 2020

• Stable cashflow with approximately 100% rent collection achieved in advance, despite UK
  lockdowns and Brexit
  – Collected over 99.6% of rent in advance for the period of January to March 2021
  – Backed by AA-rated tenant (the UK Government) with DWP’s uniquely counter-cyclical operations
     despite Brexit and UK’s battle against COVID-19
• Resilient portfolio with enhanced income visibility
  – 82.5% of the 97 assets in the portfolio are used to provide key front-of-house services, primarily
     Jobcentre Plus unemployment services
  – Secured waivers/ extension of break option for two properties, enhancing income visibility

• Prudent capital management and strong balance sheet
  – Adequate working capital and debt headroom to meet ongoing obligations
  – No refinancing requirements till FY2024
  – Sound aggregate leverage and interest coverage ratios
                                                                                  St Andrew’s House, Hexham   4
Key Highlights
6 February 2020 (Listing date) – 31 December 2020

                                                                                       2H2020                                                            6 Feb to 31 Dec 2020

                                                              Actual1                 Forecast2                  Variance                    Actual1                  Forecast2                 Variance
                                                               £’000                    £’000                       %                         £’000                     £’000                      %

  Revenue                                                     11,647                     11,701                        0.5                    20,963                     20,985                       0.1

  Profit before tax3                                          24,196                      8,292                      191.8                    29,099                     13,019                     123.5

  Profit after tax3                                           19,497                      6,899                      182.6                    23,358                     10,521                     122.0

  Income available for
  distribution to                                              8,340                      8,105                        2.9                    14,841                     14,536                       2.1
  Unitholders

  Distribution per unit
                                                                 2.49                      2.42                        2.9                      4.44                       4.34                       2.3
  (“DPU”) - pence

Notes:
1. Unaudited consolidated financial results for 2H2020 and from Listing Date to 31 December 2020 are the first reporting periods incorporating the results of the Initial Portfolio held by Elite Commercial REIT.
     Although Elite Commercial REIT was constituted on 7 June 2018, the initial public offering was completed on 6 February 2020 which was the official listing date of Elite Commercial REIT.
2. Other than unit issue costs which were charged to the statement of comprehensive income, the forecast results for the period from the Listing Date to 31 December 2020 was derived by pro-rating the
     forecast results as disclosed in the Prospectus.
3. Actual profit before tax includes fair value gains on investment properties of £15.9 million while the profit after tax includes the net fair value gains on investment properties of £12.3 million.              5
Strong Balance Sheet
As at 31 December 2020

                                                                                                                                                                £’000

                   Non-current assets                                                                                                                          311,8551

                   Current assets                                                                                                                              21,034

                   Total assets                                                                                                                              332,889

                   Non-current liabilities                                                                                                                    107,826

                   Current liabilities                                                                                                                           7,905

                   Total liabilities                                                                                                                         115,731

                   Net assets / Unitholders’ funds                                                                                                           217,158

                   Units in issue and issuable (‘000)                                                                                                        333,858

                   Net asset value per unit (£)                                                                                                                   0.65

Notes:
1. Non-current assets comprise investment properties, which are stated at fair values based on the valuations as at 31 December 2020 prepared by Colliers International Valuation UK LLP

                                                                                                                                                                                           6
Portfolio Overview &
Operational Highlights

                         Nutwood House, Canterbury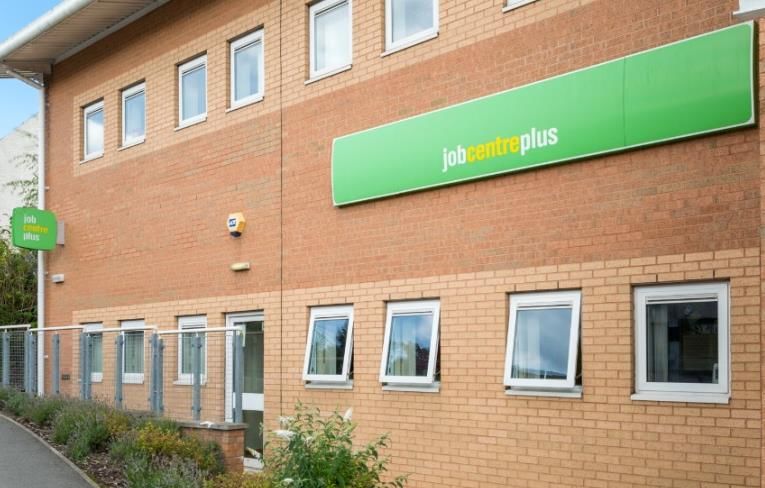
Steady and Resilient Cash Flow Underpinned by
Uniquely Counter-Cyclical Tenant
• Over 99.0% of rental income is derived from triple net leases with the UK Government, which has:
  – One of the lowest debt-to-GDP ratios amongst the G7 countries
  – Ratings of AA and Aa2 by S&P and Moody’s respectively

• Received in advance 99.6% of the rent for the period spanning across the months of January to
  March 2021, within 7 days of the due date
  – Consistently achieved approximately 100% of rent collection in advance since listing, notwithstanding
     UK lockdown and Brexit
• Portfolio income visibility enhanced:
  – Lodge House, Bristol – break option not exercised, lease will expire on 31 March 2028
  – John Street, Sunderland – extended the break option by 12 months to 31 March 2022

• Minimal business disruption caused by COVID-19
  – Jobcentre Plus (“JCP”) locations remained open throughout the nation’s first, second and third
     lockdowns to process and disburse benefits to claimants
  – COVID-19 situation does not trigger force majeure or termination clauses of the leases with the UK
     Government
  – The UK Government have committed to increase the number of work coaches at job centres to 27,000
     by March 2021 as part of an economic recovery package

                                                                                                            8
First & Only UK-Focused S-REIT with Over 99% Leased to the
AA-rated UK Government1
97 99% Long WALE Properties are 100%
Office Assets Freehold2 7.3 years3 Unencumbered
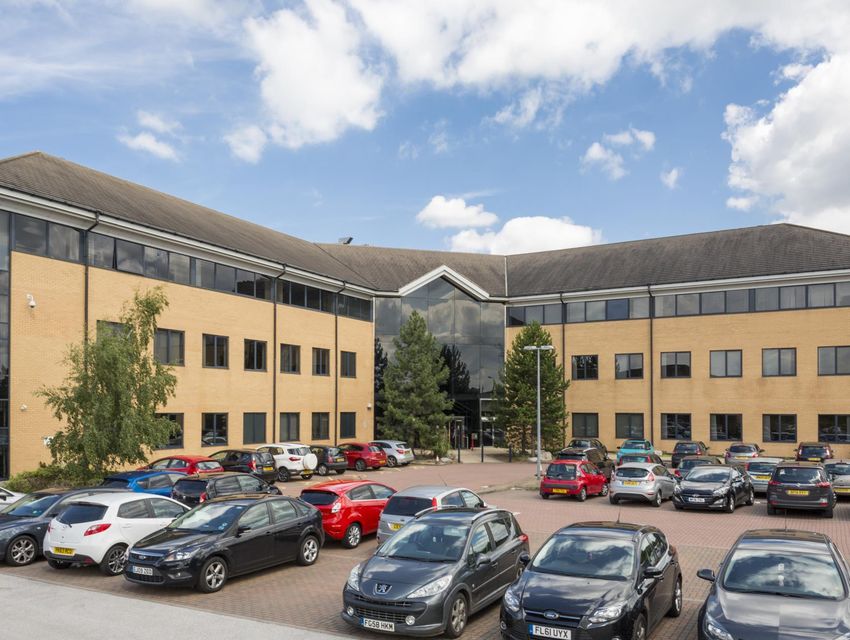
High Road, Ilford Holborn House, Derby Glasgow Benefits Centre, Glasgow
Blackburn Road, Burnley Parklands, Falkirk Peel Park, Blackpool
Notes:
1. The leases are signed by the Secretary of State for Housing, Communities and Local Government, which is a Crown Body
2. 96 properties are freehold properties and one Property is on a long leasehold tenure expiring on 19 May 2255 (c.235 years remaining)
3. As at 31 December 2020 9Geographically Diversified Portfolio and Occupied by DWP
Population Density
Densely Populated Areas • Key occupier is Department for Work &
Less Densely Populated Areas Pensions (DWP), UK’s largest public service
department
– Responsible for welfare,
pensions and
Dundee child maintenance policy
Glasgow Edinburgh – Over 20 million claimants; £191.8 billion
benefit spent in FY19/20
Newcastle – Services provided primarily via Jobcentre
Sunderland
Plus centres
Blackpool • Full Repairing and Insuring Leases: Tenant
Liverpool
Manchester
(UK Government) is responsible for the full
Nottingham
maintenance and repair of external, internal
and structural format of the property and
Birmingham
landlord (Elite Commercial REIT) has no
Milton Keynes
repairing or insuring liability
Cardiff London
Bristol
• Built-in upside from inflation-linked rental
Plymouth uplifts2
Brighton
Notes:
1. Including mixed use properties with a medical centre, back office or retail component in addition to the Jobcentre Plus
2. The leases to the UK Government have rent reviews in the fifth year (2023) based on the UK Consumer Price Index (“CPI”), subject to an annual minimum increase of 1.0% and maximum of 5.0% 10Portfolio is Used to Provide Crucial DWP Services
Over 20 million >£9,000 A ministerial
DWP benefits Spend p.a. per DWP
department, Integral to the
claimants in FY19/20 claimant supported by 14 social fabric of the
(~1/3 of the UK (31% of UK median agencies and public UK
population) wage) bodies
Front of house – 82.5%1 of Portfolio, primarily Jobcentre Plus and other ancillary services
1 Jobcentre Plus - Usage highly correlated with unemployment
• Staff readily on hand to assist customers with mock interviews, “Back to Work” plan, etc.
• Computers and free wifi for customers to job-surf, write CVs or make claims
2 Pension Services - Usage expected to increase as population ages
• Face-to-face meetings to claim benefits
• IT training to assist retirees with no internet access or difficulty using online services
3 Child Maintenance Services - Stable usage regardless of economic conditions
• Face-to-face meetings to discuss more complicated child maintenance cases
• Registration and declaration of child maintenance received
4 Disability Services - Stable usage regardless of economic conditions
• Onsite medical examination centres as part of the Work Capability Assessment for disability benefit
• Training programmes such as Specialist Employability Support and Work and Health Programmes
Back of house – 17.5%1 of Portfolio, various support functions without public-facing element
5 Support functions – Usually larger, critical centres for supporting the administration of DWP services
• Service roll out planning (e.g. Universal Credit)
• Claims processing, finance and accounts
• Fraud detection and investigation
• Call centre & IT support
Note: Source: Independent Market Report, Department for Work & Pensions
1 Based on number of assets 11Well-located, Predominantly Freehold Office Assets
Proximity to bus stops
Centrally 74% located in town centres, city centres and 70 Average walk:
Located1 suburbs 2.2 minutes
Number of properties
Easily 100% within 10 minutes walk from bus stop 19
6
Accessible1 0 2
60% within 15 minutes walk from train station
5 5 4 3 2 1
Notes:
96 properties are freehold properties and one Property is on a long leasehold tenure expiring on 19 May 2255 (c.235 years remaining)
1 Percentage based on number of properties
2 Supermarkets comprises small to large supermarkets
3 Medical facilities comprise hospitals and general practices 12
4 Schools comprise primary schools, secondary schools and independent schoolsCapital Management
Tannery House, AlfretonPrudent Capital Structure and No Refinancing Requirements
till FY2024
31.0% Aggregate Debt Maturity Profile (£ m)
Leverage
Effective interest rate
of ~1.9%; 36.8
% 50% of borrowings on
fixed rate
7.7x interest coverage
ratio
103.2
Properties are 100%
unencumbered
2020 2021 2022 2023 2024 2025 and
Minimal FX exposure beyond
as assets and liabilities Term Loan Facility Undrawn Capacity
are GBP denominated
14Resilient Trading Performance Amid COVID-19 & Brexit
120%
ELITE: -2.9%
% change in unit price /index value
100%
FTSREI: -10.6%
STI: -11.1%
80%
60%
40%
ELITE STI FTSREI
15Maiden portfolio acquisition
since listing
Crown House, Worthing
16Proposed Acquisition
– reinforces the Manager's investment strategy
58 commercial properties Summary of the New Properties
primarily leased to UK
Government entities, Agreed Value £212.5m
with a WALE of 7.4
years(1) No. of assets 58
Agreed Value of £212.5m, Occupancy 100%
with a transaction
structure which provides WALE(1) 7.4 years
completion certainty
regardless of Equity Fund % of annual GRI from UK Government tenants 98.8%
Raising
% of value in London 35.9%
% of Freehold (by NIA) 92.3%
• Received Unitholders’ approval (99.99%) during an EGM held on 25 January 2021 in relation to the
Proposed Acquisition:
– Approve the Proposed Acquisition, as an interested person transaction
– Approve the issue of Consideration Units
– Approve the proposed transfer of a controlling interest to Elite UK Commercial Fund II as a result of the issue of
Consideration Units; and
– Approve the proposed Whitewash Resolution
Notes:
1 As at 14 August 2020, by annual GRI 17Rationale for the Proposed Acquisition
Executing the Manager's stated growth strategy at IPO
1. Extends the REIT's exposure to UK sovereign credit, whilst diversifying occupier mix
2. Stable cashflows and CPI-linked growth from uniquely counter-cyclical occupier
3. Increases exposure to London
4. Increases size, market cap, free float and liquidity
5. DPU accretive, with attractive yields relative to Existing Portfolio
Portfolio Quality Size and Liquidity DPU Accretion
36% London exposure(1) 67% increase in total assets 3.2% DPU accretion(3)
5 new UK Government tenants 57% increase in market cap(2)
Notes:
1 By Colliers valuation as of 14 August 2020
2 Assuming no Equity Fund Raising and Elite Commercial REIT finances the acquisition through the issuance of Consideration Units, bank borrowings and a Vendor Loan, the increase in market cap is 43% based on
the 10d VWAP of £0.6398, as of 16 October 2020
3 Assuming no Equity Fund Raising and Elite Commercial REIT finances the acquisition through the issuance of Consideration Units, bank borrowings and a Vendor Loan, the DPU accretion is 8.3%
18Outlook Holborn House, Derby
Outlook
 • Analysts forecast a GDP contraction of 1.5% in Q1 2021 while the Office for Budget Responsibility
    opined that UK GDP will be 4% lower in the long-term

 • DWP’s claimant count more than doubled to 2.7 million in November 2020 with increased
    utilisation of its services.

 • Approximately 2.4 million people on the government’s furlough scheme as at September 2020.
    Unemployment rate is expected to increase once the furlough scheme ends in April 2021; to peak
    at 7.5% by mid-year

 • Elite Commercial REIT continues to provide stable income to its unitholders as COVID-19 has
    minimal impact on business and rent collection

 • The Manager remains focused on strengthening the portfolio and will closely monitor the market
    to explore opportunities for growth via yield-accretive acquisitions
   – Granted a right of first refusal to acquire properties in Sponsor’s
      pipeline, most of which have been leased long-term by various
      ministries of the UK government

                                                                                    Tannery House, Alfreton
                                                                                                              20
Details and Timeline
of Distribution
Nutwood House, CanterburyDetails and Timeline of Distribution
For Period From 1 July to 31 December 2020
Distribution per unit – pence 2.49 pence
10 February 2021 (Wednesday),
Ex-Date(1) & Time
9.00 a.m.
11 February 2021 (Thursday),
Record Date & Time
12.00 p.m.
Despatch date of Distribution Election Notice 25 February 2021 (Thursday)
Deadline for unitholders to complete & return the
8 March 2021 (Monday),
Distribution Election Notice to CDP in order to
5.00 p.m.
receive distribution in GBP
Distribution Payment Date 19 March 2021 (Friday)
Notes:
1 Date that units will be traded ex-dividend
22Confidential
Thank You
For enquiries, please contact:
MS Charissa LIU, Investor Relations
Elite Commercial REIT Management Pte. Ltd.
DID: +(65) 6955 9977 Main: +(65) 6955 9999 Email: charissa.liu@elitecreit.com
Address: 9 Temasek Boulevard, #17-01 Suntec Tower 2, Singapore 038989
https://www.elitecreit.com/Appendix Holborn House, Derby
Attractive yield spread in a “lower for longer” interest rate
environment
Portfolio NPI yield against comparable benchmarks
8.0
7.1%
7.0
Portfolio
6.0 NPI Yield
5.0 ~690+ bps
Yield spread to
4.0
Yield (%)
10Y UK govt
3.0 bond
2.0
1.0
0.0
2005
2019
2000
2001
2002
2003
2004
2006
2007
2008
2009
2010
2011
2012
2013
2014
2015
2016
2017
2018
2020
2021
2022
Bank of England base rate UK Government 10 year bond yield UK regional office prime yield
Annual increase in CPI
Inflation rate (%) 4.5 2018-2022E CPI
3.6 CAGR 1.6%
3.3
2.8 2.6 2.7
2.3 2.3 2.5
2.1 2.2 2.0 2.0
1.8
1.2 1.3 1.4 1.3 1.5
0.8 0.7 0.5
0.0
2006
2019
2000
2001
2002
2003
2004
2005
2007
2008
2009
2010
2011
2012
2013
2014
2015
2016
2017
2018
2020E
2021E
2022E
25
Source: FactSet, Bloomberg, Savills UK Regional Office Investment Market Watch, Office for Budget Responsibility, Bank of England Monetary Policy Report (November 2020)Typical Lease Arrangements for the UK Office Sector
• Lease terms:
– Lease terms are fixed and typically for 5-10 years
• Rent increase/review:
– Rents are reviewed against the open market rent typically every 5 years. Reviews for shorter leases may be more frequent.
Commercial leases typically impose upward only rent reviews which allow for rents to be increased but never decreased
• Service charge:
– The tenant is responsible for pro-rated share in addition to the rent, payable quarterly
• Break clauses:
– The landlord may grant a break clause which gives one or either party the right to end the lease sooner by giving notice either
at any time or between specified dates
• Assignment/Subletting:
– Landlords' approval for subletting and assignment is generally not to be unreasonably withheld but parameters are set out in
the lease terms. Subleases are often granted outside the protection of the Landlord and Tenant Act 1954 (as amended)
• Repairs and insurance:
– Usually the tenant will have direct responsibility for repairing the internal parts included in the lease terms and the landlord
will agree to repair and insure the external structure and the common parts retained by the landlord. The landlord’s costs for
repairs and insurance are typically borne by the tenants via the service charge
– Tenants will usually be made responsible for the regular redecoration of the premises let out under the leases
• Alterations:
– The landlord may restrict alterations that can be made to the demise and alterations will usually require the landlord’s
consent. The landlord has the right to insist that the tenant removes the alterations and restores the premises at the end of the
lease
• Dilapidations:
– The tenant has the responsibility to return the building to its original condition at the end of the lease. The term 'dilapidations'
is normally used to cover defects and disrepair that the tenant will be required to deal with or pay to have remedied when they
vacate the premises at the end of the lease. Landlords cannot generally make dilapidations claims earlier than three years
before the end of the lease
26Elite Commercial REIT Sponsors
Elite Partners Holdings Pte. Ltd. Ho Lee Group Pte. Ltd. ("HLG") Sunway RE Capital Pte. Ltd.
("EPH") ("Sunway")
• Incorporated in 1996 through
• The investment holding firm for the amalgamation of various • Wholly-owned subsidiary of
Elite Partners Group, construction-related businesses, Sunway Berhad, one of
established to deliver lasting and acquired Wee Poh Malaysia’s largest
value for investors based on Construction Co. Pte. Ltd. in conglomerates
common interests, long-term 2005
perspectives and a disciplined • Has businesses in property
approach • Extensive experience in development, property
development of industrial and investment and REIT,
• Backed by a team with proven residential properties construction, healthcare,
expertise in private equity and hospitality, leisure, quarry,
REITs • One of the major sponsors of building materials, and trading
Viva Industrial Trust during its and manufacturing
• Investment philosophy aims to IPO listing in November 2013
protect investors' initial capital, • Sunway Berhad Group
enhance investment value and comprises three public listed
create new growth entities: Sunway Berhad,
opportunities Sunway Construction Group
Berhad and Sunway REIT
27You can also read