Retail Seafood Waste Prevention: Reducing Retail and Consumer Fresh-Fish Waste by Cooking Directly from Frozen - Scientific Research ...
←
→
Page content transcription
If your browser does not render page correctly, please read the page content below
Food and Nutrition Sciences, 2021, 12, 290-307
                                                                                                 https://www.scirp.org/journal/fns
                                                                                                            ISSN Online: 2157-9458
                                                                                                              ISSN Print: 2157-944X

Retail Seafood Waste Prevention:
Reducing Retail and Consumer
Fresh-Fish Waste by Cooking
Directly from Frozen

Thomas O’Donnell1, Solomon H. Katz2, Alexandra Romey3, Benjamin Fulton4, Linda Croskey4,
Pete Pearson5, Jonathan Deutsch4
1
  Land, Chemicals, and Redevelopment Division, U.S. Environmental Protection Agency, Philadelphia, PA, USA
2
  W. M. Krogman Center for Research on Child Growth and Development at the University of Pennsylvania, Philadelphia,
PA, USA
3
  Drexel Food Lab, Drexel University, Philadelphia, PA, USA
4
  Department of Food and Hospitality Management, Drexel University, Philadelphia, PA, USA
5
  World Wildlife Fund, Washington DC, USA

How to cite this paper: O’Donnell, T.,          Abstract
Katz, S.H., Romey, A., Fulton, B., Croskey,
L., Pearson, P. and Deutsch, J. (2021) Retail   More than 30% of fish caught from the world’s oceans are never eaten by
Seafood Waste Prevention: Reducing Retail       consumers adding a significant but unnecessary strain to the sustainability of
and Consumer Fresh-Fish Waste by Cook-
                                                global fisheries. Although a lot of this loss occurs at sea, in developed coun-
ing Directly from Frozen. Food and Nutri-
tion Sciences, 12, 290-307.                     tries, a significant amount happens at retail stores and in households. People
https://doi.org/10.4236/fns.2021.123023         can help with this problem if they find and use new ways to interact with
                                                their retailers and with the way they store and cook seafood at home. Con-
Received: January 15, 2021
Accepted: March 21, 2021
                                                sumers can primarily purchase seafood that has never been frozen, was pre-
Published: March 24, 2021                       viously frozen, or is still frozen. Nearly all retail waste occurs when consum-
                                                ers do not buy seafood within a few days after it is in the unfrozen, display
Copyright © 2021 by author(s) and
                                                cases, forcing the stores to dispose of the fish in landfills or sewage plants. An
Scientific Research Publishing Inc.
This work is licensed under the Creative        estimated 220 million 4-ounce meal portions of the most popular seafood in
Commons Attribution International               the United States including shrimp, salmon, and cod meet this fate. This
License (CC BY 4.0).                            number can be reduced to the direct extent consumers can be persuaded to
http://creativecommons.org/licenses/by/4.0/
                                                buy and cook from frozen. Retailers are motivated to sell more frozen seafood
                Open Access
                                                because profit margins are reported to be higher and labor and disposal costs
                                                are lower. Many stores also benefit from their brand’s sustainability image,
                                                and contributions to corporate, national, and international waste reduction
                                                goals. Their challenge has been to educate and encourage consumers to choose
                                                frozen before fresh. Taste-testing evidence gathered in this study demon-

DOI: 10.4236/fns.2021.123023          Mar. 24, 2021               290                                  Food and Nutrition Sciences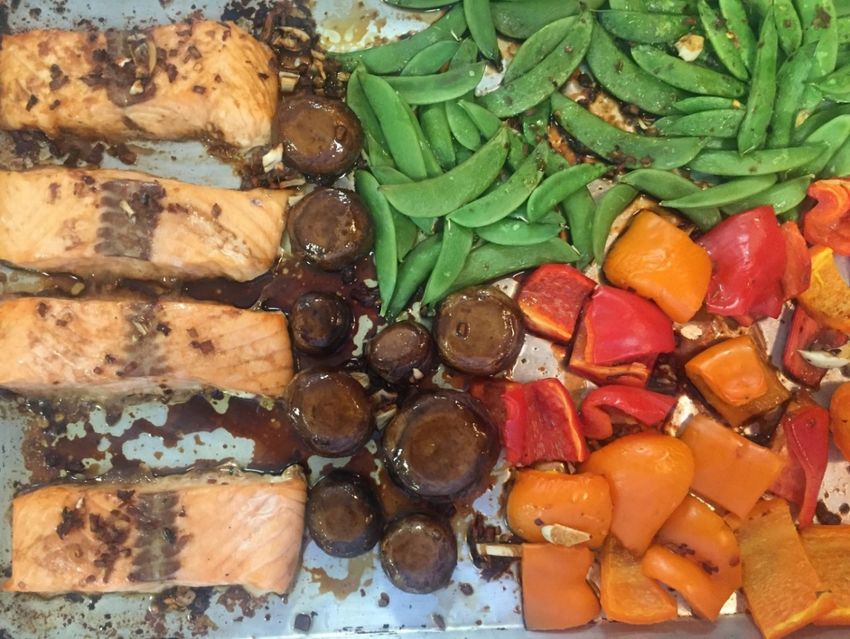
T. O’Donnell et al.

                                 strated that consumers could adopt easy, new culinary skills to cook seafood
                                 from frozen that tastes just as good as what they are used to. Our studies also
                                 highlighted other consumer benefits, including: less fish handling required,
                                 simple preparation, easier meal planning, water savings, and higher levels of
                                 food safety. Based on these results it will be beneficial for stores to commit
                                 resources to consumer education and promote more frozen seafood sales in
                                 other ways that satisfy their management goals. Increasing consumer adop-
                                 tion can drive changes at the store level that will provide measurable contri-
                                 butions to seafood waste reduction.

                                 Keywords
                                 Seafood, Waste, Cooking, Fisheries, Consumers, Retail

                               1. Introduction
                               Globally, over a third of commercially caught fish is never eaten by people [1].
                               Much of this loss occurs during fishing when unwanted fish or parts of a fish
                               catch are discarded back into the oceans. However, in developed countries much
                               more is wasted at the retail store and household levels [2]. Reducing production
                               discards and consumer waste is vital if the growing demand for fish is to be met
                               in the most sustainable way possible, one that conserves each fishery, particular-
                               ly wild fisheries that are so strained. Specifically, sixty percent of the world’s fi-
                               sheries are fully-fished to capacity and one-third are over-fished, according to
                               estimates from the FAO [3]. The causes of consumer-stage fish loss and waste
                               are the focus of this paper, emphasizing how retail stores manage their custom-
                               ers’ purchasing options and behavior.
                                 Estimates of Seafood Retail Sales and Waste
                                 According to data compiled by the National Marine Fisheries Service, fish
                               products in retail stores are predominately fresh and frozen. Approximately
                               one-third of these products are sold in retail; the rest are sold in food service and
                               restaurants (Table 1).
                                 Fresh fish—or previously frozen fish—in retail stores are offered for sale ei-
                               ther packed in ice or refrigerated in a glass or similar display case. Once in this
                               condition, the fish quickly loses its freshness and appeal and after just two to
                               three days it is usually discarded. It is unsafe to repurpose or refreeze the fish af-
                               ter this time, and even if it were, the loss of quality leaves the fish unsuitable for
                               sale. Purveyors report that they won’t sell any food that they would not eat
                               themselves [4]. Trapped in this loop, the only practical place for two to
                               three-day-old fish is in the trash or sink grinder. The desire of store owners and
                               the appeal of shoppers to see abundant fish on display and to participate in the
                               purchase choice results in lots of high-value seafood products being thrown
                               away, over and over.

DOI: 10.4236/fns.2021.123023                        291                                   Food and Nutrition Sciences
T. O’Donnell et al.

                               Table 1. 2015 Value of fish products sold into the retail and restaurant market in the
                               United States ([8], p. 61). Nine percent of these products are sold directly into industrial
                               markets.

                                         Edible Fish                 Value in Dollars            Percent of Total Retail

                                       Fresh and Frozen               $7,816,335,000                       84

                                           Canned                     $1,302,131,000                       14

                                            Cured                      $163,166,000                        2

                                            Total                     $9,281,632,000                      100

                                  Shoppers have come to believe that never-frozen fish is the freshest; and
                               therefore, the most healthy and tasty. While this might be true for fish that is
                               caught and eaten the same day in coastal areas, it is not true for most commer-
                               cially caught fish. For most of the world, the highest quality fish are actually
                               those that were properly handled and then flash frozen as quickly as practical af-
                               ter being caught [5]. Vacuum sealed is also reported as a preferred method to
                               preserve the quality of fish [6] [7]. Frozen fish in high quality packages retains
                               the greatest degree of freshness. Fish-on-ice, even if packed quickly, begins to
                               deteriorate. Therefore, a solution to the loss challenge includes changing con-
                               sumer behavior and preferences towards buying frozen. This leads to important
                               questions: 1) What type of seafood is lost, and how much of each type is lost?
                               And 2) How much can behavior changes at retail hope to reverse this loss?
                                  According to the National Marine Fisheries Service [8], the U.S. supply of edi-
                               ble, commercial finfish and shellfish in 2015 was 11.9 billion pounds. This is the
                               whole fish weight, both edible and inedible parts. The portioned-out weight of
                               fish fillets and steaks for restaurant and retail sales totaled a little more than 1.9 bil-
                               lion pounds. Popular Shellfish meat for the year was found to be 2.5 billion pounds.
                               This equates to 17.6 billion, 4-ounce meal servings before any post-harvest food
                               system losses. Most all of this fish was made up of the 19 most popular species
                               (Table 2)—a clear target for beginning waste prevention actions. According to
                               SeaFoodHealthFacts [9], one-third of seafood is purchased in retail. Shrimp
                               leads the list for shellfish while salmon, cod, and pollock are the most popular
                               finfish in the country. Other highly popular marine seafood products include
                               hake, lobsters, crabs, oysters, scallops, and clams. Tilapia is the dominant fresh-
                               water fish. The popularity of these fish has remained consistent since at least
                               2006.
                                  Most of these fish are imported, and programs to improve retail sale of these
                               products by reducing waste would be helping improve the sustainability of 97%
                               of international fisheries. Table 2 also shows the current sustainability status of
                               each fish type. The Marine Stewardship Council (MSC) and Seafood Watch are
                               two well-known rating agencies that match fishing pressure to the level of fish
                               production by species. Reported ratings vary by where each species is caught;
                               hence, ratings are by both fish type and the country providing the products for
                               commercial markets. For example, cod is broadly certified by the MSC except

DOI: 10.4236/fns.2021.123023                           292                                    Food and Nutrition Sciences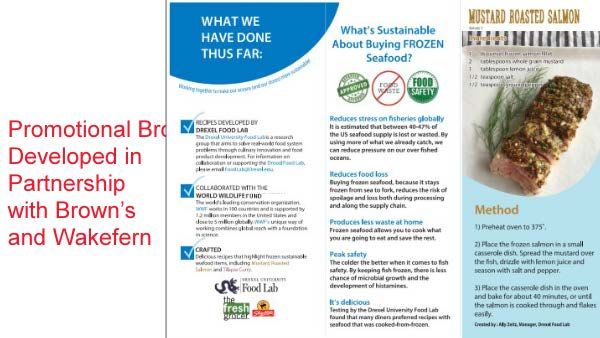
T. O’Donnell et al.

                                            from ocean sources exploited by Russia and Japan. This complicates the impact
                                            of fish loss reduction management plans, but having this data can inform target
                                            fish sources for organizations that want to make the most of their purchases on
                                            overall sustainability. Eleven of the nineteen species listed in Table 2 are either
                                            partially unrated or listed as “red-avoid” by the rating agencies. This is an envi-
                                            ronmental and ecological warning on the status of the fisheries that provides a
                                            large portion of the most popular fish in the United States. These ratings do not
                                            consider commercial fishing, including aquaculture and processing, that uses
                                            conscripted slave laborers, and other forms of worker abuse, an issue that is re-
                                            ceiving increasing attention and concern as people become more aware of the
                                            extent of this practice and proof that United States retailers are purchasing sea-
                                            food caught and or processed using labor practices that violate international law
                                            [10].

Table 2. Amount of the most popular fresh and frozen fish sold in the United States in 2015 ([8], p. 62, 98, 100, 101).

             Fish Fillets and Steaks                    Total Pounds                           2018 Sustainability Rating*

           Alaskan and Atlantic Pollock                  462,028,000                                  MSC Certified**

                 Salmon, species                          95,120,000                     Seafood Watch*** mostly farmed and red

                       Cod                                63,973,000               MSC Certified but avoid Russian and Japanese sourced

                       Hake                               26,004,000                 Seafood Watch yellow but mostly unrated fishery

                     Haddock                              13,917,000                                   MSC Certified

                    Flounders                             11,517,000                            Seafood Watch, mostly red

                      Tilapia                             9,764,000                       Seafood Watch yellow but 50% unrated

                   Tuna species                           8,023,000                             Seafood Watch, mostly red

                      Halibut                             3,405,000                                    MSC Certified

                   Dolphin fish                           3,167,000                             Seafood Watch, mostly red

                    Rockfishes                            2,572,000                          Seafood Watch, green and yellow

            Perch, Atlantic and Pacific                   2,088,000             Seafood Watch, mostly green but Atlantic perch is not rated

                    Swordfish                             2,052,000                             Seafood Watch, mostly red

                     Subtotal                            703,630,000

                     Shellfish

           Shrimp, heads-off, all species               1,796,684,000                          Seafood Watch, mostly yellow

            Crab, meat King and Snow                      64,845,000                           Seafood Watch, mostly yellow

                   Clams, meat                           105,480,000                         Seafood Watch, green or unrated

                  Oysters, meat                           57,437,000                               Seafood Watch, green

                  Scallops, meat                          62,000,000                             MSC Certified or unrated

   Lobster, tails and meat American and Spiny,            58,707,000            American MSC Certified; Spiny, mostly red in Latin America

                     Subtotal                           2,145,153,000

                       Total                            2,848,783,000

*FishChoice, https://fishchoice.com/; **Marine Stewardship Council, https://www.msc.org/about-the-msc/what-is-the-msc; ***Monterey Bay Aquarium,
https://www.seafoodwatch.org/3,248.

DOI: 10.4236/fns.2021.123023                                           293                                      Food and Nutrition Sciences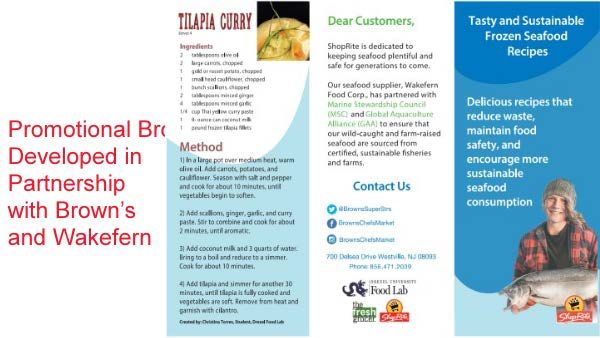
T. O’Donnell et al.

                                 Based on anecdotal information, there is a significant range in the proportion
                               of fresh versus frozen product sales. This information is not publicly reported
                               yet; however, there is some mention of proxies that can provide insight into the
                               different product formats, for example product display areas in stores. Weg-
                               man’s Food Markets [11] estimates that about a third of their seafood is dis-
                               played fresh. Other stores that were qualitatively evaluated for this research have
                               indicated that 30 - 40 percent is fresh—unfrozen. There are not publicly availa-
                               ble quantitative data about the amount of different fish species that are sold fresh
                               versus frozen in retail. For example, pollack is very popular in frozen products
                               but not so much in fresh displays in some stores. This is particularly meaningful
                               because this fish is sold more than all the other listed, popular fish combined.
                               Clams are another example because of its popularity as fresh, frozen, and
                               canned. Future research should clarify the ratio of fresh versus frozen so meas-
                               ures to target loss prevention appropriate for the different formats can be effi-
                               ciently deployed.
                                 Table 3 assumes that one-third of the seafood supply goes on to retail stores,
                               and second, that 45 percent of average fish sale capacity is fresh. Once in the re-
                               tail market, 13% percent of fresh fish is thrown out [2], which represents an av-
                               erage of 9% of the total seafood supply [12]. Frozen waste is minimal and typi-
                               cally occurs due to a mechanical failure such as a broken freezer that causes a
                               break in the cold chain or damaged packaging. Using the fish data from the pre-
                               vious table, 55 million pounds of the total reported weight of the most popular
                               fresh fish from supermarkets is wasted each year, representing an equivalent of
                               about 220 million, 4-ounce meal portions. Production data on species other than
                               those listed can be found in Lowther and Liddel [8]. Both store, customer, and
                               sustainability advocates can lead the way to resolving the important challenge of
                               reducing this seafood waste.
                                 Fresh shrimp sales at almost 600 million pounds comprise over 80% of the
                               shellfish market. Sales of other popular shellfish sell in weights range from 19 -
                               34 million pounds. The story with finfish is similar because previously frozen or
                               fresh pollock is at 152 million pounds and comprised about 65% of the market.
                               In combination, the largest sellers, shrimp and pollock, represent 79% of the fish
                               listed in Table 3. Reducing wastage of these two species alone would have an
                               outsized impact on the entire seafood waste scenario in retail. In fact, if pollock
                               and shrimp waste, distributed in retail as described in this report, were decreased
                               by a bit less than two-thirds, the overall waste reduction would be 50% without
                               improvements in any other loss fractions.
                                 Information about lost sales revenue can be a stand-alone driver for managers
                               to evaluate objective and subjective reasons for changing store waste prevention
                               strategies. Table 4 summarizes the estimated dollar value of the fish species
                               listed above. The estimates are based on average processed cost of each type of
                               fish plus average retail markup percentages that were provided by the National
                               Marine Fisheries Service [8]. Although the details of managing fish waste are not

DOI: 10.4236/fns.2021.123023                        294                                 Food and Nutrition Sciences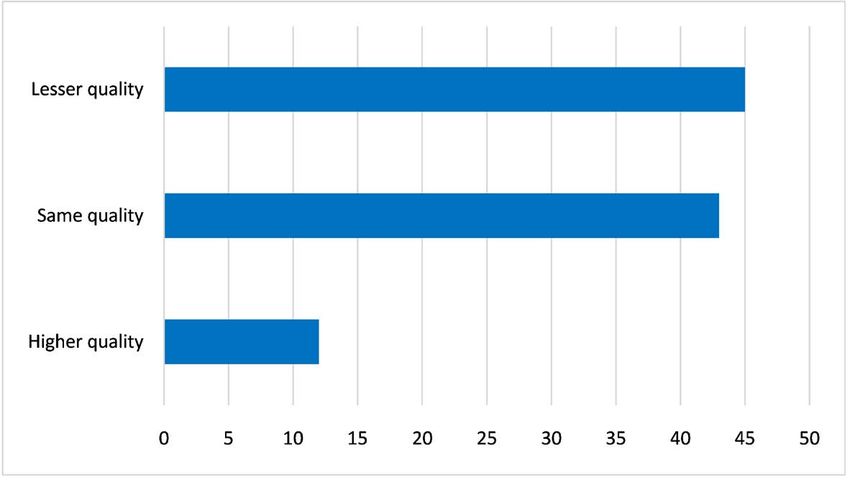
T. O’Donnell et al.

                               yet widely available, sufficient anecdotal feedback and reporting is emerging to
                               start designing safe, store-based programs that may be incentivized by revenue
                               and cost recovery. World Wildlife Fund [13] highlighted the following motiva-
                               tors: 1) lower disposal cost, 2) more sales revenue, 3) less handling time by store
                               clerks, 4) new relationships and value-added opportunities with suppliers, and 5)
                               happier customers that want to help reduce food waste.

                               Table 3. Estimated fresh fish wasted at USA retail (pounds, adapted from [6]).

                                                                   Estimated Sold Fresh        Estimated Sold  Estimated Fresh
                                             Fish                  and Frozen Retail in           Fresh in     Retail Waste in
                                                                      Pounds (33%)*           Pounds (45%) ** Pounds (13%) ***

                                        Alaskan and
                                                                        152,469,000              68,611,000            8,919,000
                                       Atlantic Pollock

                                       Salmon, species                   31,390,000              14,125,000            1,836,000

                                             Cod                         21,110,000               9,500,000            1,235,000

                                             Hake                        8,581,000                3,862,000             502,000

                                           Haddock                       4,593,000                2,067,000             269,000

                                          Flounders                      3,801,000                1,710,000             222,000

                                            Tilapia                      3,222,000                1,450,000             188,000

                                         Tuna species                    2,648,000                1,192,000             155,000

                                            Halibut                      1,124,000                 506,000               66,000

                                         Dolphin fish                    1,045,000                 470,000               61,000

                                          Rockfishes                      849,000                  382,000               50,000

                                  Perch, Atlantic and Pacific             689,000                  310,000               40,000

                                          Swordfish                       677,000                  305,000               40,000

                                           Subtotal                     232,198,000              104,490,000           13,583,000

                                           Shellfish

                                  Shrimp, heads-off, species            592,906,000              266,808,000           34,685,000

                                 Crab, meat, King and Snow               21,399,000               9,630,000            1,252,000

                                     Clams, meat, species                34,808,000              15,664,000            2,036,000

                                         Oyster, meat                    18,954,000               8,529,000            1,109,000

                                         Scallop, meat                   20,460,000               9,207,000            1,197,000

                                    Lobster, tails and meat,
                                                                         19,373,000               8,718,000            1,133,000
                                     American and Spiny

                                           Subtotal                     707,900,000              318,556,000           41,412,000

                                             Total                      940,098,000             136,046,000           54,995,000

                               * Seafoodhealthfacts.org; **Benwick, 2018 and personal research; ***Love et al., 2015, supplemental table
                               S10.

DOI: 10.4236/fns.2021.123023                              295                                          Food and Nutrition Sciences
T. O’Donnell et al.
Table 4. Estimated 2015 cost of fresh fish losses in retail [8].
Estimated Process Cost Processed Retail Cost,
Fish Retail Loss in for Fillets dollars Cost, Dollars
Pounds per Pound Dollars (markup 1.8%*)
Alaskan and Atlantic Pollock 8,919,000 1.36 12,102,000 21,784,000
Salmon, species 1,836,000 5.05 9,267,000 16,680,000
Cod 1,235,000 3.96 4,887,000 8,796,000
Hake 502,000 1.30 653,000 1,175,000
Haddock 269,000 4.68 1,260,000 2,268,000
Flounders 222,000 4.05 900,000 1,620,000
Tilapia 188,000 3.26 613,000 1,104,000
Tuna species 155,000 9.47 1,468,000 2,643,000
Halibut 66,000 8.47 559,000 1,006,000
Dolphin fish 61,000 5.02 307,000 551,000
Rockfishes 50,000 3.07 153,000 276,000
Perch, Atlantic and Pacific 40,000 1.67 67,000 120,000
Swordfish 40,000 8.75 350,000 630,000
Shellfish**
Shrimp, heads-off, species 34,685,000 4.21 146,022,000 262,840,000
Crab, meat, King and Snow 1,252,000 5.97 7,469,000 13,445,000
Clams, meat, species
2,036,000 1.12 2,289,000 41,202,000
(prices for canned variety)
Oyster, meat (prices for
1,109,000 2.79 3,096,000 5,573,000
canned variety)
Scallop, meat 1,197,000 7.20 8,623,000 15,521,000
Lobster, tails and meat,
1,133,000 9.22 10,446,000 18,803,000
American and Spiny
Total 416,037,000
*retail markup and value-added markup; ** average import cost.
Causes and Challenges of Seafood Waste
Is it possible, and does it make sense to use resources for waste prevention and
to reduce retail loss on the fresh fish display, or would the built-in years of inef-
ficiency and loss be too strong of a barrier to overcome at a store level? After all,
consumers will always prefer fresh over frozen fish to some degree. The Com-
mission for Environmental Cooperation [14] recently completed an evaluation
of food waste and loss in North America. Their approach included surveys and
interviews related to conferences and workshops, all to gather the most current
information. Awareness about the list of factors that cause food waste at the re-
tail level has grown, and the CEC report highlights some that are particularly re-
levant to wastage of fresh fish, including: food safety concerns and management
or marketing practices.
Food safety is on the minds of consumers, and in the case of seafood, concerns
DOI: 10.4236/fns.2021.123023 296 Food and Nutrition SciencesT. O’Donnell et al.
center around freshness and pollutants. Toxins in fish meat have been reported
for some time; however, fisheries with low levels of pollutants of concern like
lead, PCBs, and mercury are also being documented [14]. Customers can check
and verify their purchases to take advantage of healthier fish supplies. Issues
with freshness and microbial safety can be reduced by purchasing frozen and
cooking according to the suggestions provided later in this paper. Management
can be encouraged to modify their store practices by helping them understand
some of the benefits that come from reducing fresh fish waste in favor of more
frozen sales. Potential rewards include: increased sales, reduced waste disposal
costs, improved corporate sustainability, and less pollution.
Better Retail Practices for Sourcing and Selling Seafood
The CEC report also pointed out different individuals that would have the
most influence on changing marketing strategies and methods to reduce was-
tage. Included are store managers and employees, processors, distributors, and
service providers that support both products and sales. There are sufficient de-
tailed data and information available to begin to understand the loss factors and
to suggest and target remedies. Seafood sales are going up in general, while fresh
sales are increasing faster than frozen. This is the type of trend that leads to ac-
celerating retail fish waste. It is possible that sales would increase even more if
certain barriers were eliminated or lowered. Among these are people dislike for
handling seafood and concerns for safety.
Encouraging more fish consumption for health reasons is at odds with con-
sumer dislike for handling seafood. More inviting frozen-fish packaging that
minimizes the tactile part of the culinary experience would help narrow the
health-avoidance gap. Buyers already report that frozen offers more convenience
and better storage options, both of which can lower waste at the consumer level.
New frozen products are appearing in stores that minimize handling and offer
recipes, sometimes with included ingredients. The availability of more types of
frozen fish in new packaging then encourages consumers to buy frozen resulting
in less retail waste. Stores benefit from more sales and less waste while consum-
ers eat more nutritious fish.
Aquaculture production is increasing to fill the gap caused by a growing sea-
food demand that is outpacing global population growth and the capacity of
wild-caught production. In total, constraints on the scalability of these systems
and distribution limitations may still place a global deficit on available seafood
as compared to recommended nutritional profiles for source proteins. Efforts to
“sustainably source” wild caught seafood using standards like Marine Steward-
ship Council (MSC) and the Aquaculture Stewardship Council (ASC) have stea-
dily increased among retailers and seafood purchasing groups. This trend is pos-
itive and one that must continue to accelerate and expose the limitations of wild
seafood sources.
In order to achieve these goals, consumption patterns must be re-imagined
and adjusted. Consumer focused pilots can address issues around consum-
er-generated seafood waste, such as frozen vs. fresh product, proper handling
DOI: 10.4236/fns.2021.123023 297 Food and Nutrition SciencesT. O’Donnell et al.
and preparation, more efficient packaging that increases merchandising appeal
and retail sales and the importance of sustainable purchases. This purpose and
approach is the focus of the research work that is reported in this paper with an
emphasis on using the culinary arts to give people real experiences with han-
dling, preparation, recipes and cooking from frozen.
Initial Consumer Attitudes and Research Objectives
In 2017, the Drexel Food Lab conducted consumer interviews and in-store
consumer surveys (n = 100) at a busy nationally branded, locally owned super-
market on the border between the city and the suburbs of Philadelphia. Respon-
dents were given a modest gift card to the store to thank them for their time. No
personal data were collected, and the research was given a Letter of Determina-
tion from Drexel’s Human Research Protection Program (IRB). The store was
chosen for its ability to attract a diverse clientele of city-dwellers and suburba-
nites across a wide range of race, ethnicity, and socioeconomic status. The ex-
ploratory research reported here challenged the culinary and consumer prefe-
rences for fresh (previously frozen) seafood and asked if high-quality culinary
standards can be achieved to the same or higher levels by preparing frozen sea-
food products directly from their frozen state, “cooking from frozen.” This re-
search is especially relevant in consumer and commercial settings, since the per-
ception of “fresh” is skewed towards higher temperature storage, rather than a
consumer reluctance to rate frozen as higher quality, even though by food safety,
sustainability, and true freshness standards, frozen is superior (Figure 1).
Among 100 consumers that were queried, the majority (52) responded that fresh
fish was fresher. Our supposition is that the largest perception barrier to frozen
seafood is a reluctance to view frozen seafood as desirable from a culinary
standpoint. We also asked consumers what they thought about the quality of
fresh versus frozen and much like the freshness response, 50 percent of consum-
ers replied that fresh fish was higher quality (Figure 2). This high response rate
further encouraged the research that followed our supposition because of the
possibility of influencing consumers in ways that would significantly help to re-
duce wastage.
Figure 1. Consumer attitudes about the freshness of frozen fish compared to
fish from counter.
DOI: 10.4236/fns.2021.123023 298 Food and Nutrition SciencesT. O’Donnell et al.
Figure 2. Consumer attitudes about the quality of frozen fish compared to
fish from counter.
Food safety plays a large role in behaviors and patterns. Once defrosted, most
fish cannot be safely re-frozen and typically goes to waste if not purchased or
prepared. Defrosted fish also has a higher likelihood of being wasted at the
household level. Purchased fish sits in a refrigerator and, as dinner plans change,
it may be discarded without being cooked or re-frozen by the consumer after in-
creased opportunity for microbial growth and oxidative rancidity (resulting in
the characteristic fishy smell) from the defrosted stage [15].
Consumers shared that the step of defrosting frozen seafood is a deterrent to
purchasing it. Package instructions typically indicate that the fish or seafood
must be thawed under refrigeration for several hours or under cold running wa-
ter (further wasteful from a sustainability standpoint). Consumers report hur-
dles associated with either of these scenarios including: not being organized
enough to plan dinner days in advance and move seafood from freezer to refri-
gerator; not being patient enough to wait for defrosting under water; not want-
ing to waste water; and changing plans resulting in not getting around to cook-
ing the defrosted seafood as intended. In addition, some consumers share inse-
curities with regard to proper handling and cooking of seafood, especially fin-
fish, as well as expressing displeasure in having to handle raw fish during cook-
ing. In short, consumers report wanting to eat more seafood but find the hurdles
to buying and handling the products to be deterrents.
Inspired by knowledge of loss rates in the retail seafood supply chains, Drexel
Food Lab principals and students investigated if it would be possible to cook fish
directly from its frozen state at high culinary quality, the way one cooks a frozen
hamburger patty. With some caveats, the answer is “yes” (Figure 3). Fifty-five of
100 respondents were positive about the idea of cooking from frozen in theory.
Research objectives evolved and expanded to gather real consumer feedback
and see how the Cook-from-Frozen recipes and new knowledge collected during
the investigation can influence sales. In collaboration with the supermarket, we
obtained retail data and piloted a variety of interventions in stores. They confirm
extensive losses and little conversion to prepared product at the fish counter and
DOI: 10.4236/fns.2021.123023 299 Food and Nutrition SciencesT. O’Donnell et al.
Figure 3. Consumer attitude about cooking from frozen if quality was certain
(post tasting).
further confirmed that the stores have better profit margins on frozen fish (both
in terms of gross margins on the products themselves and reduced staffing and
loss management from waste). With these multiple benefits the store welcomed
the opportunity to encourage a shift in sales to frozen seafood.
Our taste testing and marketing research had several specific parts:
• Complete recipe development and testing of Cook-from-Frozen recipes
• Engage a graphic designer for the layout and printing of customer marketing
materials
• Taste tests of recipes at supermarkets
• Collect consumer acceptance feedback on the appeal of buying frozen fish as
well as the success of the recipes.
Methodology for Recipe Development and Taste-Testing
In Spring 2017, several types of fresh and frozen seafood items were selected
for evaluation based on sales priorities and sustainability—certified products
provided by the retailer. The primary items were shrimp, salmon, and tilapia as
proxies for a variety of related crustaceans, fatty fish, and lean fish. Culinary ex-
periments found that methods like roasting, poaching, and baking en papillote
were particularly effective, while frying and grilling resulted in difficulty achiev-
ing thorough cooking directly from frozen. Recipes and cooking recommenda-
tions were made (see below) for each fish type.
Communication
Following recipe testing, a consumer education brochure was designed for
distribution in the customer’s frozen seafood section of the supermarket. The
brochure contained recipes for cook-from-frozen seafood, an explanation of the
sustainability, food safety and convenience aspects of cook-from-frozen seafood,
a description of the partnership/project, and an explanation of the company’s
overall work on sustainable seafood (recipe examples and the brochure are in-
cluded in the supplemental materials).
Consumer feedback
DOI: 10.4236/fns.2021.123023 300 Food and Nutrition SciencesT. O’Donnell et al.
The suburban Philadelphia store location that serves city and suburban cus-
tomers was used to launch four weekly tasting sessions. Patrons had the oppor-
tunity to taste a Cook-from-Frozen fish sample (a tilapia curry or roasted sal-
mon) and provide feedback via a one-minute survey. Shoppers were asked if
they would like to sample a Cook-from-Frozen fish dish. Each participant was
given a $5 in-store gift card. Approximately 250 samples were served weekly and
those who completed the tasting were asked if they would like to complete the
survey as well. A 10% response rate yielded 100 completed surveys. Recipes and
brochure handouts were available to everyone. Highlights of survey results are
shown in Figure 4. About 34 percent of participants indicated that they would
try this Cook-from-Frozen technique after trying the dish. Only 7 percent said
they would cook from frozen before their tasting experience.
2. Summary and Conclusion
A 2017 report from IRi shows that fresh seafood has seen marked increases in
consumer interest [16]. Increasing customer demands for fresh product are of-
ten derived from a perception that thawed fish is “fresh” simply because it most
closely resembles the state of fish pulled immediately from the water. Once a
human intervention is imposed (i.e., fish is frozen), consumers perceive that the
fish is no longer “fresh”. In reality, given the distances and the complexities of
our fresh food supply chains, delivering truly fresh fish under these visually ap-
pealing circumstances is extremely costly and reduces the shelf-life of the prod-
uct.
Since it is standard practice for many retailers to thaw previously frozen fish
for display, we can conclude that thawing fish to display it as “fresh” is merely a
marketing strategy to satisfy consumer visual impulses to see fish that was just
pulled out of the river or ocean. The display life of this form of seafood is short.
Loss is accepted in retail systems as a price of doing business, since it’s assumed
and seldom challenged that customers want to see thawed fish. Furthermore,
loss rates are rarely if ever made public and are guarded under strict business
confidentiality. Anecdotally, loss rates are typically estimated between 8% - 20%
of total sales at most seafood counters.
This investigation tested the proposition that, with proper consumer educa-
tion, frozen fish can be merchandised as high-quality and that preparation can
be just as convenient as thawed fish from the seafood counter. If in-store mar-
keting campaigns can sell the benefits of frozen and alternative packaging mod-
els, and if these new products can maintain or even increase seafood sales, it be-
comes a multi-faceted win for retailers: increased sales, less in-store shrink (in-
creased margin), happy customers, and less stress on the environment.
From a culinary perspective, Cook-from-Frozen remains a promising cooking
method, offering consumers a more convenient, safer, and more sustainable so-
lution than buying fresh-from-frozen or defrosting at home. Quality of finished
dishes was on par with fresh. For the typical consumer, cook-from-frozen sea-
food is an appealing alternative. Benefits include:
DOI: 10.4236/fns.2021.123023 301 Food and Nutrition SciencesT. O’Donnell et al.
Figure 4. Summary of consumer feedback after participating in Cook-from-Frozen in-store tasting sessions.
• Limited handling required
• Simple preparation
• Makes advanced meal planning easier
• Saves water in defrosting
• Preserves cold chain at zero degrees F until the point of cooking.
Benefits to retailers include:
• Reduced personnel time and training needs
• Reduced cost of food loss
• Reduced store footprint (receiving, prep area and display)
• Easy recipe and cooking promotion opportunity for customers
This research has reached the following important conclusions: 1) Consumers
perceive the thawed seafood is more fresh than frozen seafood. It is not. 2)
Cooking demonstrations can teach consumers how to successfully cook from
frozen. More consumer education in this area is useful and necessary. 3) Selling
frozen product reduces seafood losses. Retailers benefit financially.
In summary, maintaining the current seafood merchandising system to appeal
to consumer’s actually increases waste and does not contribute to sustainable
fish stocks. Educating consumers about how to purchase and cook-from-frozen
is an incremental component of seafood waste reduction that directly enhances
sustainable fisheries and builds consumer awareness of economic and healthy
tools they can use to expand the potential of seafood to meet nutritional re-
quirements.
Disclaimer
Any views expressed in this report do not necessarily represent those of the
United States government or the Environmental Protection Agency. Mention of
trade names or commercial products does not constitute endorsement or rec-
ommendation for use.
DOI: 10.4236/fns.2021.123023 302 Food and Nutrition SciencesT. O’Donnell et al.
Conflicts of Interest
The authors declare no conflicts of interest regarding the publication of this pa-
per.
References
[1] Food and Agriculture Organization of the United Nations (2017) Reduction of Fish
Food Loss and Waste.
http://www.fao.org/fileadmin/user_upload/COFI/FishTrade/uploads/6e.pdf
[2] Love, D.C., Fry, J.P., Milli, M.C. and Neff, R.A. (2015) Wasted Seafood in the Unit-
ed States: Quantifying Loss from Production to Consumption and Moving toward
Solutions. Global Environmental Change, 35, 116-124.
https://doi.org/10.1016/j.gloenvcha.2015.08.013
[3] Food and Agriculture Organization of the United Nations (2018) The State of
World Fisheries and Aquaculture 2018 in Brief. Food and Agriculture Organization
of the United Nations, Rome, 227 p.
[4] Cabrini University (n.d.) Serving Food Solutions.
http://servingfoodsolutions.com/the-problem/food-waste/environmental-effect/foo
d-waste-copy/
[5] Ecotrust (2017) A Fresh Look at Frozen Fish Expanding Market Opportunities for
Community Fishermen.
https://ecotrust.org/publication/a-fresh-look-at-frozen-fish/
[6] Shaw, H. (2019) Before You Buy Seafood at a Supermarket. The Spruce Eats.
https://www.thespruceeats.com/buying-seafood-at-a-supermarket-1300630
[7] Science Direct (n.d.) Frozen Fish.
https://www.sciencedirect.com/topics/food-science/frozen-fish
[8] Lowther, A. and Liddel, M. (2016) Fisheries of the United States 2015. 151 p.
https://www.st.nmfs.noaa.gov/Assets/commercial/fus/fus15/documents/FUS2015.p
df
[9] Seafood Health Facts (2017) Overview of the Seafood Industry.
https://www.seafoodhealthfacts.org/seafood-choices/overview-seafood-industry
[10] Grant, J. (2019) Slavery in the Seafood Industry.
https://www.sustainalytics.com/esg-blog/slavery-forced-labor-seafood-industry/
[11] Benwick, B.S. (2018) Buying Frozen Fish Isn’t What It Used to Be. Here’s What You
Need to Know, Washington Post. https://tinyurl.com/y4fz897k
[12] Buzby, J.C., Wells, H.F. and Hyman, J. (2014) The Estimated Amount, Value, and
Calories of Postharvest Food Losses at the Retail and Consumer Levels in the Unit-
ed States. EIB-121, U.S. Department of Agriculture, Economic Research Service,
Washington DC. https://dx.doi.org/10.2139/ssrn.2501659
[13] Stone, A. (2018) Out of the Sea, Waste I Could Be.
https://www.worldwildlife.org/blogs/sustainability-works/posts/out-of-the-sea-wast
e-i-could-be
[14] Commission for Environmental Cooperation (2018) Food Loss and Waste Reports.
http://www3.cec.org/fw/food-waste-reports/
[15] Clay, J. (2017) Leaving Value on the Boat.
http://www.brinknews.com/leaving-value-on-the-boat/
[16] IRi (2017) 2017 Top Trends in Fresh Foods. Food Marketing Institute, Washington
DOI: 10.4236/fns.2021.123023 303 Food and Nutrition SciencesT. O’Donnell et al.
DC.
https://www.fmi.org/docs/default-source/default-document-library/top-trends-in-fr
esh_poviri2017.pdf?sfvrsn=4ad97c6e_2
DOI: 10.4236/fns.2021.123023 304 Food and Nutrition SciencesT. O’Donnell et al.
Supplemental Materials
Sample recipe:
Roasted Salmon Sheet Tray Dinner with Soy Ginger Sauce by Alexandra Ro-
mey
Serves: 4
2 tablespoons olive oil
4 ShopRite Preferred Brand frozen salmon fillets
1/4 cup soy sauce
2 tablespoons sesame oil
1 tablespoon minced ginger
1 tablespoon honey
1 pound snap peas
8 ounces mushrooms
2 bell peppers, chopped
Salt and pepper to taste
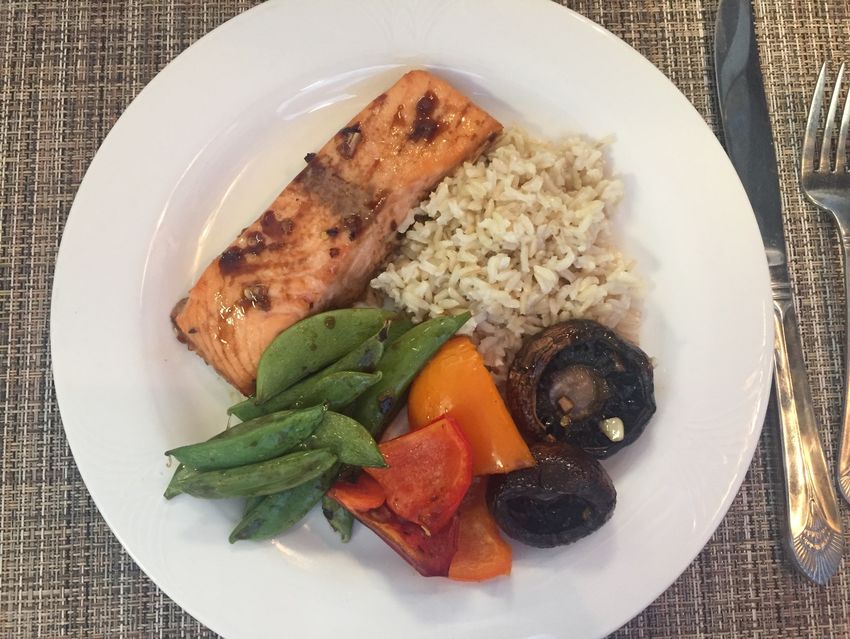
1) Preheat oven to 350 degrees Fahrenheit.
2) On a baking sheet tray, drizzle olive oil. Place salmon on one section of the
tray and roast for 20 minutes.
3) Meanwhile, in a small bowl, add soy sauce, sesame oil, ginger and honey.
Stir.
4) Once the salmon is partially cooked, add snap peas to a section of the tray,
mushrooms to another, and peppers in remaining area. Drizzle soy ginger sauce
over salmon and vegetables.
5) Return tray to oven and cook for 20 - 25 minutes, or until vegetables are
tender and salmon is cooked through.
6) Serve salmon, snap peas, mushrooms and peppers with brown rice.
DOI: 10.4236/fns.2021.123023 305 Food and Nutrition SciencesT. O’Donnell et al.
Consumer Educational Brochure
DOI: 10.4236/fns.2021.123023 306 Food and Nutrition SciencesT. O’Donnell et al. DOI: 10.4236/fns.2021.123023 307 Food and Nutrition Sciences
You can also read