Road Show presentation - November 2019 - IGD SiiQ
←
→
Page content transcription
If your browser does not render page correctly, please read the page content below

Road Show presentation
                         November 2019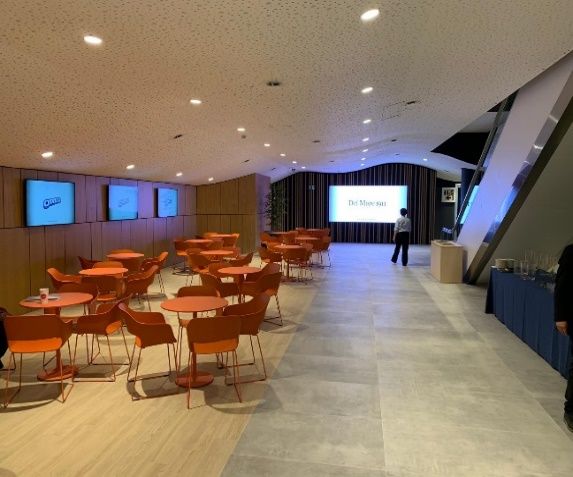
Disclaimer

  This presentation does not constitute an offer or an          These statements include financial projections and
  invitation to subscribe for or purchase any securities.       estimates and their underlying assumptions, statements
                                                                regarding plans, objectives and expectations with
  The securities referred to herein have not been registered    respect to future operations, products and services, and
  and will not be registered in the United States under the     statements regarding plans, performance.
  U.S. Securities Act of 1933, as amended (the “Securities
  Act”), or in Australia, Canada or Japan or any other          Although the management of IGD SIIQ SPA believes
  jurisdiction where such an offer or solicitation would        that the expectations reflected in such forward-looking
  require the approval of local authorities or otherwise be     statements are reasonable, investors and holders of IGD
  unlawful. The securities may not be offered or sold in the    SIIQ are cautioned that forward-looking information and
  United States or to U.S. persons unless such securities       statements are subject to various risk and uncertainties,
  are registered under the Securities Act, or an exemption      many of which are difficult to predict and generally
  from the registration requirements of the Securities Act is   beyond the control of IGD SIIQ; that could cause actual
  available. Copies of this presentation are not being made     results and developments to differ materially from those
  and may not be distributed or sent into the United States,    expressed in, or implied or projected by, the forward-
  Canada, Australia or Japan.                                   looking statements.

  This presentation contains forwards-looking information       These risks and uncertainties include, but are not limited
  and statements about IGD SIIQ SPA and its Group.              to, those contained in this presentation.

  Forward-looking statements are statements that are not        Except as required by applicable law, IGD SIIQ does not
  historical facts.                                             undertake any obligation to update any forward-looking
                                                                information or statements.
Index

        1                           4
        Introduction to             FY 2018 + 9M2019
        IGD                         Financial Results
                           Pag. 4                       Pag. 29

        2                           5
        Operating Data              Strategic Plan
                                    2018-2019
                          Pag. 11                       Pag. 37

        3                           6
        Sustainability              Appendix

                          Pag. 24                       Pag. 65

                                                                  3
1 Introduction to IGD
IGD at a Glance
IGD is the leading Italian listed developer and operator of Italian quality retail real estate properties: develops and manages
shopping centers across the country and has also a presence in retail distribution in Romania

                               IGD #1 Italian Retail SIIQ (REIT) - Portfolio Snapshot
                                                                                                                                                             5.4% EPRA NIY
                   ¤2.4 Bn Portfolio                                                                            Rental Income                                5.4% net initial yield topped-up
                                                                              75 Assets
      Mainly Malls / Retail Parks / Hypermarkets                                                                  >¤150 MM

                                                                            IGD Portfolio Breakdown by Geography                                             80.0% Ebitda margin⁽²⁾
                                                                              By Value                        By Rental Income                               +260 bps since 2014 (77.4%)
                            1
                                                                              €2.4 Bn                             €152 MM
                    3           5                                                   Romania                                 Romania
           2                                     25 hyper /                           6%                                      6%                             96.6% financial occupancy⁽3⁾
                1                           supermarkets in Italy
                          22                                                                                                                                 Constantly > 96% since IPO (2005)
                                                 24% value
                                                                    Italy                             Italy
                            7           7                           94%                               94%
                                                                                                                                                             EPRA NNNAV: €1,190M
                                            2                                                                                                                €10.78/share
                                    5
                                                                                          Bistrita
                                                2
                                                                                         Cluj         Piatra Neamt
                                                                                                                                                             FFO/share: €0.72/share (FY2018)
                        26 shopping malls                                                Turda                    Vaslui                                     23% CAGR over 2014-2018
                             in Italy⁽²⁾                                                                             Galati
                            65% value
                                                                               Ramnicu Valcea        Ploiesti    Braila
                                                                                                             Buzau         Tulcea                            Dividend 2018
#   n° of properties                            4
    Northern Italy (58% Value⁽3⁾)                                                         Slatina                                                            € 0.50 (p.s. paid in 2019)
    Central Italy (29% Value⁽3⁾)                                                                Alexandria
    South Italy (13% Value⁽3⁾)
                                                                                                                                                             47.8 % LTV (excl.IFRS16 c.46.7%)
               61 Properties in 12 Regions                                         14 Properties in 13 Cities
                                                                                                                                                             Target 2021 < 45%
                          (94% of Value)                                                    (6% of Value)

                                Data as at 30/06/2019 unless differently indicated
                                1. Includes mainly the Porta a Mare project in Livorno
                                                                                                                                    2. Margin from freehold properties
                                                                                                                                    3. Datat as at 30/09/2019
                                                                                                                                                                                                 5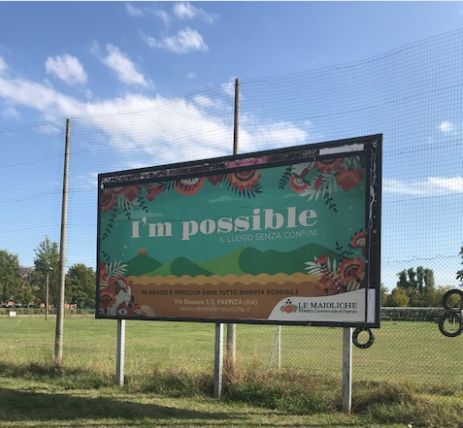
An intense growth journey
to reach a suitable size
Real estate portfolio market value €mn

                                                                                        ~(260)
                                                               ~420

                                                                                 Disposals (at book
                                                      Interesting growth         value or higher values)
                                    ~830              opportunities seized       and change in fair
                                                      on the market              value

                                                      Extraordinary
                                                      investments for the
                            Completed an
                                                      acquisition of 10 assets
                            important pipeline
                                                                                                                  2,412.2
                                                      Average yield > 6.5%
                            Openings:
                            9 shopping malls
                            5 hypermarkets
         1,423.0

    Market value FY2008       Total committed           Total extraordinary      Total disposal and change   Market value FY2018
                                investments                investments                   in fair value

                           A decade of intense growth to reach an ideal size and leadership in Italy

                                                                                                                                   6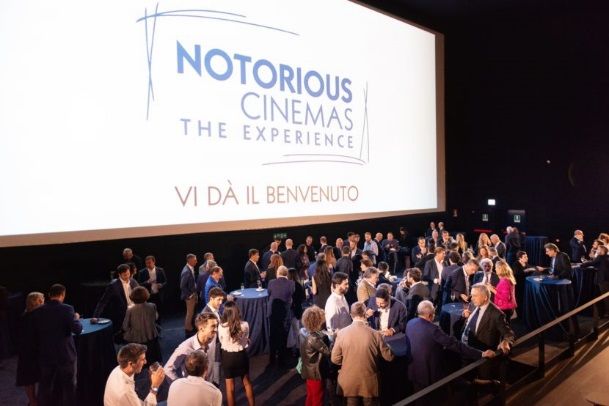
IGD Business Model Explained
 A distinctive competitive positioning in the fragmented Italian retail real estate market

1       Well Diversified Across Italy

                         39.2k                       GDP Per-capita
                                                                         2      Strategic Positioning
                                                                                                                    3     Strong Food Anchor (COOP)
                                                                                                                                                                4      Strong Track-Record of
                                                                                                                                                                         Direct Management

                                                       €34.6k – €42.6k
                            1
35.2k
                    38.0k
                                    30.9k              €30.0k – €34.5k                                                                                                         Services
                                5                      €20.6k – €29.9k
                     3               33.1k
        2                                              €16.8k – €20.5k
  30.3k         1
                         22 35.3k                           €28,500
            31.6k                                    Italian average
                         30.4k        7                    €29,200
                                                                                           Ravenna
                                                                                                                                                                             Food Court
                            7           26.8k            EU average
            #                       24.5k
                                          2
 n° of properties
                                      5 24.7k                                            4 km
                                               19.8k
                                32.7k                     18.4k
                                                 2
                                                                                                                                          Hypermarket
                                                                                                                                                                         Sharing Economy
                                                        21.1k                Centro Commerciale
                                             18.2k
            20.6k                                                                    ESP

                                                         17.2k

                                             17.5k
                                                                                                                                                                       Entertainment Areas
                                                4

                                                                                                                        The Food Hypermarket Plays a Critical     Proactive Approach, Carefully Selected
                                                                           We strive to Be the Dominant Retail
    With Strategic Focus on High GDP per                                                                                 Attraction Role in Our Retail Assets     Merchandising Mix, Marketing Activity
                                                                         Destination in Mid-Sized Wealthy Italian
       capita Northern Mid-Size Cities                                                                                    Fresh food, Daily Shopping, Sticky        Adapted to Each Context and Wide
                                                                          Cities, at Easy Reach from City Centre
                                                                                                                                  Consumer Habits                   Offer of Customer Related Services

                                                                                m2      Average Gla: about 25,000 sqm                              Easily reachable: about 4km from city center
                            Young portfolio                                                                                                        Average parking places: 2,013
                                                                                        Catchment area: about 370,000
                            Average age 7 years
                                                                                        inhabitants in 20 minutes                                  Centers reached by public transport: 24 (89%)
                            (from opening/restyling)
                                                                                        Average footfalls per year: 3.5 million                    Centers reached by cycle path: 16 (59%)

                                                                                                                                                                                                     7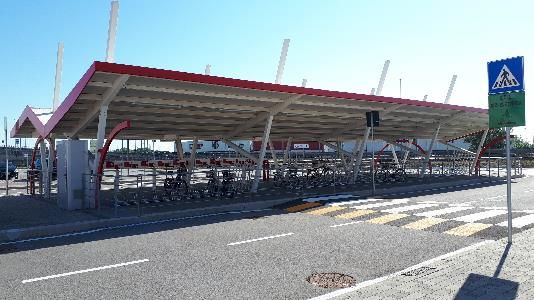
Our shareholding structure
Listed on the Italian Stock Exchange in the
STAR segment (“high requirements”)                                          Freefloat equal to 47.05%, majority of institutional investors, of which⁽²⁾
                                                                                                                                    Italy
         Number of shares: 110,341,903                       Unicoop Tirreno                                          20%           Mediolanum, Coop
                                                                                                                                    Lombardia, Eurizon
                                                                 12.03%                        Free Float                           UK & Ireland
                                                                                                47.05%                25%           GWM,
                                                                                                                                    Baillie Gifford
         Share Capital: about €750 m⁽1⁾
                                                                                                                                    US & Canada
                                                                                                     majority of      25%           Vanguard,
                                                                                                                                    Dimensional
         Net Equity: about 1.2 Bn €                                                                  institutional
         (30/09/2019)                                                                                                               Luxembourg Netherlands Belgium
                                                                                                     investors
                                                                                                                      5%            Lupus Alpha
                                                                                                                                    Stichting pension fund
         Market Capitalization: about €662 mn
         (average market price 01/11/2018-                                                                                          France
         31/10/2019)                                     Alleanza 3.0                                                 6%            Immobilier 21
                                                                                                                                    Amiral gestion
                                                           40.92%
         Average daily trading: about 145,437                                                                                       Rest of the World
         shares (01/11/2018-31/10/2019)                                                                               19%           Codan Forsikring, Bayern Invest
                                                                                                                                    Kokusai Reit

Governance – Best-in-Class Board Composition
                                                                                                                                    Elio Gasperoni (1953)
                                                                                                                                    Chairman
                                                                                                                                    • Chairman of IGD's Board since April 2017
                                                                                                                                    • Vice Chairman of Coop Alleanza
                                                                                                                                    • Board member of IGD since 2015
             11                                                                    63.6% Male (7)                                   Claudio Albertini (1958)
                                        63.6% Independent (7)
      Members of Board                                                            36.4% Female (4)                                  Chief Executive Officer
                                      36.4% Non Independent (4)
        of Directors
                                                                                                                                    • Appointed in May 2009
                                                                                                                                    • Board member at IGD since 2006
            3 committees entirely composed by independent directors

                   1. Bod on 11 of October 2019 approved the share capital reduction (from around 750mn€ to 650mn€) through full allocation to
                      legal reserve and available equity reserve                                                                                                          8
                   2. Internal processing on Bloomberg data as at October 29th 2019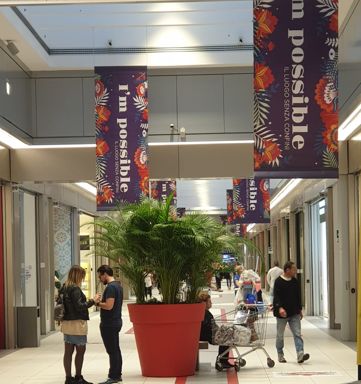
Key data of the entire Coop world
and of our two main Shareholders

             7 Legal entities throughout Italy                                                  Coop world key data*:
               17 Regions covered by Coop
                                                                                                Turnover ~14.7 bn € (13.6% of italian large scale retail)

                                                                                                No. of stores: ~1,200

                                                                                                Employees ~52,000
                  Coop Lombardia
                                                                                                Members ~ 6.7 million people

  Novacoop
                                               Coop Alleanza 3.0

                                                                                                                      Coop Alleanza 3.0     Unicoop Tirreno

                                                                                               Revenues                 * ~4,1 bn €         * ~960mn €
                                                          Centro Italia
                                                                                               N° of stories                    ~421             ~100
   Coop Liguria
                                                                                               Employees                      >22,000            3,650

                                                                                               Members                       ~2.2 million      ~647,000

                                                                                               Deposits
                                                                                                                             ~3.6 bn €         ~633mn €
                                                                                               from members

       Unicoop Firenze                                                                         Strategic investments in listed companies:
                                                                                                          UNIPOL GRUPPO FINANZIARIO
                                                                                                                                                    IGD SIIQ SPA
                                                                                                          (Insurance and banking)
                                                       Unicoop Tirreno

                  * data as at 31/12/2018
                  • Sources: Coop Alleanza 3.0 and Unicoop Tirreno financial reports, www.e-coop.it and Rapporto COOP 2018                                         9
                  • Coop Alleanza is the merger of Coop Adriatica; Coop Estense; Coop Consumatori Nordest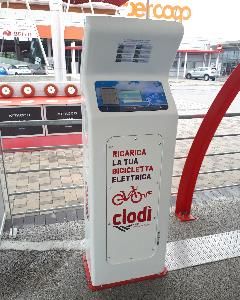
Our Top Management
Elio Gasperoni (1953) Chairman                                                              Claudio Albertini (1958) Chief Executive Officer

             • Chairman of IGD's Board since April 2017                                                  • Appointed in May 2009
             • Vice Chairman of Coop Alleanza                                                            • Board member at IGD since 2006
             • Board member of IGD since 2015                                                            • More than 20 years of experience wth Unipol Group, wehere he
             • He has held numerous roles in Public Adminstrations and Local                               ultimately acts as General Manager of Unipol Merchant
               institutions                                                                              • Certified financial auditor registered in Bologna

Daniele Cabuli (1958) Chief Operating Officer                                               Roberto Zola (1961) Director of Asset Management and development

             • More than 20 years of experience in retail distribution                                   • Director of Asset Management and Development since 2006
             • Joined IGD in 2008 as Network Management Director and COO since                           • Joined GS Carrefour Italia Group in 1999 as Head of Hypermarket and
               2009                                                                                        Shopping centre Development
             • Worked for Coop Adriatica since 1986 with several roles: Head of Projects                 • Head of Asset Management and Development for Carrefour Italia from
               in the Marketing Division (1989), Head of different geographical areas and                  2005
               Hypermarket Manager (until 2003), Director of Marketing and                               • Previously, Business Manager at Coopsette (since 1986)
               Commercial Development (from 2003)

Andrea Bonvicini (1963) Director of Finance Division                                        Raffaele Nardi (1976) Director of Planning, Control and Investor Relations

             • Head of the IGD Group's Finance Division since September 2009                             • Head of the division to wich 3 different departments report: planning,
             • In July 2012 he was appointed Director of Finance and Treasury                              control and investor relations
               Department                                                                                • Joined IGD in October 2010
             • More than 20 years of professional experence in the world of credit,                      • Head of the Advisory Service of UGF Merchant, bank of the Unipol
              first in Cooperbanca and, subsequent to 1997, in the Bank of Bologna                         Financial Group, where he matured more than ten years of experience
                                                                                                         • Graduated in Business Economics

Carlo Barban (1978) Director of Administration, Legal & Corporate Affairs
             • Director of Administration, Legal & Corporate Affairs since Jan 2019
             • CEO of Winmarkt group in the period Apr 2014 – Dec 2018. Worked in
               Winmarkt as Operating & Reporting Manager since January 2009 with
               responsibilities also for administration, planning and control and finance
             • Previously working as a qualified accountant and for international
               consultancy companies
             • Graduated in Economics and Commerce

                                                                                                                                                                              10
2 Operating Data
IGD: a portfolio of high quality assets

                              North                    Centro Sarca           Esp           Le Maioliche        Centro Borgo        Centro Lame        Puntadiferro
                                                      Sesto S.Giovanni
                                                            (MI)            Ravenna         Faenza (RA)           Bologna             Bologna             Forlì

        IGD - Main                                    Centro Leonardo        Conè           Centro Piave
                                                                                            San Donà di             Clodì           Centro Nova
                                                                                                                                     Villanova di
                                                                                                                                                      Mondovicino
                                                                                                                                                        Sc&Rp
                                                        Imola (BO)       Conegliano (TV)                        Chioggia (VE)
        Italian Asset                                                                        Piave (VE)                            Castenaso (BO)     Mondovì (CN)

                                                        Millennium
                                      Nuova Darsena       Gallery          La Favorita       Gran Rondò          Lungo Savio        Centro Luna          I Bricchi
                                         Ferrara       Rovereto (TN)        Mantova          Crema (CR)            Cesena            La Spezia       Isola d'Asti (AT)

                                                                          Centro Porto                                                                    Centro
                    Piazza Mazzini      Tiburtino        Maremà                            Cttà delle Stelle   Fonti del Corallo      Casilino
Center                 Livorno        Guidonia (RM)      Grosseto            Grande         Ascoli Piceno          Livorno             Roma             d'Abruzzo
                                                                          Porto d'Ascoli                                                                 Pescara

                                                                          >75% of the market value of
                        Le Porte        La Torre          Katané               Italian Malls and                Future                     Officine Storiche
South                  di Napoli        Palermo           Catania                                                                               Livorno
                     Afragola (NA)                                        Hypermarkets dominant⁽1⁾ in           Opening
                                                                          respective catchment areas

                1. Dominant assets: assets that are reference points for the consumers in their catchment area in terms
                of attractivity and offer quality                                                                                                               12
                   Key assets malls with> €70mn mkt value
Located in the most
attractive Italian regions
>80% of value of italian portfolio ITALY- 61 properties in 12 regions
concentrate in Northern & Central Italy (93.7% of total IGD market Value) GDP Per-capita
1 39.2k
1H2019 35.2k
30.9k
€ 2,388.2
3 5 # 38.0k 33.1k
2 n° of properties 30.3k
1
Romania 22 35.3k
6.3% 31.6k
S+l 7 30.4k 26.8k
7
12.2% 24.5k
NE
40.3% 2 24.7k
5 32.7k 19.8k
2 18.2k 18.4k
C 21.1k
20.6k
27.2%
17.2k
NO
14.0%
4 17.5k
Data as at 30/06/2019
>10.0% 5.9% – 0.1% €34.6k – €42.6k €20.6k – €29.9k
9.9% – 6.0% 0.0% €30.0k – €34.5k €16.8k – €20.5k
€28,500 €29,200
% of Portfolio Market Value
Italian average EU average
Data as at 30/06/2019 Data as at 31/12/2017
Sources: 13
Istat, Eurostat, IMFOur portfolio
€ 2,388.3mn
Other 4.3%
(100.7 €mn) Total GLA (Ita) 665,000 m² (market share c. 4%)
Romania 6.3%
(151.2 €mn)
A young portfolio: old on average 7 years
SMALL (since opening or last restyling)
10.5%
Full ownership of 16 Shopping centres (mall+hyper)
in Italy (63.2% of Italy core market value)
Malls 65.0% KEY 18 of 25 Hyper/Super (Ita) are small
(1,553.1 €mn)
53.9% (Sale area €70mn;Strong repositioning
of the Romanian Portfolio
7
1 5 9 13
2 6 10 14
1
2 Bistrita Piatra Neamt 8
Cluj-Napoca Vaslui
3 9
7 11
Turda
3
14 Galati
Key Strategical points
4 10 11
13 12
Ramnicu Valcea Braila Tulcea
Buzau • Further ¤4.5mn capex for
Ploiesti
5 safety, maintenance and
4 8 12
Slatina commercial improvements
Bucuresti - Hq
• Growth trend of rents
6
• Attention on operational
Alexandria
costs
• Focus on sustainability
2008 2009 2010 2011 2012 2013 2014 2015 2016 2017 2018 2019-2021
Acquisition
Surfaces recovery/Tenant Repositioning and complete external/internal refurbishement
Consolidation
New Plan
c.€20mn of investments c.€62mn of dividends generated since
Self-financing of the investments
No financial leverage (2008-2018) for the upgrade and
carried out the acquisition⁽1⁾
repositioning of the portfolio
Romanian portfolio considerably repositioned, currently generating important free-cash flow
15
1. Until June 2019Property investments
as at 30/06/2019
Net Initial
Gross Initial Net Initial
FY 2018 1H 2019 % Yield
Yield Yield
topped up
Italy Malls 1,573.79 1,553.06 (-1.32%) 6.43%
5.40% 5.40%
Italy Hypermarkets 585.63 583.38 (-0.38%) 6.07%
Romania 154.79 151.17 (-2.34%) 6.94% 5.80% 6.20%
Porta a Mare + developement + other 97.94 100.72
Total IGD Portfolio 2,412.15 2,388.33 (-0.99%)
Leasehold properties (IFRS16) N.A. 61.21
Total IGD Portfolio with leasehold 2,412.15 2,449.54 (+1.55%)
2,412.2 6.7 -28.0
1.1 -4.7 1.1 0.0 2,388.3
The Change in
FV is due for
about 60% to
change in market
rates and for
about 40% to
other changes in
cash flow*
€mln
Asset value as Italy project Change in Romania Change in Porta Medicea Change in Asset value
at 31/12/2018 and Capex market value project and market value project and market value as at
Italy capex Romania capex Porta Medicea 30/06/2019
16
*linked specifically to a forecast reduction in variable rentsEPRA NNNAV per share
as at 30/06/2019
€ per share 31/12/2018 30/06/2019
NAV 11.77 11.34 -3.6%
NNNAV 11.45 10.78 -5.8%
€ 11.45 €-0.50
Full effect of the €-0.20 €0.38 €-0.35 € 10.78
annual dividend
distributed in May
EPRA NNNAV Dividend Change in Debt Fair FFO Asset Fair Value EPRA NNNAV 30
31 DEC 2018 Value JUN 2019
and other
17IGD performances better and more resilient
than Italian GDP and consumption trends
IGD – LfL rental growth
Italy – GDP Growth IGD – LfL Rental Growth vs. Italy – GDP Growth %
IGD – Financial Occupancy
97.5% 97.4% 96.2% 96.9% 97.3% 96.8% 97.2% 96.4%⁽1⁾
3.1%
1.5% 1.7% 1.7% 1.5% 1.5%
1.0% 0.9% 1.3% 1.0%
0.7% 0.6% 0.5%
0.2% 0.1% 0.3% 0.1%
(0.1%)
(1.2%)
(1.7%)
(2.8%)
(5.5%)
2009 2010 2011 2012 2013 2014 2015 2016 2017 2018 30/09/2019
Always high, stable
and resilient IGD – Tenant sales vs. Italy – Households consumption %
occupancy over time
6.7%
4.3%
3.4%
2.6%
1.6% 2.2%
1.0% 1.3% 1.1% 1.1%
0.7%
0.5%⁽2⁾
0.0% 0.0%
(0.5%)
(1.1%) (1.6%)
(1.9%)
(1.8%)
(2.9)% (3.1%)(3.3%)
IGD – Tenant sales
Italy - Households 2009 2010 2011 2012 2013 2014 2015 2016 2017 2018 30/09/2019
consumption
1. Data as at 1 August 2019 Sources: I-STAT, EU Com 18
2. Household consumption expected for 2019– Istat IMF, EurostatFocus on trends
Italy as at 30/09/2019
Tenant sales and footfall progressive trends 2019 vs 2018
1Q 2Q 3Q
tenant sales tenant sales tenant sales
-0.4% +0.2% +0.4%
footfalls footfalls footfalls
-6.2% +0.6% -1.6%
2.0%
1.0% 1.4% 0.6% 0.1%
0.0%
0.0%
Jan 2019 Feb 2019 Mar 2019 Apr 2019 May 2019 Jun 2019 Jul 2019 Aug 2019 Sep 2019
-1.0%
-0.4% -0.2% -0.1% -0.3%
-2.0% -1.1% -1.2%
-3.0% -3.8% -3.9%
-2.3% -2.5% -2.3%
-4.0% -3.2% -2.9%
-5.0% -6.2%
-6.0%
Tenant sales
-7.0% Footfalls
Difficult 1Q also due to adverse Tenant sales/footfalls trends 3Q further improvements
weather conditions improvement in tenant sales
19Contracs in Italy and Romania
as at 30/09/2019
N 119 N 184 N 233 N 931
Average residual maturity: 4.88yrs
Total contracts: 1,467 of which during 9M2019
103 renewed with the same tenant and 77 signed
Malls with a new tenant
Italy
Upside 9M2019: +1.5%⁽1⁾ 15.9% 63.5%
12.5%
8.1%
Rotation Rate 5.2% (% new contract on tot contr)
2H2019 2020 2021 >2021
N1 N 24
Hyper Average residual maturity: 14.5yrs
Italy Total number of contracts: 25
5.7% 94.3%
2H2019 2020 2021 >2021
Average residual maturity: 4.8yrs N 84 N 229 N 120 N 152
Total contracts: 585 of which during 1H2019 152
renewed with the same tenant and 113 signed
Malls with a new tenant
Romania
Financial occupancy: 97.5% 24.6% 20.1% 47.5%
7.8%
Upside 9M2019: +3.3% (on renewals)
Rotation Rate 19.3% (% new contract on tot contr) 2H2019 2020 2021 >2021
20
1. Excluding one renewal in Centro Sarca (multiplex)On-going projects in Italy:
our idea of shopping
Weight of services turnover
A tailor made offer to satisfy our visitors on total IGD Malls turnover More space dedicated to services
New brands added: 5.3% • + 1 new dental clinic (Conè) in
• Lloa Be Natural (restaurant) in Centro Sarca 3.8% addition to the 20 already in
• Drogerie Markt (grocery) in Centro Piave operation
and Gran Rondò 2.2% • Merchandising mix constantly
• Baby Star (beauty salon and entertainment evolving thanks to the addition of
area for children) in Fonti del Corallo new brands and services
1h 2015 1h 2017 1h 2019
September 2019 – Refurbishment of the Cinema in Centro Sarca (Milan)
More than 5,500m², 10 theaters (of which one
equipped with IMAX technology) and relax
areas.
High
10 theaters
New entertainment model based on the tech
highest audio and technical standards, best in
class confort, computerisation and automation
of the ticketing area
Best in class Food court/relax
comfort area
21A new communication campaign
Institutional campaign
New image positioning for 7 of IGD’s quintessential shopping centers
(Centro Sarca, Le Maioliche, ESP, Centro D’abruzzo, Tiburtino, Katanè,
Le Porte di Napoli)
Strong focus on emotional engagement. Evocative graphic design
Claim: “I’m possible, the place where everything is possibile”:
shopping centers become a parallel dimension where people can
spend special time and where dreams become reality.
Internal and external signs/flag Distinctive features of the territory for each center
22Key tenants
as at 30/09/2019
Product Turnover Product Turnover
TOP 10 Tenant Contracts TOP 10 Tenant Contracts
category impact category impact
clothing 2. 9% 12 supermarket 10.0% 11
clothing 2.8% 13 clothing 7.5% 6
shoes 2.2% 9 clothing 4.1% 8
clothing 2.1% 28 clothing 4.1% 11
Top 10
Top 10
clothing 2.0% 10 Tenants drugstore 2.5% 5
Tenants
Romanian
Italian Malls electronics 1.7% 7 jewellery 2.0% 5
Malls
clothing 1.7% 27 pharmacy 2.0% 4
jewelley 1.3% 19 electronics 1.8% 1
leisure 1.3% 25 office 1.6% 1
perfurmery 1.3% 12 electronics 1.0% 5
Total 19.3% 162 Total 36.6% 57
Malls merchandsing mix Malls tenant mix Malls merchandsing mix Malls tenant mix
Household goods
7% Supermarkets
Culture, leisure, Restaurants International
Local brands 10%
gift items 7% International brands brands
12% Electronics
6% 41% Local brands 40%
Electronics 2%
Personal healthcare 11% 44%
Other
5% 31%
Services
7%
Entertanment
4%
Clothing
44%
Entertainment
13%
Clothing National brands National brands
52% 47% 16%
233 Sustainability
Sustainability as
essential driver 1/2

becoming         g.r.e.a.t.

       green             responsible                          ethical                        attractive                       together
Area                    Our committment

 Environmental            • 95% of the portfolio ISO 14001 certified
 certification            • BREEAM IN USE (at least at level «Very Good») for 5 more shopping centers

 Measures to reduce       • ¤5 mn expected for structural intervention in order to improve the energy efficiency
 energy consumption       • More photovoltaic systems will be installed

                          • Intervention on electric mobility (agreements with ENERHUB and TESLA)
 Sustainable mobility     • Definition of a feasibility study to favour cycling mobility
                          • Evaluation on the possibility to use bike and car sharing

 Circular economy         • Starting of the operating phase of the Waste2Value project and evaluation of other projects on the same issue

                                                                                                                                            25
Sustainability as
essential driver 2/2
green responsible ethical attractive together
• Continuous update • Anti-corruption • Exclusive and inclusive • Projects to capture
of the corporate Welfare certification project events insights from millennials
System • Maintaining highest • Cooperation with the regarding the shopping
• Monitoring of the work possible score (3 stars) local area center of the future and
environment and of legality rating • Analysis and definition from tenants regarding
definition of follow-up of measures to favour common sustainability
actions wellbeing inside projects
• Continuation of projects shopping centers
for the safety and
security of the structures
(anti- seismic and
anti-terrorism measures)
26The committment to sustainability continues
Activities carried out in 2019... ... and the results achieved
2 New photovoltaic systems (Gran Rondò and
Katanè)
Total electricity consumption decrease in the first
9 months
4 LED lighting systems (Gran Rondò, Fonti del
Corallo, Casilino and La Torre)
-3.7%
1 Detailed consumption monitoring system
1 Charging station powered by photovoltaic system
for 24 e-bikes (Clodì)
New photovoltaic system in Katanè New charging station for e-bikes in Clodì
27Awards and International Benchmark
EPRA sBPR Gold Award CommOnEnergy Award
For Sustainability Report 2014-15-16-17 For restyling_Centro Sarca)
Oscar di Bilancio Ferpi CNCC Design Award
For 2016 and 2017. IGD was one of the 3
finalists for the prize For ESP Shopping Center
GPR IPCM LFFS Sustainable Premio Innovazione SMAU R2B
Financial Index. IGD was included in 2017 For «Waste2Value» project
Carbon Disclosure Project Institutional Shareholder Services
In 2018 IGD confirmed the result obtained in IGD obtained the risk assessment value of 5 for
2016. The overall score obtained in the year was Governance, 2 for Enviroment and 3 for Social,
level C (in a range from A to D) on a scale of 1 (lower risk) to 10
284 FY 2018 + 9M2019
Financial ResultsFY 2018 and 9M2019
main results
2017 2018 9M2018 9M2019 9M2019Adj 9M19Adj/9M18
Revenues
• Rental Income €138.9mn €151.8mn +9.2% €113.0mn €116.0mn €116.0mn +2.7%
• Net Rental Income €111.9mn €124.0mn +10.9% €92.3mn €102.2mn €94.6mn +2.5%
EBITDA
• EBITDA (Core Business) €101.2mn €113.7mn +12.4% €85.1mn €94.4mn €86.7mn +2.0%
• EBITDA Margin
69.7% 71.9% +220pts 72.3% 78.1% 71.8% -50pts
(Core Business)
• EBITDA Margin from
79.2% 80.3% +110pts
Freehold
• Group Net Profit €86.5mn €46.4mn -46.3% €52.4mn €22.4mn €23.2mn n.a.
Core Business Funds from
€65.6mn €79.7mn +21.4% €59.5mn €62.9mn €62.9mn +5.6%
Operation (FFO
Core Business FFO per share⁽1⁾ €0.81 €0.72
1. Calculated on the year-end no. of share 30
2019 adj ex IFRS16 does not consider the application of the accounting principle IFRS16Rental Income (€mn)
Total LFL
+0.1% +3.1 €mn Total Rental Income
9M2019 -0.1% +2.7% Slight decrease in malls
+2.7% (-0.4%) due to a minor €116 mn
increase in vacancy and
0.2 116.0 0.6%
3.0 temporary discounts and a
decrease in variable revenues 6.4%
partially offset by an increase
113.0 -0.1 in rent of temporary spaces
Increase in hypermarkets
(+0.5%) 25.6%
Inflation rate impact ~60 bps
67.4%
Rental Income Change in Non LFL Change in LFL Rental income Malls Hypermarkets
3Q 2018 LFL Italy Italy Romania 3Q 2019 Romania Other
+12.9 €mn Total Rental Income
FY2018 +1.3% +2.9%
+9.2% €151.8 mn
0.5%
10.9 0.3 151.8
Growth of malls (+1.5%) 6.4%
138.9 1.7 Growth of hypermarkets
(+0.9%)
Indexation effect~ +90bps
26.5%
66.6%
Rental income Change in Non LFL Change in LFL Rental income Malls Hypermarkets
FY 2017 LFL Italy Italy Romania FY2018 Romania Other
Figures may not add up due to rounding
31Net rental income (€mn)
Italy
+2.5%
+€2.3mn Romania +€9.9mn
9M2019 +2.5% +1.8% +10.7%
3.1 -0.8 7.6
92.3 94.6 102.2
Net rental income Change in rental income Change in Net rental income 9M_Adj_2019* IFRS16 Effect Net rental income
9M _2018 rental costs 9M _2019
+12.1 €mn Italy
FY2018 +10.9% +11.8%
Romania
12.9 -0.8 +1.6%
111.9 124.0
Net rental income Change in rental income Change in rental costs Net rental income
FY_CONS_2017 FY_CONS_2018
32
*2019 adj ex IFRS16 does not consider the application of the accounting principle IFRS16Founds From Operations (FFO)
keep growing
+€3.3mn
9M2019 +5.6%
2.0 1.0 0.4
59.5 62.9
FFO_2018 Change in Change in Financial Change in taxes and other FFO_2019
EBITDA* Management
FY 2018 +21.4%
12.5 1.8 -0.2
65.6 79.7
FFO FY_CONS2017 Change in core business Change in financial Change in taxes and other FFO FY_CONS2018
EBITDA management (Net liability
Management)
* Net of non-recurring expenses
Ground rents Payable leases and adjusted cost of financial management have been considered in order to calculate the FFO 33
Figures may not add up due to roundingOutlook
FFO FY2019
REVISED OUTLOOK
released on 2 of August
+4/5%
Review to the previous guidance (+6/7%) considering:
• Weak consumption dynamics
• Slight increase in temporary and strategic vacancy (with a consequent increase in non re-chargeable costs)
• Temporary effects due to remodeling activities of
medium surfaces and hypermarkets
34Financial structure (1/2)
NEW RATING OBTAINED
FITCH RATINGS
BBB-
outlook stable
(22 October 2019)
30/06/2019 30/09/2019 30/06/2019 30/09/2019
48.2% 47.8% c. 0.97 x c. 0.95 x
LTV (excluding (excluding GEARING RATIO (excluding IFRS16 (excluding IFRS16
IFRS16 c. 47%) IFRS16 c. 46.7%) c. 0.93x) c. 0.91x)
3.8X 3.8X
AVERAGE LENGHT OF
ICR (excluding IFRS16 (excluding IFRS16 c. 3.8 years c. 3.5 years
c. 3.7x) c. 3.7x) LONG TERM DEBT
HEDGING ON LONG TERM
AVERAGE COST OF DEBT 2.4% 2.4% c. 93.3% c. 93.4%
DEBT + BOND
35Financial structure (2/2)
Debt Breakdown*
Net Debt
¤1,174.4 mn**
L.T. Bank Secured
1,155.83 52.8% 28.4%
S.T.
24.50 Market Unsecured
47.2% 71.6%
CASH -5.96
Debt maturity
2.5% 2.65% 21% 2.25%
5y 7y 5y*** 7y
Bonds
Bank debt unsecured
Bank debt secured
300 162 200 100
12 46 58 25 67 53 27 52
2019 2020 2021 2022 2023 2024 2025 >2025
* Debt calculated excluding the IFRS16 effect
** Net debt including IFRS16 (excluding it c. €1,118.2mn) 36
*** actual cost with 3 years hedging + estimates for the following yearsTitolo
titolo
5 Strategic Plan
2018-2019
note
37Retail:
a continuously evolving world
Malls gain importance
Shopping Centers Shopping Shopping Experience
Hypermarkets Mall + Hypermarket and Services Centers and Social Centers
From a simple place of Increased interaction and
Hypermarket as a centre of Greater and more specialised
purchase to shopping and personalisation with visitors
attraction for stores product offer
social gathering location E-commerce integration
Features
1970s-1980s 1990s 2000s Future of retail
38IGD's current positioning
and long-term commitment
Risk of Obsolescence for Shopping Centers
Shopping experience IGD important Supported by strategic relationship with
efforts for
repositioning high quality tenants
Low High-end services
and long-term
commitmen
Integration with the E-Commerce
Restaurants
Medum
Omnipresent Retailers
Low level fashion offer
High Focus on price
Old retail offer
39IGD Mission Statement
After a decade of growth...
A plan focused on strengthening the solid and sustainable leadership
of our shopping centers in their respective catchment area and to be
prepared for future challenges
402019-2021 Strategic Plan
A consolidation and enhancement plan based on 3 pillars
Innovation and operational Asset management Financial strategy
excellence
Great focus on innovation and Investments aimed at maintaining Maintaining a solid financial
operational excellence mainly in and increasing the quality of our structure in line with the
relation to commercial, portfolio favouring innovation, investment grade profile
marketing and sustainability merchandising mix,
areas attractiveness, the quality of
materials, as well as sustainability
41Our idea of shopping centres
in 6 key words 1/2
Target What we doing
Identify solutions that make • «Experience to be lived» project has already
shopping more engaging and been introduced in 2 Shopping Centers
Experience experiential in order to impress (Puntadiferro and Città delle Stelle) in 2018.
visitors: experience oriented 3 other Shopping Centers will be involved from
shopping center 2019
Entrench the Shopping Center
• Transfer within the shopping center of the
in its local area promoting good
Social Shopping rationale and dynamics of a social street,
relations and social behaviour in
phenomenon first created in Bologna in
Centre order to establish ties, exchange
via Fondazza in 2013, now involving over 100
knowledge and carry out projects
thousand people, not only in Italy
of common interest
• Chat bot technology: customer service by means
of 24/7 real time chat
Personalisation
of Shopping Focus on visitors, establishing • CRM (Customer Relationship Management)
Center / Visitor unique and special relations Strategy
relation
• Instagram: integrated management of the
Instagram channel in 16 Shopping Centers.
+ attractiveness + brand awareness + Facebook interaction
42Our idea of shopping centres
in 6 key words 2/2
Target What we doing
• Introduce EV charging stations (in 18 Shopping
Centers) and e-bike charging points
Introduce and manage a set of
tools which enable us to improve • More Services: 21 dental clinics (turnover up
Services our customers’ journey, also by +11.3%)
means of new technology
• Interactive digital communication by means of
totem in all the IGD centers
• Establish a channel of communication with the
Marketing office of the shopping mall tenants in
order to better identify innovative and common
Connect the online and offline solutions regarding the omnichannel issue
Ominchannel shopping experience
• Installation of Amazon lockers (21 on 27). 2 Poste
Italiane lockers have already been installed in
Sarca and Tiburtino Shopping Centers
Offer recreational
• Offer innovative, exclusive and inclusive events
opportunities within Shopping
(also through co-marketing activities) as part of
Entertainment Centers, enhancing their role as
the approx. 540 events held every year in the
an entertainment, activity and
IGD Shopping Centers
meeting location
43Business approach to align merchandising mix
with current trends
Broaden and diversify the retail offer Online-offline interaction
Services Sharing economy Entertainment Areas Kiosks
Introduction of new services (medical Introduction of new sharing economy Set-up of entertainment areas concei- Creation of kiosks for the collection of
and veterinary clinics, schools) activities (coworking, rental retail..) ved as primary destination online purchases
Tenants with a wider and more
Outlet complementary offer Food court Tenants present online
Creation of outlet stores in the Mall, in Introduction of tenants with merchan- More diversified offer, in line with new Search for online tenants who would
agreement with the tenants dise that complements the reduction trends (vegan, bio,..) like to open stores within the mall
of the hypermarkets
44Asset management:
4 main operating levers
1 Requalification of the existing portfolio (restyling/refurbishment)
2 Strategic agreement with Coop Alleanza 3.0: an opportunity
3 Completion of the current pipeline (Officine Storiche and ESP Entertainment)
4 Asset rotation
451 Restyling/refurbishement projects
Important track record in asset management
Between 2014 and 2018 we carried out and completed various extensions, remodeling and restyling work in our shopping
centers
Increase in Shopping
Shopping Center Date of work Type of work Center revenues⁽1⁾
Centro Sarca
(Milano) 1 Centro Sarca
(Milano)
2015
Complete restyling
and remodeling
22.4%
1
2 Centro Borgo
(Bologna)
2015
Complete restyling
and remodeling
21.4%
3
2 Esp
3 (Ravenna)
Esp
Centro Borgo 2017 Extension 61.4%⁽2⁾
(Bologna) (Ravenna)
Città delle Stelle
4 (Ascoli Piceno)
Tiburtino
6
5
Centro d’Abruzzo
(Chieti)
4 Cttà delle Stelle
(Ascoli Piceno)
2017 Remodeling 18.6%⁽2⁾
5
(Roma)
7 Centro d'Abruzzo Extension and
2014 14.4%
Le Porte di Napoli
(Chieti) restyling
(Napoli)
La Torre
(Palermo)
6 Tiburtino
(Roma)
2014 Remodeling 17.4%
8
7 Le Porte di Napoli
(Napoli)
2015 Remodeling 5.2%
8 La Torre
(Palermo)
2015 Remodeling 5.7%
Important advantages for our tenants with a positive effect on the long-term sustainability of rental income
1. In the first 2 years after the end of work 46
2. Revenue growth 2017/20161 Restyling/refurbishement project
Centro Casilino Fonti del Corallo Gran Rondò La Favorita
Shopping Center
Type of work Restyling Remodeling and Restyling Internal Restyling Internal and external Restyling
Restyling of the external Hypermarket reduction Following the extension Restyling of the facade,
facade and internal areas (new GLA 9,300 sqm) and the restyling of the the internal areas and the
together with (voluntary) and creation of new units facade, the restyling of car park
Description
seismic improvement in the Mall (new GLA the mall interior will be
measures on the Ground approx. 5,400 sqm) in carried out together with
Floor and First Floor which services will be the remodeling of the
inserted hypermarket
Unicoop Tirreno has
signed an extension to
the lease agreement with
expiry in 2037
Mall interior and exterior
restyling project (jointly
financed by BNP Paribas,
current owner of the mall)
Remodeling already done
End of work Completed 2H 2020 1H 2021
Restyling end of 2019
47Asset management activities
October 2019 - Restyling Casilino Shopping Center
Internal and external restyling with great attention placed on
sustainability
The retail offering has been renewed with an appealing
merchandising mix of local and national tenants - OVS, Yamamay,
Game Stop, Satur, Hoara Cosmetic, Cliniche Bellero (dental clinic)
The logo was renewed with the help of the students of a graphic
design institute of Rome
Investment ¤3.7 mn
Opening week-end
+11.4% footfalls
(vs same period 2018)
481 Restyling/refurbishement project:
other on going projects
Hypermarkets remodeling works have started in line with 2019-2021 Strategic Agreement with Coop (see following slides)
1 Goal:
reduction of the hypermarket area and creation of new retail units in the mall
2
• Hypermarket: completed (Le Maioliche) - work in progress (Conè) end of
2019
• Mall: work in progress – end of Feb 2020
3 Goal:
reduction of the hypermarket area and creation of new retail units in the
mall + center restyling (project by Lombardini 22) and seismic improve-
ment measures
• Hypermarket: work in progress – end of Nov 2019
• Mall: start of work Sept 2019 - end of Sep 2020
492 Strategic Agreement with Coop Alleanza 3.0,
partner / food anchor The role of the mall and the hypermarket
The role of the food anchor (hypermarket) remains fundamental with the ability to attract visitors.
Strong synergy between IGD and Coop that generates excellent operating / financial performances
For 7 out of 10 visitors⁽1⁾ the hypermarket is the reason they visit our
Shopping Centers
Current Situation Future Situation
• Continuos and effective Cooperation between the • Establish relations which are increasingly
Shopping Malls and Coop in the ordinary and structured and integrated with regard to common
extraordinary management of the centers marketing projects
• Cooperation with Coop for common marketing • More in-depth analysis on behaviour of
analysis consumers/visitors
• GLA surplus in some hypermarkets • Customer relationship management (CRM)
• Organisation of contests and events
• Take advantage of the unitary ownership to make
a better use of the GLA
50
1. Internal survey2 Strategic Agreement with Coop Alleanza 3.0,
partner / food anchor
Agreement regarding approx. €520 mn of the market value (approx. 21% of IGD total market value)
A framework agreement regarding the complete review of 18 contracts (out of a total of 20)
of the hypermarket portfolio rented to Coop Alleanza 3.0, has been signed:
1 2
Review of contractual terms and conditions: the expiry Qualitative review of assets: following the successful
dates of all the contracts affected by the agreement will remodeling of the hypermarkets and malls in Le Porte
be extended and some of the rents will be revised to di Napoli and Città delle Stelle, 5 assets have been
make them more stable and sustainable identified, where the number of stores/services in the
mall needs to be increased, by means of reducing the
hypermarket, in order to enhance the attractiveness of
the centers.
Targets
Requalification and
1 Stabilisation of lease
agreements in the long-term
2 Increase the sustainablity of
rents / future cash-flow
3 adaptation of the role of the
hypermarket in shopping
centers
512 Strategic Agreement with Coop Alleanza 3.0,
partner / food anchor
The main effects expected from the agreement, together with a higher rent sustainability, will be:
Pre agreement Average residual maturity: 7.1 years
Maturity of the
Coop Alleanza 3.0 26.5%
hypermarket Agreement effect:
17.0%
contracts • Reduced and uniform effort rate
(% on total rents) 13.3%
12.9% 12.2% • GLA Hypermarkets
7.5% -21,400m2 GLA Malls+18,600m2
7.4%
• Net rental impact of c. €-1.9 mn
2.4%
2.2% • Rents in line with ERV⁽1⁾
0 1 2 3 4 5 6 7 8 9 0 1 2 3 4 5
202 202 202 202 202 202 202 202 202 202 203 203 203 203 203 203
Post agreement Average residual maturity: 17.7 years
Maturity of the
Coop Alleanza 3.0 Break down by rental income IGD Group
hypermarket
contracts 94.7% Current End of plan
(% on total rents) breakdown breakdown
Hypermarket Hypermarket
27% 21/22%
5.3% Plan
period
Rest of the Rest of the
0 1 2 3 4 5 6 7 8 9 0 1 2 3 4 5 6 7
202 202 202 202 202 202 202 202 202 202 203 203 203 203 203 203 203 203 portfolio portfolio
73% 78/79%
52
1. ERV: rental value estimated as at 30/06/2018 by the independent appraisers who evaluated the real estate portfolio3 Pipeline Completion:
Porta a Mare Project overview
Molo Mediceo, Lips, Arsenale
Hotel, residential, services for
the port
Focus next slide
Officine Storiche
Work in progress
Retail: >15,000 sqm
Residential: 43 units
Focus next slide
Piazza Mazzini
Completed
Retail: already operational
since 2016, owned by IGD
Residential: 73 units of which
72 sold/pre- sold
Palazzo Orlando
Completed in 2009
Offices - Sold on 30/09/2019
533 Pipeline Completion: Officine Storiche
Retail: LET/PRE-LET >60%
Work restarted*: March 2019
End of work: 2H 2020
Total expected investment: € 53 mn (remaining ca.€ 20 mn)
Total surface: 20k sqm, of which 15k sqm devoted to retail
Stores: 30 + 10 restaurants + 1 fitness center
The area will connect the city’s downtown with the sea and transform the old-style
spaces based on a totally new concept with a unique design and a rich retail offering
* Following the new building permits, based on the changes to the original project, which also includes 43 apartments and 500 54
parking places3 Pipeline Completion: Other areas
Molo Mediceo Arsenale
Lips: hyphotesis of a 4-star business hotel and residence with
apartments designed for ship crews or student housing
Arsenale: possibility of one or more residences
Molo Mediceo: services for the touristic port
The enhancement and pre-marketing of the 3 areas are being
studied for future disposals
Lips
554 Asset rotation Strategy
Rationalisation of the portfolio through the
disposal of some non-strategic assets for €150-200mn is under evalutation
Income from disposals
will be primarily allocated to reduce debt and leverage and partly re-invested
564 Asset rotation: what we did
30 September 2019: IGD signed final contracts for the sales of assets
Sale of Palazzo Orlando (office building) part of the Purchase of the 50% interest in the Darsena City
Porta a Mare development project in Livorno Shopping Mall in Ferrara (of which IGD iscurrently
joint-owner)
Total GLA: 5,270 sqm
Sale price: € 12.8 mn (in addition taxes) Total GLA: 16,250 sqm
N. of shops: 19
Sale price: € 13.9 mn (in addition taxes)
These agreements will allow IGD to focus on its core business (real estate retail)
57Financial strategy
Maintain a rigourous financial discipline in line with the Investment Grade
profile
Improve and further reduce the LTV
Lower the exposure to
financial risks (interest rate
Improve the liquidity profile while maintaining a significant share of medium
long-term debt (currently equal to approx. 80%⁽1⁾)
and credit) and obtain the
best available capital market
conditions
Maintain a balanced debt structure between bank debt and bond debt
(maximum flexibility in the sources of financing)
Broaden the investor base
58
1. As at 30/09/2018Revenues and FFO
4 years of considerable growth… Driven by new openings and acquisitions Consolidation plan with a
sustainable growth
Gross rental income CAGR Plan period 2019-2021⁽1⁾
€mn CAGR: c.+7%
151.8
138.9
131.3
121.1 C.+2%
115.6 LFL C.+1.7%
2014 2015 2016 2017 2018
FFO FFO ps
€mn CAGR: c.+23% c.€ 0.72
+21.4%
79.7
65.6
53.9
45.3 C.+3%
35.1
2014 2015 2016 2017 2018
59
1. Including the estimated effect of the asset rotation policyInvestments
Total investment plan⁽1⁾
€mn
Casilino
Fonti del Corallo ~30
Gran Rondò
La Favorita +
Other minor projects+
Investments to
support marketing
activities ~26 New projects such as
Officine Storic heand
Entertainment ESP ~90
Capex to maintain
the assets quality
and safety ~ 1% of the
~35 portfolio total market
value
Restyling / refurbishment Pipeline Completion Other Capex Total investments over
Plan period
1. Plus c. €10mn of further non retail investments concerning Porta a Mare project (in particular Officine Storiche residential area 60
which will be sold)Financial targets:
a clear and defined path
LTV Average cost of debt ICR
c.4X
>45%Dividend Policy...
bringing to growing FFO and dividends
Constant FFO and dividends growth €mn
81% 72% 68% 84% 69%
0.50 0.50
Target
0.45
0.40 79.7
0.38 Offer an attractive and
65.6
sustainable dividend
53.9 55.2 55.2 over time
45.3
35.1% 36.6
32.5
28.4
2014 2015 2016 2017 2018
%FFO Distributed FFO €mn Div €mn Div ps €
62Further option of growth
A Strategic Plan aimed at strenghtening the leadership of our shopping centers, without further acquisitions
IGD’s idea, to act as a platform able to aggregate new assets in order to further increase its market share
and pursue greater economies of scale, remains valid
Always subject to adequate market conditions
63Final remarks
1 Built a portfolio of dominant shopping centers in their catchment area and integrated
within the urban fabric
2 Focus on new market trends, innovation and quality of the assets to enhance the leadership
of shopping centers
3 Strategic agreement with COOP Alleanza 3.0: a unique and distinctive opportunity
4 Strong commitment in reducing financial leverage (end of plan LTVTitolo
titolo
6 Appendix
note
65Consolidated Income Statement
(a) (b) (c)
GROUP CONSOLIDATED
9M_CONS_2018 9M_CONS_2019 9M_CONS_Adj_2019* (b)/(a) (c)/(a)
Revenues from freehold rental activities 103.6 106.7 106.7 3.0% 3.0%
Revenues from leasehold rental activities 9.4 9.4 9.4 -0.3% -0.3%
Total income from rental activities 113.0 116.0 116.0 2.7% 2.7%
Rents and payable leases -7.7 -0.1 -7.7 -98.8% 0.4%
Direct costs from rental activities -13.0 -13.8 -13.8 6.1% 6.1%
Net rental income 92.3 102.2 94.6 10.7% 2.5%
Revenues from services 4.6 4.8 4.8 2.5% 2.5%
Direct costs from services -3.8 -4.0 -4.0 4.1% 4.1%
Net services income 0.8 0.8 0.8 -5.4% -5.3%
HQ Personnel expenses -4.9 -5.0 -5.0 0.9% 0.9%
G&A expenses -3.1 -3.6 -3.6 15.7% 15.7%
CORE BUSINESS EBITDA (Operating income) 85.1 94.4 86.7 11.0% 2.0%
Ebitda Margin core business 72.3% 78.1% 71.8%
Revenues from trading 4.1 0.4 0.4 -90.7% -90.7%
Cost of sale and other costs from trading -5.0 -0.8 -0.8 -84.4% -84.5%
Operating result from trading -0.9 -0.4 -0.4 -56.8% -56.8%
EBITDA 84.1 94.0 86.3 11.7% 2.6%
Ebitda Margin 69.2% 77.6% 71.3%
Impairment and Fair Value adjustments -4.8 -46.3 -38.6 n.a. n.a.
Depreciations and Provisions -0.7 -0.8 -1.0 5.4% 37.0%
EBIT 78.6 46.9 46.8 -40.4% -40.5%
FINANCIAL MANAGEMENT -24.3 -24.7 -23.3 1.9% -4.1%
EXTRAORDINARY MANAGEMENT 0.0 0.0 0.0 n.a. n.a.
PRE-TAX PROFIT 54.4 22.2 23.5 -59.2% -56.8%
PRE-TAX PROFIT -2.0 0.2 -0.3 n.a. -83.4%
PROFIT FOR THE PERIOD 52.4 22.4 23.2 -57.3% -55.7%
(Profit/Loss) for the period related to third parties 0.0 0.0 0.0 n.a. n.a.
GROUP NET PROFIT 52.4 22.4 23.2 -57.3% -55.7%
* 2019 adj ex IFRS16 does not consider the application of the IFRS16 accounting principle 66
Figures may not add up due to roundingFounds from Operations (FFO)
€62.9 mn (+5.6%)
Funds from Operations CONS_2019 CONS_2018 vs cons 2018 %
Core Business EBITDA* 94.7 85.1 9.6 11.3%
IFRS16 Adjustments (payable leases) (7.6) 0.0 (7.6) n.a.
Adj Financial management (23.3) (24.3) 1.0 (4.1%)
Adj Extraordinary management - 0.0 - n.a.
Adj current taxes for the period) (0.9) (1.2) 0.4 (30.2%)
FFO 62.9 59.5 3.3 5%
67
* Net of non-recurrng expensesNNNAV
NNNAV Calculation 31/12/2018 (a) 30/06/2019 (b) % (b vs a)
€'000 € p.s. €'000 € p.s.
Total shares 110,341,903 110,341,903
1) Group shareholders' equity 1,252,338
585.63 11.35 1,202,438 10.90 -4.0%
Excludes
Fair value of financial instruments 17,364 21,204 n.a
Deferred taxes 28,480 27,274 n.a
Goodwill as a result of deferred taxes
2) EPRA NAV 1,298,182
585.63 11.77 1,250,916 11.34 -3.6%
Excludes
Fair value of financial instruments (17,364) 21,204 n.a
Fair value of debt 11,116 (12,569) -213.1%
Deferred taxes (28,480) (27,274) n.a
3) EPRA NNNAV 1,263,454 11.45 1,189,869 10.78 -5.8%
68Further Financial Highlights
30/06/2019 30/09/2019
Share of M/L debt 93.5% 93.3%
Uncommitted credit lines granted €181 mn* €181 mn*
Uncommitted credit lines available €158.3 mn €156.5 mn
Committed credit lines granted and available €60 mn €60 mn
Unencumbered assets €1,447.4 mn €1,447.4 mn
69
* Some banks allowed us to transform them in medium/long-term not granted credit linesRe-classified Balance Sheet
Sources - Uses of funds (€/000) 30/09/2019 30/06/2019 %
Fixed assets 2,381,122 2,370,089 11,033 0.47%
Assets under construction and advances 40,846 36,619 4,227 11.54%
Intangible assets 12,524 12,401 123 0.99%
Other tangible assets 9,030 9,039 (9) (0.10%)
Non-current assets held for sale 0 12,770 (12,770) (100.00%)
Sundry receivables and other non current assets 121 113 8 7.08%
Equtiy investments 223 280 (57) (20.36%)
NWC 21,739 22,920 (1,181) (5.15%)
Funds (5,650) (8,898) 3,248 (36.50%)
Payables and other non current liabilities (21,804) (21,796) (8) 0.04%
Net deferred tax (assets) / liabilities (24,376) (25,008) 632 (2.53%)
TOTAL USE OF FUNDS 2,413,775 2,408,529 5,246 0.22%
Total shareholders' equity 1,217,460 1,202,437 15,023 1.25%
Net (assets) and liabilities for derivative instruments 21,941 21,204 737 3.48%
Net debt 1,174,374 1,184,888 (10,514) (0.89%)
TOTAL SOURCES 2,413,775 2,408,529 5,246 0.22%
GEARING RATIO (€000) 0.97 0.95
1,219,731 1,235,090
1,184,888 1,174,374
Adj Net Equity Net Debt
30/06/2019 30/09/2019
70Italian Portfolio:
hypermarkets and shopping malls
27 shopping malls 25 hypermarkets Tenants of hypermarkets
Centro D'Abruzzo - Pescara Centro D'Abruzzo - Pescara Coop Alleanza 3.0
Clodì - Chioggia Clodì - Chioggia Coop Alleanza 3.0
Porto Grande - Porto d'Ascoli (AP) Porto Grande - Porto d'Ascoli (AP) Coop Alleanza 3.0
ESP - Ravenna ESP - Ravenna Coop Alleanza 3.0
Centro Borgo - Bologna Centro Borgo - Bologna Coop Alleanza 3.0
Conè Retail Park - Conegliano (TV) Conè Retail Park - Conegliano (TV) Coop Alleanza 3.0
Full ownership Le Maoliche - Faenza Le Maoliche - Faenza Coop Alleanza 3.0
Lungo Savio - Cesena Lungo Savio - Cesena Coop Alleanza 3.0
16 shopping centres Città delle Stelle - Ascoli Piceno Città delle Stelle - Ascoli Piceno Coop Alleanza 3.0
(mall + hypermarket) Katanè - Catania Katanè - Catania Coop Alleanza 3.0
Centro Lame - Bologna Centro Lame - Bologna Coop Alleanza 3.0
Centro Leonardo - Imola (BO) Centro Leonardo - Imola (BO) Coop Alleanza 3.0
La Torre - Palermo La Torre - Palermo Coop Alleanza 3.0
Casilino - Roma Casilino - Roma Uncoop Tirreno
Le Porte d Napoli - Afragola (NA) Le Porte d Napoli - Afragola (NA) Distribuzione Centro Sud Srl (ipercoop)
Tiburtino - Guidonia (RM) Tiburtino - Guidonia (RM) Distribuzione Centro Sud Srl (ipercoop)
Millennium Gallery - Rovereto (TN)
Puntadiferro - Forlì (FC)
Centroluna - Sarzana (SP)
La Favorita - Mantova
Maremà - Grosseto
11 shopping malls Centro Sarca - Sesto S. Giovanni (MI) Hypermkts not owned by IGD
Mondovicino Retail Park - Mondovì (CN)
Gran Rondò (Crema)
Piazza Mazzini (Livorno)
I Bricchi - Isola d'Asti (AT)
Darsena City - Ferrara
Supermkt Civita Castellana (Viterbo) Unicoop Tirreno
Supermkt Cecina (Livorno) Unicoop Tirreno
Hypermkt Le Fonti del Corallo - Livorno Unicoop Tirreno
Hypermkt Schio-Schio (Vicenza) Coop Alleanza 3.0
9 hypermarkes Malls not owned by IGD Hypermkt LUGO - Lugo (RA) Coop Alleanza 3.0
Hypermkt IL MAESTRALE - Senigallia (AN) Coop Alleanza 3.0
Hypermkt MIRALFIORE - Pesaro Coop Alleanza 3.0
Supermkt AQUILEJA - Ravenna Coop Alleanza 3.0
Hypermkt I MALATESTA - Rimini Coop Alleanza 3.0
71Governance
Directors and Committees
IGD’s governance has been in line with the criteria of the Self Regulatory Code of Italian Stock Exchange since it was listed.
An internal Corporate Governance Code has been in use since 2008
Chairman CEO
Executive
Elio Gasperoni Claudio Albertini
Vice Chairman
Rossella Saoncella Eric Jean Veron Luca Dondi Dall'Orologio
Granarolo Vailog - General Manager Nomisma - CEO
Former General Manager
Independent Sergio Lugaresi Timothy Santini
Consultant - ABI, EBA, IMF Former Eurocommercial
Head of Italian activities
Elisabetta Gualandri Livia Salvini
Università di Modena - Professor Lawyer
Università LUISS di Roma - Professor
Non Executive Gian Maria Menabò Alessia Savino
Coop Alleanza Unicoop Tirreno
Non Independent Head of Asset Management and Development Head of Finance and Asset Management
Committees: Internal Control and Risk Management System
Nominations and compensation Committee Held by Chairman, including the
Control and Risks Committee International Audit and Risk Management
Committee for Related Parties Transactions
72Focus on E-Commerce in Italy
E-commerce in Italy: 7.3% of total retail sales E-commerce on total retail sales⁽1⁾ %
21%
20%
25%
18%
• E-commerce penetration in Italy is lower when 16%
compared to other industrialised countries, this is 20%
14%
Low not only a delay in its infiltration but it is due to
15%
cultural and structural factors
E- Commerce
10% 7,30% 7%
penetration • Total online sales in Italy in 2019: ¤31.6bn of which
43% services (penetration 11%) and 52% products 5%
(penetration 6%)
0%
China UK US Germany France Italy Spain
Impact of e-commerce on the various merchandising categories⁽²⁾
Food
4% 3% Clothing
Other services 10%
3% Publishing industry
1% Furnishing
1% Health and beauty
Impact of 5% Electronics
Online purchases
on shopping 8% Insourance
centre purchases:
ca. 38%
Toursm 43%
22% Online shopping specialist
(Amazon, eBay...)
1. Source: Osservatorio eCommerce B2c - Politecnico di Milano research department 73
2. Source: internal processing on data from “E-commerce in Italia 2019”, Casaleggio Associati, April 2019Claudia Contarini, IR T. +39. 051 509213 claudia.contarini@gruppoigd.it Elisa Zanicheli, IR Team T. +39. 051 509242 elisa.zanicheli@gruppoigd.it Federica Pivetti, IR Team T. +39. 051 509260 federica.pivetti@gruppoigd.it Follow us on
You can also read