ROLE OF BIG DATA ANALYTICS IN INCREASING BRAND EQUITY WITHIN PHARMACEUTICAL INDUSTRY
←
→
Page content transcription
If your browser does not render page correctly, please read the page content below
Academy of Entrepreneurship Journal                                                                    Volume 28, Issue 1, 2022

     ROLE OF BIG DATA ANALYTICS IN INCREASING
      BRAND EQUITY WITHIN PHARMACEUTICAL
                     INDUSTRY
                           Tareq N. Hashem, Isra University
                       Diana Moh’d Adnan Homsi, Isra University
                  Sultan Mohammad Said Sultan Freihat, Isra University
                                                       ABSTRACT

        The current study aimed at examining the influence of big data analytics (Consumer
Acquisition and Retention, Personalization, Cost Reduction and Targeted Advertising) and its
role in increasing brand equity within pharmaceutical industry in Jordan during the fiscal year
2020-2021. For that sake, quantitative method was used and a questionnaire was developed and
uploaded online in order to collect primary data. A sample of (94) marketing and sales
managers in pharmaceutical companies and drug stores in Jordan responded to the
questionnaire. SPSS v. 23rd was used in order to screen and analyze gathered data; study
indicated that the main hypothesis was accepted and big data analytics play a role in increasing
brand equity within pharmaceutical industry in Jordan with high level of relationship and an
explained variance of 59.7%. In addition to that, study was able to uncover the fact that
marketing and sales managers in pharmaceutical companies and drug stores in Jordan seemed
to have a high level of awareness regarding the concept of brand equity and big data analytics
as their answers were positive and reflected reliability of study tool. As for variables of big data
analytics, it was revealed that big data helps brand equity through the targeted advertising
which focuses on orienting the brand to the right audience who are able to help its reputation,
equity and meaning. Study recommended taking care of the quantities of data that are received
by organizations during marketing campaigns, as this data can be converted into valuable
information if properly arranged and organized.

Keywords: Pharmaceutical, Big Data Analytics, Brand Equity, International Brand, Brand
Reputation.

                                                   INTRODUCTION

        There are many ways and methods that help create and appear goods that have brand
value and create this value, as there are three basic elements that need to be taken into
consideration in order to transform the commodity from a normal commodity to a branded one,
which is the customer’s point of view in the first place and then Negative and positive effects
and ultimately the final value (Gordon et al., 2013). The customer’s point of view mainly
includes his knowledge and experience with this brand and its products, as the customer’s point
of view results in a set of positive and negative effects. In the event that the value of the
customer’s brand is highly positive, this would be beneficial. And the positive on the company
and its products, and the opposite is completely true, in the event that the value is negative, this
would reflect negatively on the value of the commodity (Akter & Wamba, 2016).

                                                             1                                             1528-2686-28-1-134
Citation Information: Hashem, T.N., Homsi, D.M.A. & Sultan Freihat, S.M.S. (2022). Role of big data analytics in increasing brand
                       equity within pharmaceutical industry. Academy of Entrepreneurship Journal, 28(1), 1-13.
Academy of Entrepreneurship Journal Volume 28, Issue 1, 2022
In order to reach these results, and create value for the brand, marketers are in constant search for
the best and most successful ways and resorted to e-marketing by relying on e-mail, social media
sites, smart phone applications, and many others, which resulted in a large amount of data and
information related to customers, their preferences, desires, and search trends (Chong et al.,
2017).
Problem Statement
According to Wuepper & Patry (2017); it is possible for organizations to create high
value for their brand by making it easily distinguishable and better than other similar products in
terms of its quality and reliability. Chiang & Yang (2018) added that brands include everything
that distinguishes the commodity from other commodities, and this includes letters, numbers, and
symbols, which take a distinctive form that distinguishes the commodity from other
commodities. While Anshari et al. (2018). Cohen (2018) argued that a brand is divided into a
regular brand and a famous brand (high end). The famous brand can travel across countries
through the means of communication, advertising and the impact of commercial globalization.
Recently, we hear a lot about the term Big Data and the rapid spread of this field in the labor
market. But have we ever wondered what Big Data is? In order to agree in principle, there is
more than one definition of the term Big Data, as explained by the International
Telecommunication Union (ITU) that there is no precise definition of big data. In general, when
we talk about big data, we are talking about data of various types, sources and sizes.
Based on the above argument, the current study aimed at examining the influence of big data
analytics on brand equity within Jordanian pharmaceutical industry and drug stores from the
perspective of marketing and sales managers.
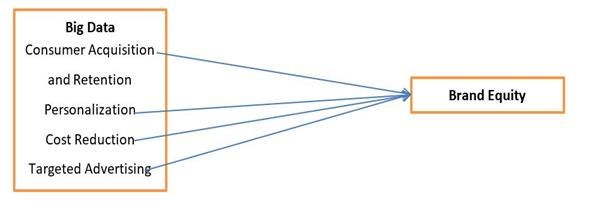
Model and Hypotheses
Based on the above argument, researchers presented the following model in order to
highlight the relationship between study variables (Figure 1)
(Anshari et al, 2018; Cohen, 2018; Bourreau et al, 2017; Wuepper and Patry, 2017; Chiang and Yang, 2018)
FIGURE 1
STUDY MODEL
Hypotheses Development
2 1528-2686-28-1-134
Citation Information: Hashem, T.N., Homsi, D.M.A. & Sultan Freihat, S.M.S. (2022). Role of big data analytics in increasing brand
equity within pharmaceutical industry. Academy of Entrepreneurship Journal, 28(1), 1-13.Academy of Entrepreneurship Journal Volume 28, Issue 1, 2022
Based on the above hypotheses testing, researchers were able to extract the following set
of hypotheses:
H: Big data analytics positively influences brand equity
H 1: Consumer acquisition and retention positively influences brand equity
H2: Personalization positively influences brand equity
H3: Cost reduction positively influences brand equity
H4: Targeted advertising positively influences brand equity
LITERATURE REVIEW
The Concept of Brand Equity
Chiang & Yang (2018) defined brand equity as the results of marketing efforts for a
product, which would turn this product into a brand compared to the same product if it did not
receive the same marketing efforts and did not turn into a brand. While Marques et al (2020)
defined it as the value that the company generates from a product that has succeeded in achieving
great popularity among people Brand equity is related to the value of the brand for the marketer
and the consumer alike (Delanoy & Kasztelnik, 2020). It means to the marketer more profit,
more cash flow and more market share (Hashem, 2021). For example, in Britain, Hitachi and GE
established a factory for televisions, and these televisions were sold at a higher price of $ 75 once
the name Hitachi was put on them this reflects the value of the name Hitachi (Holmlund et al.,
2020).
From a consumer's point of view, brand equity means a strong positive attitude to a brand
and a favorable valuation based on positive meanings and beliefs that are easy to retrieve and
activate (Keller & Brexendorf, 2019). Foroudi et al. (2018) argued that these three factors create
a preferential relationship between the consumer and the brand which is a valuable thing for the
company and an essential component of the value of the brand. According to Seo and Park
(2018); marketers can get the value of a mark through three actions: build it, rent it, or buy it,
where companies can build the value of the brand by emphasizing that the relationship really
provides positive results, linking and emphasizing it through advertising, taking into account the
time factor in the formation of this value, for example, Mercedes Motors (Lim et al.,
2020). Mourad et al. (2020) also noted to the fact that organizations can rent the intangible value
of the brand by expanding the use of the mark with a positive attitude and linking it to another
product, for example: Coca-Cola contains in its old product lines dedicated to diet, caffeine-free,
cherry juice……etc. There are several studies that confirmed the success of brand expansion and
exploitation of its good image and its suitability for other products (Algharabat et al., 2020);
(Liu, 2020); (Zollo et al., 2020); (Ebrahim, 2020).
Big Data
Before we get to the definition of big data, we must know what is dat? Amado et al.
(2018) defined data as the raw image of the information before the operations of sorting,
3 1528-2686-28-1-134
Citation Information: Hashem, T.N., Homsi, D.M.A. & Sultan Freihat, S.M.S. (2022). Role of big data analytics in increasing brand
equity within pharmaceutical industry. Academy of Entrepreneurship Journal, 28(1), 1-13.Academy of Entrepreneurship Journal Volume 28, Issue 1, 2022
arranging and processing, and it cannot be used in its initial form before processing. Raw data
can be divided into three types:
Structured data: data that is organized in tables or databases.
Unstructured data: It constitutes the largest proportion of the data, which is the data that people generate
daily from text writings, images, videos, messages, clicks on websites ... etc.
Semi-structured data: It is considered a type of structured data, but the data is not in the form of tables or
databases.
Experts Ducange (2018); Buhalis & Volchek (2021); Nair et al. (2017) - define big data
as any set of data that exceeds the ability to process it using traditional database tools from
capturing, sharing, transferring, storing, managing and analyzing within an acceptable period of
time for that data; from the point of view of service providers, it is the tools and processes that
organizations need to deal with a large amount of data for the purpose of analysis. The two
parties agreed that it is huge data that cannot be processed by traditional methods in light of the
aforementioned restrictions (Wright et al., 2019); (Ćurko et al., 2018). From the perspective of
De Luca et al. (2020), big data is defined as high-volume, fast-flowing and diversified
information assets that require cost-effective and innovative processing methods to develop
insights and decision-making methods. IBM – the leading computers company – stated that big
data is created by everything around us and at all times every digital process and every exchange
in social media produces big data for us, transmitted by systems, sensors, and mobile devices big
data has multiple sources in speed, size and diversity and to extract moral benefit from Big Data
We need perfect handling, analytical abilities, and skills (Montgomery et al, 2019).
Another definition for big data presented by André et al (2018) who argued that big data is a set
or sets of data that has its own unique characteristics (such as size, speed, diversity, variance,
data validity, etc.) which cannot be efficiently processed using current and traditional technology
to achieve its benefit.
Sources of Big Data
According to Matz & Netzer (2017), there are multiple source from an organization can
obtain data, these sources include:
Resources arising from running a program, whether governmental or non-governmental, such as electronic
medical records, hospital visits insurance records, bank records, and food banks.
Commercial or transaction-related sources, arising from transactions between two entities, for example
credit card transactions and transactions conducted via the Internet, including through mobile devices.
Sensor network sources, for example, satellite imaging, road sensors, and climate sensors.
Tracking device sources, for example tracking data from mobile phones and the Global Positioning System.
Behavioral data sources, for example, Internet searches for a product, service, or other type of information,
and page views on the Internet.
Data sources for opinions, for example, comments on social media.
Big Data Analytics in Marketing
According to Buhalis & Volchek (2021), big data analytics is the use of advanced
analytics techniques against large and diverse data classes that include structured, semi-
structured and unstructured data from different sources, and in sizes from terabytes to zettabytes.
Wang & Wang (2020) argued that big data is a term applied to categories of data whose size or
4 1528-2686-28-1-134
Citation Information: Hashem, T.N., Homsi, D.M.A. & Sultan Freihat, S.M.S. (2022). Role of big data analytics in increasing brand
equity within pharmaceutical industry. Academy of Entrepreneurship Journal, 28(1), 1-13.Academy of Entrepreneurship Journal Volume 28, Issue 1, 2022
type exceeds the traditional ability of relational databases to capture, manage, and run data with
low latency. Montgomery et al. (2019) also state that big data has one or more of the following
characteristics: high volume, high speed, or high diversity. Artificial intelligence, mobile
devices, and the Internet of Things are increasing the complexity of data with new data forms
and sources. For example, big data comes from sensors, devices, video/audio files, networks, log
files, transactional applications, the web, and social media - much of it being generated in real
time and on a very large scale (Ducange et al., 2018).
On the other hand, Liu et al. (2019) argued that big data analysis allows analysts, researchers,
and business users to make better and faster decisions using data that was previously inaccessible
or used. While Kauffmann et al. (2020); Singh et al. (2018) indicated that companies can use
advanced analytics techniques such as text analysis, machine learning, predictive analytics, data
mining, statistics and natural language processing to gain new insights and insights from
previously untapped data sources independently or with existing enterprise data.
METHODOLOGY
Adopting the quantitative appraoch, current study collected primary data using a
questionnaire; the questionnaire consisted of two main section including demographics of study
sample and statements related to study variables (Consumer Acquisition and Retention,
Personalization, Cost Reduction and Targeted Advertising). The questionnaire was built on likert
5 scale and was uploaded online – for COVID-19 health precautions- for a time of 12 weeks in
order to collect as much data as possible.
Population of study consisted of marketing and sales managers in pharmaceutical
companies and drug stores in Jordan through the fiscal year 2020-2021. A convenient sample of
(100) was meant to be reached; but after application process researchers were able to retrieve
(94) properly filled questionnaire and reaching a statistical ratio of 94% as accepted.
SPSS V. 23rd was used in order to screen and analyze gathered primary data. Cronbach
Alpha was used to test the stability of the scale as in results appearing within Table 1 below. It
was found that alpha value for each variable was greater than accepted percent 0.60; that
reflected the reliability of the scale.
Table 1
RELIABILITY OF STUDY TOOL
Variable Alpha
Consumer Acquisition and Retention 0.792
Personalization 0.858
Cost Reduction 0.671
Targeted Advertising 0.779
Brand Equity 0.785
Other used statistical tests included:
Descriptive Statistics (mean, percentage, frequency, std. deviation)
Multiple Regression
OLS Regression
5 1528-2686-28-1-134
Citation Information: Hashem, T.N., Homsi, D.M.A. & Sultan Freihat, S.M.S. (2022). Role of big data analytics in increasing brand
equity within pharmaceutical industry. Academy of Entrepreneurship Journal, 28(1), 1-13.Academy of Entrepreneurship Journal Volume 28, Issue 1, 2022
Analysis
Demographic results
Frequency and percentage of respondents were calculated as according to the below table
2. It can be seen that majority of study sample were males forming 74.5% compared to females
who only appeared to have a portion of 25.5%. As for academic qualification and experiences, it
can be read through the table that majority of respondents held PhD degree forming 63.8% and
who had an experience in the field of 10-13 years forming 41.5% of total sample (Table 2).
Table 2
DESCRIPTIVE STATISTICS OF SAMPLE
f %
Gender
Male 70 74.5
Female 24 25.5
Education
Diploma 11 11.7
BA 22 23.4
MA 1 1.1
PhD 60 63.8
Experience
2-5 16 17.0
6-9 30 31.9
10-13 39 41.5
+14 9 9.6
Total 94 100.0
Questionnaire Analysis
Mean and std. deviation of sample's attitudes towards statements of questionnaire were
calculated. Results showed that respondents had positive attitudes towards statements of
questionnaire as all means scored higher than mean of scale 3.00 which is statistically positive.
Going deeper into analysis, the highest positively answered statement was "Through big data,
sales, marketing data and accounts can be reviewed for optimal cost reduction" soring a mean of
4.20/5.00 and a std. deviation of .979 compared to the least positively answered statement which
was " It is possible to retain lost customers knowing a lot about them" scoring a mean of
3.50/5.00 and a std. deviation of 1.276.
The same tests were run on study variables in genera in order to highlight their mean and
std. deviation. As Table 3 and Table 4 below indicated the highest mean was for "brand equity"
scoring a mean of 3.99/5.00 and std. deviation of .670 compared to the least positively received
variables which was "customer acquisition and retention" scoring a mean of 3.75/5.00 and a std.
deviation of 0.793.
6 1528-2686-28-1-134
Citation Information: Hashem, T.N., Homsi, D.M.A. & Sultan Freihat, S.M.S. (2022). Role of big data analytics in increasing brand
equity within pharmaceutical industry. Academy of Entrepreneurship Journal, 28(1), 1-13.Academy of Entrepreneurship Journal Volume 28, Issue 1, 2022
Table 3
MEAN AND STD. DEVIATION OF STATEMENT
Mean Std. Deviation
Big Data
Consumer Acquisition and Retention
Knowing so much about customers increases the chances of
3.56 1.093
their loyalty
It is possible to retain lost customers knowing a lot about them 3.50 1.276
Collecting data about customers eases the process of satisfying
3.85 .983
them
There would be a chance to engage customers with material
3.78 1.039
that is relevant to their interest
Suitable content can attract customers' attention 4.09 .947
Personalization
Personalization increases advertising effectiveness 3.69 1.068
Through personalization, consumers' needs are understood
3.94 .890
better than before
Big data analytics can predict users' preferences and
3.99 .886
personalize the item according to it
Ads and offers are more relevant according to
4.05 .884
recommendations
Personalization help in price optimization which help in
3.99 .886
boosting profit margins
Cost Reduction
Big data analytics can help to reduce cost and wasted clicks on
4.01 .933
ads
Through big data, sales, marketing data and accounts can be
4.20 .979
reviewed for optimal cost reduction
Big data presents upselling and cross-selling opportunities 3.80 1.132
There is an approach to target the audience which prevents
3.96 1.004
wasted advertising hence reduce cost
Big data analytics can reduce costs through presenting all the
3.62 1.174
needed info for interested parties
Targeted Advertising
Access to data on consumers preferences, marketers can
3.55 .980
develop more targeted marketing
Targeting can be done through analyzing how people engage
3.80 .923
with the brand
Bid data can help in revealing patterns and trends to make
3.72 .897
advertising more relevant
Through big data analytics, there would be a space for
4.04 .854
engaging more customer with the brand
Through big data analytics, there would be a chance to increase
4.09 .863
marketing channels
Brand Equity
Brands that have better data are stronger and more popular 3.87 .975
Analytical efforts can help in supporting better brand equity 4.01 .886
Gathering all needed information is the key role on defining a
4.09 .876
brand equity
Big data analytics provides significant intangible assets for
3.94 1.025
better equity
Brand equity means better profit margins and spread for the 4.05 .795
7 1528-2686-28-1-134
Citation Information: Hashem, T.N., Homsi, D.M.A. & Sultan Freihat, S.M.S. (2022). Role of big data analytics in increasing brand
equity within pharmaceutical industry. Academy of Entrepreneurship Journal, 28(1), 1-13.Academy of Entrepreneurship Journal Volume 28, Issue 1, 2022
brand itself
Table 4
VARIABLES' DESCRIPTIVE STATISTICS
Mean Std. Deviation
Consumer Acquisition and Retention 3.75 0.793
Personalization 3.93 0.739
Cost Reduction 3.91 0.689
Targeted Advertising 3.84 0.658
Brand Equity 3.99 0.670
Hypotheses Testing
Multiple regression and OLS regression were used in order to test and prove study
hypotheses. Following results indicated that big data analysis plays a role in increasing brand
equity within pharmaceutical industry (Table 5).
H: Big data analytics positively influences brand equity
Table 5
TESTING MAIN HYPOTHESIS
Model R R Square F Sig.
1 0.773a 0.597 32.996 0.000
Coefficient
Standardized
Unstandardized Coefficients
Model Coefficients t Sig.
B Std. Error Beta
(Constant) 0.663 0.296 2.239 0.028
Consumer
Acquisition and 0.180 0.091 .213 1.965 0.053
Retention
1
Personalization -0.017 0.130 -0.018 -0.127 0.899
Cost Reduction 0.260 0.121 0.267 2.150 0.034
Targeted
0.443 0.090 0.435 4.918 0.000
Advertising
Multiple Regression test was used to test above hypothesis, it was found that F value was
significant at 0.05 level, so that we accepted that Big data analytics positively influences brand
equity. Also that r=0.773 reflected high level of relationship between the variables as well as Big
data analytics explain 59.7% of the variance in brand equity (Table 6 and Table 7)
H1: Consumer acquisition and retention positively influences brand equity
Model Summary
Table 6
TESTING 1ST HYPOTHESIS
Model R R Square F Sig.
1 0.622a 0.387 58.146 0.000
Coefficient
Model Unstandardized Coefficients Standardized t Sig.
8 1528-2686-28-1-134
Citation Information: Hashem, T.N., Homsi, D.M.A. & Sultan Freihat, S.M.S. (2022). Role of big data analytics in increasing brand
equity within pharmaceutical industry. Academy of Entrepreneurship Journal, 28(1), 1-13.Academy of Entrepreneurship Journal Volume 28, Issue 1, 2022
Coefficients
B Std. Error Beta
(Constant) 2.016 .265 7.619 .000
Consumer
1
Acquisition .526 .069 .622 7.625 .000
and Retention
OLS Regression test was used to test above hypothesis, it was found that t- value was
significant at 0.05 level, so that we accepted that Consumer acquisition and retention positively
influences brand equity. Also that r=0.662 reflected high level of relationship between the
variables as well as Consumer acquisition and retention explains 38.7% of the variance in brand
equity.
H 2: Personalization positively influences brand equity
Table 7
TESTING 2ND HYPOTHESIS
Model Summary
Model R R Square F Sig.
1 0.648a 0.419 66.443 0.000
Coefficient
Standardized
Unstandardized Coefficients
Model Coefficients t Sig.
B Std. Error Beta
(Constant) 1.682 0.288 5.835 0.000
1
Personalization 0.587 0.072 0.648 8.151 0.000
OLS Regression test was used to test above hypothesis, it was found that t- value was
significant at 0.05 level, so that we accepted that Personalization positively influences brand
equity. Also that r=0.648 reflects high level of relationship between the variables as well as
Personalization explains 41.9% of the variance in brand equity (Table 8).
H3: Cost reduction positively influences brand equity
Table 8
TESTING 3RD HYPOTHESIS
Model Summary
Model R R Square F Sig.
1 0.656a 0.431 69.566 0.000
Coefficient
Standardized
Unstandardized Coefficients
Model Coefficients t Sig.
B Std. Error Beta
(Constant) 1.491 0.304 4.898 0.000
1 Cost
0.638 0.077 0.656 8.341 0.000
Reduction
OLS Regression test was used to test above hypothesis, it was found that t- value was significant
at 0.05 level, so that we accepted that Cost reduction positively influences brand equity. Also
9 1528-2686-28-1-134
Citation Information: Hashem, T.N., Homsi, D.M.A. & Sultan Freihat, S.M.S. (2022). Role of big data analytics in increasing brand
equity within pharmaceutical industry. Academy of Entrepreneurship Journal, 28(1), 1-13.Academy of Entrepreneurship Journal Volume 28, Issue 1, 2022
that r=0.656 reflects high level of relationship between the variables as well as Cost reduction
explains 43.1% of the variance in brand equity (Table 9).
H 4: Targeted advertising positively influences brand equity
Table 9
TESTING 4TH HYPOTHESIS
Model Summary
Model R R Square F Sig.
1 0.693a 0.480 84.947 0.000
Coefficients
Standardized
Unstandardized Coefficients
Model Coefficients t Sig.
B Std. Error Beta
(Constant) 1.283 0.298 4.302 0.000
1 Targeted
0.705 0.077 0.693 9.217 0.000
Advertising
OLS Regression test was used to test above hypothesis, it was found that t- value was
significant at 0.05 level, so that we accepted that Targeted advertising positively influences
brand equity. Also that r=0.693 reflects high level of relationship between the variables as well
as Targeted advertising explains 48% of the variance in brand equity.
DISCUSSION
The current study aimed at examining the influence of big data analysis and its role in
increasing brand equity within pharmaceutical industry in Jordan during the fiscal year 2020-
2021. For that sake, quantitative method was used and a questionnaire was developed and
uploaded online in order to collect primary data. A sample of (94) marketing and sales managers
in pharmaceutical companies and drug stores in Jordan responded to the questionnaire. SPSS v.
23rd was used in order to screen and analyze gathered data; study was able to reach following
findings:
Marketing and sales managers in pharmaceutical companies and drug stores in Jordan seemed to have a
high level of awareness regarding the concept of brand equity and big data analytics as their answers were
positive and reflected reliability of study tool.
The main hypothesis of study was accepted and there appeared that big data analytics positively influences
brand equity with high level of relationship and an explained variance of 59.7%
Variables of big data analytics included (Consumer Acquisition and Retention, Personalization, Cost
Reduction and Targeted Advertising) were tested also as hypotheses. Results indicated that all variables'
influences on brand equity were proved with high level of relationship.
The highest variable in influence which appeared through its variance was targeted advertising which
scored a variance of 48%.
The least influential variable of all was Consumer acquisition and retention which scored a variance
of 38.7% but still managed to have a high level relationship.
Other variables were also influential including (personalization and cost reduction) with a high level
relationship and a variance of 41.9% and 43.1% respectively.
Study was able to prove that big data, its gathering and analytics play a huge role in
defining a more coherent approach to framing the brand equity. This was seen through results in
which the relationship between big data analytics and brand equity scored a variance of 59.7%
10 1528-2686-28-1-134
Citation Information: Hashem, T.N., Homsi, D.M.A. & Sultan Freihat, S.M.S. (2022). Role of big data analytics in increasing brand
equity within pharmaceutical industry. Academy of Entrepreneurship Journal, 28(1), 1-13.Academy of Entrepreneurship Journal Volume 28, Issue 1, 2022
with a high level of relationship. Such results agreed with Wuepper & Patry (2017); Chiang &
Yang (2018) and Anshari et al. (2018) who argued that the use of big data allows companies to
monitor different patterns and trends related to customers. In addition to Cohen (2018) who
stated that monitoring customer behavior is important to motivate loyalty, meaning that, the
more data a business collects the more patterns and trends a business can identify. However,
going deeper into analysis, it was seen that among the chosen variables of big data analytics
(Consumer Acquisition and Retention, Personalization, Cost Reduction and Targeted
Advertising), the variable of targeted advertising appeared to be the most influential on brand
equity achieving a high level of relationship and a variance of 48%. This idea is attributed
to Buhalis & Volchek (2021) who noted to the fact that in the modern business world and the
current age of technology, a business can easily collect all the customer data that an organization
needs. This result means that it is very easy to understand the modern day client. Basically, all
that is necessary is to have a big data analysis strategy in place to maximize the data the
organization has, and with a proper customer data analysis mechanism in place the organization
will have the ability to elicit important behavioral insights that it needs to act upon in order to
retain the customer base and thus improve brand equity which agreed with (Ducange et al.,
2018). Also results agreed with Wang and Wang (2020); Liu et al. (2019) who stated that where
understanding customer insights will allow the organization to be able to deliver what customers
want from it, this is the key step to achieving significant improvement on brand equity.
Generally speaking, by using big data analysis techniques and tools, Wal-Mart was able to
improve search results for its products on the Internet by 10-15%, while according to a report by
McKinsey - a leading business consulting company - that the health sector in the United States, if
it used big data analysis techniques effectively and efficiently, would have been Has generated
more than 300 million US dollars in annual surplus from the health budget, two-thirds of which
is due to a reduction in expenditure costs by 8%.
CONCLUSION
Big data is of high importance, as it provides a high competitive advantage for companies
if they can benefit from and process them because they provide a deeper understanding of their
customers and their requirements, and this helps to take appropriate and appropriate decisions
within the company in a more effective manner, based on information extracted from customer
databases, thus increasing efficiency and profit and reducing losses.
In our time, we are witnessing a huge explosion of data. The analysis and processing of
this data mainly increases the understanding and understanding of customer requirements, thus
increasing efficiency and productivity and reducing losses for companies. However, there are
many challenges and obstacles that hinder the use or expansion of big data, which can be
addressed in another article, God willing. With the passage of time and technological progress,
significant progress is expected in addressing the challenges and constraints of using big data
more widely.
RECOMMENDATION
The study recommends the importance of taking care of the quantities of data that are
received by organizations during marketing campaigns, as this data can be converted into
valuable information if properly arranged and organized. In addition to that, it is necessary to
11 1528-2686-28-1-134
Citation Information: Hashem, T.N., Homsi, D.M.A. & Sultan Freihat, S.M.S. (2022). Role of big data analytics in increasing brand
equity within pharmaceutical industry. Academy of Entrepreneurship Journal, 28(1), 1-13.Academy of Entrepreneurship Journal Volume 28, Issue 1, 2022
adopt a mechanism through which the organization has the ability to distinguish between real
and fake data, in order to avoid wasting time and money on electronic marketing campaigns that
may be directed towards an unreal audience via the Internet.
REFERENCES
Akter, S., & Wamba, S.F. (2016). Big data analytics in E-commerce: A systematic review and agenda for future
research. Electronic Markets, 26(2), 173-194.
Algharabat, R., Rana, N.P., Alalwan, A.A., Baabdullah, A., & Gupta, A. (2020). Investigating the antecedents of
customer brand engagement and consumer-based brand equity in social media. Journal of Retailing and
Consumer Services, 53.
Amado, A., Cortez, P., Rita, P., & Moro, S. (2018). Research trends on big data in marketing: A text mining and
topic modeling based literature analysis. European Research on Management and Business Economics,
24(1), 1-7.
André, Q., Carmon, Z., Wertenbroch, K., Crum, A., Frank, D., Goldstein, W., & Yang, H. (2018). Consumer choice
and autonomy in the age of artificial intelligence and big data. Customer Needs and Solutions, 5(1), 28-37.
Buhalis, D., & Volchek, K. (2021). Bridging marketing theory and big data analytics: The taxonomy of marketing
attribution. International Journal of Information Management, 56, 102253.
Buhalis, D., & Volchek, K. (2021). Bridging marketing theory and big data analytics: The taxonomy of marketing
attribution. International Journal of Information Management, 56, 102253.
Chiang, L.L.L., & Yang, C.S. (2018). Does country-of-origin brand personality generate retail customer lifetime
value? A Big Data analytics approach. Technological Forecasting and Social Change, 130, 177-187.
Chong, A. Y. L., Ch’ng, E., Liu, M.J., & Li, B. (2017). Predicting consumer product demands via Big Data: the
roles of online promotional marketing and online reviews. International Journal of Production Research,
55(17), 5142-5156.
Ćurko, K., Silović, T., & Merkaš, Z. (2018). Challenges of application of the big data in marketing: case study
croatia. WSEAS Transactions on Business and Economics, 15, 162-170.
De Luca, L.M., Herhausen, D., Troilo, G., & Rossi, A. (2020). How and when do big data investments pay off? The
role of marketing affordances and service innovation. Journal of the Academy of Marketing Science, 1-21.
Delanoy, N., & Kasztelnik, K. (2020). Business open big data analytics to support innovative leadership and
management decision in Canada. Business Ethics and Leadership, 4(2), 56-74.
Ducange, P., Pecori, R., & Mezzina, P. (2018). A glimpse on big data analytics in the framework of marketing
strategies. Soft Computing, 22(1), 325-342.
Ebrahim, R. S. (2020). The role of trust in understanding the impact of social media marketing on brand equity and
brand loyalty. Journal of Relationship Marketing, 19(4), 287-308.
Foroudi, P., Jin, Z., Gupta, S., Foroudi, M. M., & Kitchen, P. J. (2018). Perceptional components of brand equity:
Configuring the Symmetrical and Asymmetrical Paths to brand loyalty and brand purchase intention.
Journal of Business Research, 89, 462-474.
Gordon, J., Perrey, J., & Spillecke, D. (2013). Big data, analytics and the future of marketing and sales. McKinsey:
Digital Advantage.
Hashem, T. (2021). Environmental legitimacy through adopting green products and its effect on the brand equity:
Moderating role of management awareness. Research in World Economy, 12(2), 197-210.
Holmlund, M., Van Vaerenbergh, Y., Ciuchita, R., Ravald, A., Sarantopoulos, P., Ordenes, F.V., & Zaki, M.
(2020). Customer experience management in the age of big data analytics: A strategic framework. Journal
of Business Research, 116, 356-365.
Kauffmann, E., Peral, J., Gil, D., Ferrández, A., Sellers, R., & Mora, H. (2020). A framework for big data analytics
in commercial social networks: A case study on sentiment analysis and fake review detection for marketing
decision-making. Industrial Marketing Management, 90, 523-537.
Keller, K.L., & Brexendorf, T.O. (2019). Measuring brand equity. Handbuch Markenführung, 1409-1439.
Lim, J.S., Pham, P., & Heinrichs, J.H. (2020). Impact of social media activity outcomes on brand equity. Journal of
Product & Brand Management.
Liu, C.H. (2020). Integration of different perspectives of culinary brand equity. Journal of Hospitality and Tourism
Management, 45, 152-161.
12 1528-2686-28-1-134
Citation Information: Hashem, T.N., Homsi, D.M.A. & Sultan Freihat, S.M.S. (2022). Role of big data analytics in increasing brand
equity within pharmaceutical industry. Academy of Entrepreneurship Journal, 28(1), 1-13.Academy of Entrepreneurship Journal Volume 28, Issue 1, 2022
Liu, X., Shin, H., & Burns, A. C. (2019). Examining the impact of luxury brand's social media marketing on
customer engagement: Using big data analytics and natural language processing. Journal of Business
Research.
Marques, C., da Silva, R.V., Davcik, N.S., & Faria, R.T. (2020). The role of brand equity in a new rebranding
strategy of a private label brand. Journal of Business Research, 117, 497-507.
Matz, S.C., & Netzer, O. (2017). Using big data as a window into consumers psychology. Current Opinion in
Behavioral Sciences, 18, 7-12.
Montgomery, K., Chester, J., Nixon, L., Levy, L., & Dorfman, L. (2019). Big Data and the transformation of food
and beverage marketing: undermining efforts to reduce obesity? Critical Public Health, 29(1), 110-117.
Mourad, M., Meshreki, H., & Sarofim, S. (2020). Brand equity in higher education: comparative analysis. Studies in
Higher Education, 45(1), 209-231.
Nair, H.S., Misra, S., Hornbuckle IV, W.J., Mishra, R., & Acharya, A. (2017). Big data and marketing analytics in
gaming: Combining empirical models and field experimentation. Marketing Science, 36(5), 699-725.
Seo, E.J., & Park, J.W. (2018). A study on the effects of social media marketing activities on brand equity and
customer response in the airline industry. Journal of Air Transport Management, 66, 36-41.
Singh, A., Ranjan, J., & Mittal, M. (2018). Big data and behavior analytics in marketing. In Handbook of E-
Business Security (pp. 225-242). Auerbach Publications.
Wang, W.Y.C., & Wang, Y. (2020). Analytics in the era of big data: the digital transformations and value creation in
industrial marketing.
Wright, L.T., Robin, R., Stone, M., & Aravopoulou, D.E. (2019). Adoption of big data technology for innovation in
B2B marketing. Journal of Business-to-Business Marketing, 26(3-4), 281-293.
Zollo, L., Filieri, R., Rialti, R., & Yoon, S. (2020). Unpacking the relationship between social media marketing and
brand equity: The mediating role of consumers’ benefits and experience. Journal of Business Research,
117, 256-267.
13 1528-2686-28-1-134
Citation Information: Hashem, T.N., Homsi, D.M.A. & Sultan Freihat, S.M.S. (2022). Role of big data analytics in increasing brand
equity within pharmaceutical industry. Academy of Entrepreneurship Journal, 28(1), 1-13.You can also read