RUHR ECONOMIC PAPERS - Encouraging Parents to Invest: A Randomized Trial with two Simple Interventions in Early Childhood - RWI Essen
←
→
Page content transcription
If your browser does not render page correctly, please read the page content below
RUHR
                                             ECONOMIC PAPERS

        Cara Ebert
Esther Heesemann
 Sebastian Vollmer

                     Encouraging Parents to Invest:
                     A Randomized Trial with two Simple
                     Interventions in Early Childhood

                                                          #856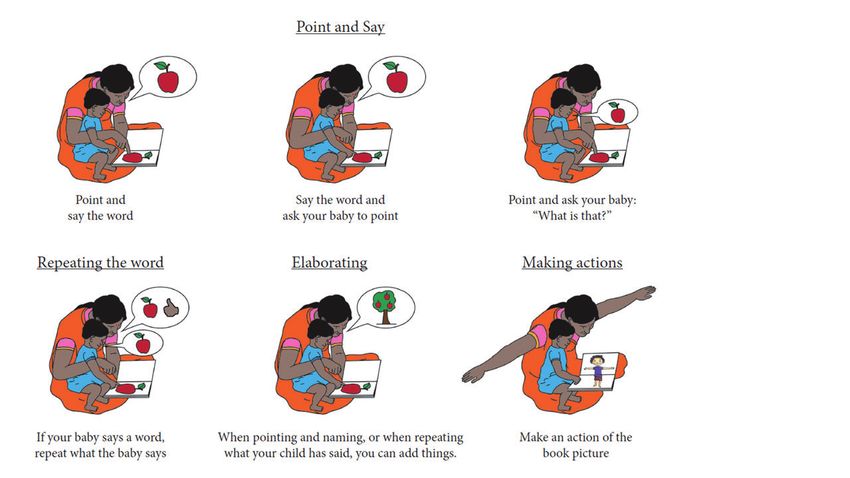
Imprint

Ruhr Economic Papers
Published by
RWI – Leibniz-Institut für Wirtschaftsforschung
Hohenzollernstr. 1-3, 45128 Essen, Germany
Ruhr-Universität Bochum (RUB), Department of Economics
Universitätsstr. 150, 44801 Bochum, Germany
Technische Universität Dortmund, Department of Economic and Social Sciences
Vogelpothsweg 87, 44227 Dortmund, Germany
Universität Duisburg-Essen, Department of Economics
Universitätsstr. 12, 45117 Essen, Germany

Editors
Prof. Dr. Thomas K. Bauer
RUB, Department of Economics, Empirical Economics
Phone: +49 (0) 234/3 22 83 41, e-mail: thomas.bauer@rub.de
Prof. Dr. Wolfgang Leininger
Technische Universität Dortmund, Department of Economic and Social Sciences
Economics – Microeconomics
Phone: +49 (0) 231/7 55-3297, e-mail: W.Leininger@tu-dortmund.de
Prof. Dr. Volker Clausen
University of Duisburg-Essen, Department of Economics
International Economics
Phone: +49 (0) 201/1 83-3655, e-mail: vclausen@vwl.uni-due.de
Prof. Dr. Ronald Bachmann, Prof. Dr. Roland Döhrn, Prof. Dr. Manuel Frondel,
Prof. Dr. Ansgar Wübker
RWI, Phone: +49 (0) 201/81 49 -213, e-mail: presse@rwi-essen.de

Editorial Office
Sabine Weiler
RWI, Phone: +49 (0) 201/81 49-213, e-mail: sabine.weiler@rwi-essen.de

Ruhr Economic Papers #856
Responsible Editor: Ronald Bachmann
All rights reserved. Essen, Germany, 2020
ISSN 1864-4872 (online) – ISBN 978-3-86788-992-6

The working papers published in the series constitute work in progress circulated to stimulate
discussion and critical comments. Views expressed represent exclusively the authors’ own opinions
and do not necessarily reflect those of the editors.
Ruhr Economic Papers #856
     Cara Ebert, Esther Heesemann, and Sebastian Vollmer

      Encouraging Parents to Invest:
A Randomized Trial with two Simple
    Interventions in Early Childhood
Bibliografische Informationen der Deutschen Nationalbibliothek The Deutsche Nationalbibliothek lists this publication in the Deutsche Nationalbibliografie; detailed bibliographic data are available on the Internet at http://dnb.dnb.de RWI is funded by the Federal Government and the federal state of North Rhine-Westphalia. http://dx.doi.org/10.4419/86788992 ISSN 1864-4872 (online) ISBN 978-3-86788-992-6
Cara Ebert, Esther Heesemann, and Sebastian Vollmer1

Encouraging Parents to Invest:
A Randomized Trial with two Simple
Interventions in Early Childhood

Abstract
The lottery of birth draws some children into deprived environments and others into environments
where they thrive. In a field experiment in rural India with 10-20 months old children we test two scalable
interventions to reduce early disadvantages in health and mental development. We distribute a durable
device for home iron fortification of meals, called the Lucky Iron Leaf, and picture books together with a
training for caregivers in dialogic reading. We find no significant average impact of either intervention on
anemia or mental development. However, we find a cross-productivity of children’s baseline health and
the interventions’ effectiveness. Children, who are non-anemic at baseline, improve in receptive language
skills by half a standard deviation one year after implementation.

JEL-Code: D04, I12, I15, J13

Keywords: Early childhood; parental investment; nutrition; health behavior; human capital

December 2020

1 Cara Ebert, RWI; Esther Heesemann, University of Mannheim; Sebastian Vollmer, University of Göttingen. – We are grateful
to Alastair Summerlee for the collaboration in the design of the Lucky Iron Leaf, its laboratory testing, and the provision of 1000 Lucky
Iron Leafs by the Lucky Iron Fish Enterprise. Peter Cooper and the Mikhulu Child Development Trust generously provided and adapted
their dialogic reading program for this project. We thank Claudia Maehler, Marika Kisters, and Nadine Storch for adapting FREDI
0-3 to the Bihari context. We are grateful to Maximilian Sprengholz for the design of dialogic reading handouts. We are grateful for
the support of Malavika Subramanyam and allowing us to connect to her ongoing field work. At last, we want to thank Abhijeet
Kumar for field work coordination and his dedication to the project. Source of funding: The primary data collection and intervention
implementation was funded by (i) State Ministry of Science and Culture, State of Lower Saxony, Germany (grant VWZN3060) and
(ii) the DFG German Research Foundation (RTG1723: Globalization and Development and RTG 1666: Transformation of Global Agri-
Food Systems). The trial is registered at the American Economic Association Registry www.socialscienceregistry.org/trials/2696.
- All correspondence to: Cara Ebert, RWI - Büro Berlin, Invalidenstr. 112, 10115 Berlin, Germany,
e-mail: cara.ebert@rwi-essen.de
I    I NTRODUCTION
The first 1000 days of life mark a critical period of human development. In those early years,
the young brain forms millions of synapses to a dense network for the transmission and storage
of information, and prunes network connections that are not used. The brain’s plasticity during
this phase, however, also implies its vulnerability to adverse environments. Children living in
poverty face a multitude of circumstances, such as poor health and mental stimulation, which
can impair skill formation (Walker et al., 2007, 2011b). Early disadvantages can affect children
over a lifetime as the skill accumulation process is of dynamic and path-dependent nature (Cunha
et al., 2006; Cunha and Heckman, 2007; Heckman, 2007; Cunha and Heckman, 2008; Cunha,
Heckman and Schennach, 2010; Attanasio, 2015; Attanasio et al., 2020a,b; Attanasio, Meghir
and Nix, 2020). Early skills and health as well as parental investment matter interdependently in
reinforcing and complementing ways for human capital outcomes later in life. In consequence,
health and mental development follow a steep socioeconomic gradient which widens with age
(Taylor, Dearing and McCartney, 2004; Fernald et al., 2012; Hamadani et al., 2014; Rubio-Codina
et al., 2015; Schady et al., 2015; Reynolds et al., 2017). The economic potential lost to reduced skill
formation is substantial.1 Hanushek and Woessmann (2012a) estimate that one standard deviation
higher cognitive skills is associated with two percentage points higher annual national economic
growth.
    Early childhood development programs are salient policy interventions to avoid early disadvan-
tages and their far-reaching consequences. Nutrition and stimulation interventions have shown to
affect adult cognitive and psychosocial skills, test scores, educational attainment, earnings, crime,
and even children’s health and skills in the next generation (Alderman et al., 2001; Glewwe, Jacoby
and King, 2001; Walker et al., 2005; Hoddinott et al., 2008; Behrman et al., 2009; Maluccio et al.,
2009; Walker et al., 2011a; Hazarika and Viren, 2013; Behrman et al., 2014; Gertler et al., 2014;
Walker et al., 2015; Thompson, 2018; Lazuka, 2020). An often-replicated two-year weekly stimu-
lation program with one-year old children in Jamaica increased children’s earnings by 25 percent
20 years later (Grantham-McGregor et al., 1991; Walker et al., 1991; Gertler et al., 2014).
    Our study adds to an emerging literature investigating how to effectively put early childhood
development interventions to scale. Previous studies have focused on integrating programs into
existing infrastructure using, for example, community health workers and effectively improved
children’s mental development (Attanasio et al., 2014; Yousafzai et al., 2014, 2016; Attanasio et al.,
2018; Andrew et al., 2020; Sylvia et al., 2020). However, in many places where early childhood
interventions are needed, public infrastructure is dysfunctional. For example, Sylvia et al. (2020)
   1 Forexamples on economic outcomes see Lee and Lee (1995), Hanushek and Kimko (2000), Denny, Harmon and
O’Sullivan (2004), Heckman, Stixrud and Urzua (2006), Hanushek and Woessmann (2008), Hanushek and Woess-
mann (2012b), Hanushek (2013), and Atherton, Appleton and Bleaney (2013).

                                                    2
point out challenges in the supply-side compliance of a parenting program that uses existing public
infrastructure in China. In rural Bihar (India), where this study is set, spot-checks at mother-
child centers (Anganwadi centers) revealed that the centers are often overburdened and unreliable.2
Therefore, we propose an alternative program design which may be suitable in contexts where
service delivery via public infrastructure is not an option. Our approach intends to empower parents
to improve nutrition and stimulation of their children with inexpensive and long lasting means.
We study two interventions that are remarkably simple in comparison to existing effective
early skill development programs, such as the Jamaica-program which had subsequently been im-
plemented, for example, in Bangladesh, China, Colombia, India and Pakistan (Hamadani et al.,
2006; Tofail et al., 2013; Attanasio et al., 2014; Yousafzai et al., 2014; Andrew et al., 2020; At-
tanasio et al., 2020b; Grantham-McGregor et al., 2020; Sylvia et al., 2020). Our first intervention
targets iron deficiency as a risk factor of skill development. In one home visit, we distribute an iron
cooking utensil, called Lucky Iron LeafTM (hereafter Lucky Iron Leaf), for home iron fortification.
The Lucky Iron Leaf leaches iron when placed in boiling water with some fruit acid and the en-
riched water then fortifies rice, lentils or alike during regular cooking. The intervention is simple
in the delivery to households because the Lucky Iron Leaf is a durable source of iron, lasting for
up to five years, and does not require replenishment as conventional fortification technologies do
(e.g., multi-micronutrient powder). The second intervention targets the lack of psychosocial stim-
ulation as a risk factor of skill development. During four home visits caregivers learn methods of
dialogic reading, which is an interactive mode of sharing picture books to stimulate speaking and
learning, and receive three durable picture books. In addition, we nudge the regular exercise of
dialogic reading using book sharing calendars as reminders in a random subset of dialogic reading
intervention households.
The study follows a factorial design, in which we assigned 1,480 households with 10- to 20-
months old children to one of four main experimental arms: one stand-alone Lucky Iron Leaf
arm, one stand-alone dialogic reading arm, one combined interventions arm, which receives the
Lucky Iron Leaf and dialogic reading treatment, and one no-intervention control arm. Among
dialogic reading households we further cross-randomized the book sharing calendar. The factorial
design allows us to capture potential interactions of the nutrition and psychosocial stimulation
interventions that potentially stem from iron replenished children’s improved mental capacity and
enhanced learning potential during book sharing (Lozoff, 2007; Beard, 2008).
The study location is the rural district Madhepura in the northeast Indian state of Bihar. Chronic
malnutrition and anemia are common in Madhepura and public child care services for under-three-
2 During most spontaneous visits, Anganwadi workers and children were absent at arrival. Many Anganwadi work-
ers complained about not receiving the funds they are entitled to. Similarly, Fraker, Shah and Abraham (2013) report
about Anganwadi centers in Bihar: 23% of the centers were closed during opening hours, 59% provided meals to the
children, only 53% of children attended the centers when meals were provided.
3year olds do not exist (International Institute for Population Sciences, 2017).
One year after implementation, we find no impact of the Lucky Iron Leaf intervention, the
dialogic reading intervention (with or without calendar) or the combination of both on cognitive,
language, motor or socioemotional functions on average. However, we find cross-productivities
of the interventions and children’s health status at the beginning of the trial. Non-anemic children
at baseline, who make up 30 percent of the sample, benefited from the combined intervention in
receptive language skills by 0.54 standard deviations. Given the simplicity of our interventions,
the effect size for non-anemic children is considerable. For example, an intensive 24 months
weekly stimulation intervention in Colombia, following the Jamaica-program, improved receptive
language and cognition by 0.22 and 0.26 standard deviations, respectively, in a study context where
the anemia rate is about 19 percent (Attanasio et al., 2014).
The paper is organized as follows. Section II describes the interventions, section III the re-
search design and data, and section IV the estimation strategy. Section V presents estimates of
the program impact on children’s development and anemia as well as effect heterogeneities. Sec-
tion VI presents intervention take-up rates, treatment effects under consideration of spillovers and
complier average causal effects. Section VII examines the interventions’ impact on other domains
of caregiving. Section VIII discusses contextual challenges for intervention take-up. Section IX
concludes.
II T HE INTERVENTIONS
II.A Background
The study is located in the district of Madhepura in Bihar, India. Bihar is the third largest state of
India and has the lowest GDP per capita. Of Bihar’s 104 million inhabitants, 88 percent reside in
rural areas (Census of India, 2011). Madhepura district comprises about 2 million inhabitants and
is almost entirely rural, with few exceptions such as its capital, also named Madhepura.
Chronic and acute malnutrition are common in Madhepura. About half of the children under
the age of five are stunted and/or underweight, and 61 percent are anemic (International Institute
for Population Sciences, 2017). As part of the Government’s 2013 National Iron+ Initiative, com-
munity health workers are tasked to monitor the administration of iron syrup in every household
with young children, adolescent girls and women in reproductive age in weekly to biweekly home
visits. In addition, children are entitled to receive iron supplements free of charge from public
health providers, such as health centers and hospitals. Yet, the outreach of the public distribution
system is limited (Kapil and Bhadoria, 2014). In 2015/16, only 22 percent of children under the
age of five consumed any iron supplements in the seven days prior to the interview (International
4Institute for Population Sciences and ICF, 2017).
No public programs for psychosocial stimulation of under three-year old children exist in rural
Bihar. The day care of the Integrated Child Development Services (ICDS) in Anganwadi centers
exclusively addresses children from three years onwards.3 For children under the age of three
the ICDS targets solely health aspects - i.e. macro-nutrient food rations, vaccinations, and health
check-ups.
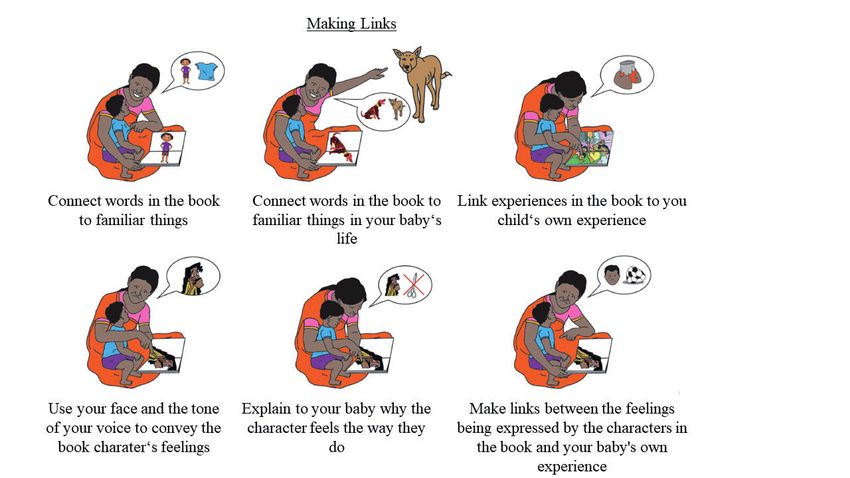
II.B Dialogic reading
Dialogic reading is a method of sharing picture books with children. It is solely based on having
a conversation about images in the book and does not require caregivers to be literate. Dialogic
reading techniques emphasize strategic questioning and feedback in order to encourage children
to think, speak and learn. In contrast to children listening passively to readings, they become
story tellers themselves based on images in the book and assisted by the caregiver’s questions and
encouragements.
The effectiveness of dialogic reading is well studied in high-income countries.4 Evidence from
low- and middle-income countries includes four small-scale, closely controlled trials in Mexico,
Bangladesh, and South Africa (Valdez-Menchaca and Whitehurst, 1992; Opel, Ameer and Aboud,
2009; Cooper et al., 2014; Vally et al., 2015; Murray et al., 2016). After a four to eight week
program with weekly meetings, children improved in receptive and expressive language, attention
and socioemotional behavior. To our knowledge, this is the first trial which evaluates the impact
of dialogic reading for implementation at large scale, in the Indian context and in a high anemia
prevalence population (70%).
The training program of the dialogic reading intervention of this trial was developed by the
Mikhulu Child Development Trust (Mikhulu) and is a shorter version of the eight-week caregiver
training program tested in South Africa (Cooper et al., 2014; Vally et al., 2015; Murray et al., 2016).
During four home-visits of 45 to 60 minutes, female facilitators, trained by Mikhulu, taught and
practiced methods of dialogic reading with the primary caregiver and the child. During each of the
first three visits, a picture book was left with the families, resulting in a variety of three books in
total to exercise book sharing throughout the year. The first two dialogic reading training sessions
were delivered immediately after baseline data collection and one week apart from each other.
3 Even at the older age group of three to five year-olds take-up is far from universal with only a third of the age-
eligible children in Bihar having ever attended the preschool programs over the course of 12 months (International
Institute for Population Sciences and ICF, 2017).
4 For book sharing of caregivers with toddlers (up to three years) see (Whitehurst et al., 1988; Arnold et al., 1994;
Huebner, 2000); in care institutions with pre-school children (aged three to six years) see (Whitehurst et al., 1994;
Bus, van IJzendoorn and Pellegrini, 1995; Dale et al., 1996; Lonigan and Whitehurst, 1998; Hargrave and Sénéchal,
2000; Lever and Sénéchal, 2011).
5Sessions three and four were delivered three months later, again one week apart from each other.
Appendix IX details further aspects of the intervention.
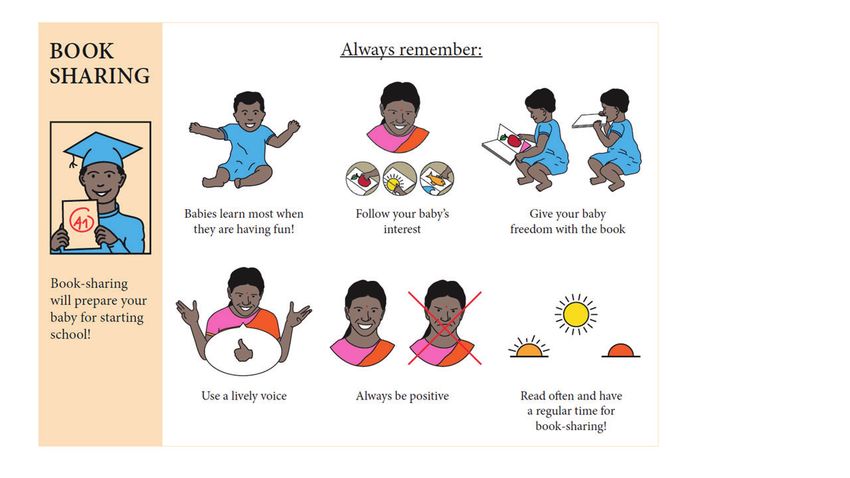
In the study population, picture book sharing was essentially not practiced at baseline and the
increase in book sharing at the extensive margin is one of the basic aims in order to improve chil-
dren’s skill development (Fletcher and Reese, 2005). In particular, we expect benefits to emerge
from increasing responsive parent-child interactions (Landry, Smith and Swank, 2006) and by ex-
posing children to more spoken words (Weisleder and Fernald, 2013). To achieve optimal learning
outcomes, children’s interest in sharing picture books is key for them to engage with caregivers
and books attentively (Fletcher and Reese, 2005; Ortiz, Stowe and Arnold, 2001).
To encourage regular and continued book sharing, a random subset of households also received
a dialogic reading calendar during the third home visit. On the calendar, caregivers could mark
with colorful stickers each day in which books were shared. The calendar is intended to serve
as a reminder and was inspired by the medical literature, in which calendar boxes or blisters are
commonly used to improve adherence with medication (Zedler et al., 2011). The calendar was
structured by the lunar months and included colorful graphics that indicate national holidays and
festivities. The design was targeted to an illiterate population and it consisted of robust material to
last throughout the intervention period (and beyond).
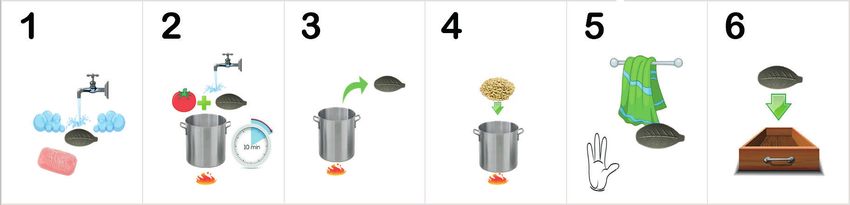
II.C The Lucky Iron LeafTM
The second intervention consists of the distribution of Lucky Iron Leafs. The Lucky Iron Leaf is
a 7-cm long leaf shaped iron ingot made from electrolytic iron. When placed in a cooking vessel
with boiling water together with some fruit acid – such as some drops of lemon juice or half a
tomato – it leaches iron into the water. After 10 minutes of boiling, the Lucky Iron Leaf can be
removed from the water and regular food is added which will in turn be fortified while cooking it
in the iron enriched water.5 The Lucky Iron Leaf can be used for daily cooking for five years at
a NGO-sales price below USD 10. In contrast to supplements or multi-micronutrient powder, it
does not require any replenishment. This makes it an easy-to-deliver and remarkably sustainable
nutrition intervention. This is the first study to rigorously test the effectiveness of the fortification
technology in reducing the prevalence of anemia among children and in a large-scale intention-to-
treat design.
The Lucky Iron Leaf is the Indian alternative to the Lucky Iron FishTM , a fish shaped iron
ingot, which effectively reduced anemia among Cambodian women (Charles et al., 2011, 2015).6
5 The safety of using such an iron ingot for cooking is documented by Armstrong, Dewey and Summerlee (2017).
6 The leaf shape of the ingot was the result of focus group discussions we conducted in the study area prior to the
baseline survey. The Lucky Iron Leaf and the Lucky Iron FishTM are otherwise of similar size and weight. They also
do not differ meaningfully in their fortification ability. The Lucky Iron Leaf was produced by the Lucky Iron FishTM
6We altered the shape of the iron ingot to increase its acceptance in the Indian context. The Lucky
Iron Leaf resembles a leaf of the tulsi tree which is a holy plant in Hinduism and commonly
used for herbal tea against cough and colds. Male facilitators distributed the Lucky Iron Leaf to
participants at no cost and provided instructions on its use during one home visit. The roll-out of
the Lucky Iron Leaf closely followed the Lucky Iron FishTM implementation schedule of the trials
in Cambodia (see appendix IX for further intervention details).
The iron ingot is a low dose fortification tool and, therefore, overdosing with the Lucky Iron
Leaf is unlikely. Prior laboratory tests conducted at the University of Guelp showed that the Lucky
Iron Leaf enriches one serving of the typical lentils-based dish daal by 4.25-5 mg of bioavailable
iron. At baseline, caregivers reported that children eat on average 2.6 times per day about half of
an adult-equivalent portion. We therefore expect children to consume in the ideal case 5.5-6.5 mg
of supplementary iron per day. The WHO recommends 10-12.5 mg elemental iron for under two-
year olds and 30 mg for two- to five-years olds for three consecutive months in high risk regions
such as Bihar (World Health Organization, 2016).
We expect the Lucky Iron Leaf intervention to improve skill development through a reduction
of iron deficiency and iron deficiency anemia. Iron deficiency can directly influence the neurode-
velopment of children because iron is needed for myelination (white mass production) and the
dopamine metabolism (Lozoff, 2007; Beard, 2008; Lozoff, 2011). Myelin insulates the axons
(which transmit information to different neurons, muscles and glands) and, thereby, increases the
speed of information transmission and processing in the brain. Dopamine is a neurotransmitter
which regulates the award thriving behavior and is, therefore, closely linked to motivation and
learning (Flagel et al., 2011; Wise, 2004). Iron deficient children are also less attentive and more
fearful than their peers and, hence, interact less with their environment, which can further inhibit
learning and mental development (Lozoff et al., 1998). These biological and behavioral mecha-
nisms put iron deficient children at risk of poorer cognitive, language, motor and socioemotional
development (Lozoff, 2007; Beard, 2008).
A positive side effect of the Lucky Iron Leaf intervention might be general awareness raising
of caregivers for child nutrition and anemia, which positively impacts complementary feeding
practices (Dewey and Adu-Afarwuah, 2008).
Enterprise for the purpose of this study. For more information, see https://luckyironfish.com.
7III E XPERIMENTAL DESIGN AND DATA
III.A Sample selection
Sampling and randomization
The study population is recruited from a listing of 1,995 households with pregnant women from
2015. In 2016, these women had children in our target age group of 10 to 20 months. The listing
was gathered from rural Anganwadi center registers in 140 villages.7 Sixty-eight gram panchayats,
which comprise 180 villages, were randomly sampled from a total of 95 gram panchayats in six of
Madhepura’s thirteen blocks (sub-districts). Because in some villages the lists of pregnant women
were not made available, the number of gram panchayats and villages reduced to 56 and 140,
respectively. The number of households sampled per village ranges from 5 to 49.
We randomly assigned the 1,995 households to one of four treatment arms: (i) a dialogic read-
ing group (N = 498), (ii) a Lucky Iron Leaf group (N = 499), (iii) a dialogic reading and Lucky
Iron Leaf group (N = 499), and (iv) a no-intervention control group (N = 499). The factorial design
allows us to capture potential interactions of the nutrition and psychosocial stimulation interven-
tions. We expect an increase in iron intake through the use of the Lucky Iron Leaf to improve
children’s brain growth and, thus, mental development (Lozoff, 2007; Beard, 2008). Addition-
ally, children’s concentration and participatory capacities to actively engage in book sharing may
be improved, resulting in enhanced learning outcomes from dialogic reading (Flagel et al., 2001;
Wise, 2004;Lozoff2007;ortiz). As a result, treatment effects of the combined intervention may be
a multiplicative product of both interventions, rather than the sum of each stand-alone intervention.
Randomization was conducted prior to the baseline survey because the intervention implemen-
tation was conducted subsequent to the survey. After the baseline survey and the first household
visits, treatment groups (i) and (iii) were further randomized into a calendar (N = 499) and no-
calendar group (N = 498). The randomization was stratified by caregiver attendance of dialogic
reading training sessions 1 and 2.
Figure 1 describes the timeline of events. The baseline survey, the Lucky Iron Leaf distribution
and the first two dialogic reading sessions began in November 2016 and lasted for eight weeks.
Dialogic reading sessions three and four were implemented in February and March 2017. The
calendars were distributed during the third dialogic reading session. We collected endline data
exactly one year after the baseline survey in December 2017.
The experimental design and outcome indicators are registered at the American Economic As-
sociation’s registry for randomized controlled trials (www.socialscienceregistry.org/trials/2696).
7 In 2015/16, 75 percent of all pregnant women in Madhepura had registered their pregnancies (International Insti-
tute for Population Sciences, 2017).
8Figure 1: Timeline of data collections and intervention implementation
However, no pre-analysis plan, detailing the estimation strategy or heterogeneous treatment effect
analyses, was included. Therefore, this paper thoroughly discusses the robustness of results to
alternative estimation strategies or result interpretations.
Attrition
In 2015, prior to our study, 1,995 households with pregnant women had been sampled. One and a
half years later, in 2016, 80 percent of formerly pregnant women could be reached for our baseline
data collection. The main reason for dropout before baseline was the incorrect documentation
of women’s permanent household location, resulting from the tradition of women moving to their
parental home for pregnancy and child birth. Further households dropped out of the sample because
not all conceived children had survived until baseline data collection in 2016.8 The baseline sample
of households with alive children thus totaled 1,483 (74% of pre-baseline sample). Because the
reduction in sample size occurred prior to the intervention roll-out, biases from selective attrition
at this stage are unlikely.
The final estimation sample consists of 1,164 households, corresponding to 78.5 percent of
baseline households.9 The main reasons for attrition between baseline and endline are the absence
of households or children at the time of data collection (N=152) and incomplete child development
tests (N=83). Additional but less common causes of attrition are migration of households across
village borders, incorrect household identification information and child death. Ten households
refused their participation.
To check for selective attrition from baseline to endline as well as from pre-baseline to endline,
we regress an indicator for attrition on the three treatment group indicators. The coefficients are
small and none of them approaches statistical significance (appendix Table A.II.1). Further, the
baseline balance in the estimation sample is similar to the baseline balance in a sample which is
not restricted to whether we observe endline outcomes (see appendix A.II.2).
8 The magnitude of child deaths is comparable to the state-wide statistics. The infant mortality rate in rural Bihar
is 50 per 1,000 life birth and only 92 percent of all pregnancies lead to live birth in Bihar (Kochar et al., 2014;
International Institute for Population Sciences and ICF, 2017).
9 We define the estimation sample as number of observations with at least one non-missing child development score.
9III.B Data
Outcome indicators
We use the early childhood development test FREDI 0-3 to measure children’s skills and behavior
(Mähler, Cartschau and Rohleder, 2016; Macha and Petermann, 2017). FREDI 0-3 tests cogni-
tive, language, motor, and socioemotional development. It includes playful tasks administered
to the child and interview questions posed to the caregiver. FREDI 0-3 was normed to German
children and its language items were validated to the tests ELAN-R and SETK-2 (Kiese-Himmel,
2013, 2014). The test was adapted to the Bihari context by the same psychologists who developed
the original test. The adapted test comprises around 40 items and we administered different test
versions for children younger or older than 15 months at baseline or 27 months at endline. We
standardize scores of cognitive, receptive language, expressive language, motor and psychosocial
skills relative to the experimental control group and with respect to test year, age group, a linear
age in months trend and a heteroskedastic residual variance.
Iron deficiency is proxied by hemoglobin (Hb) levels and the presence of anemia.10 We used
HemoCue 301® machines to determine the Hb concentration from capillary blood samples at the
point of care and informed all patients about the results directly after testing. Anemia cut-offs fol-
low WHO recommendations, according to which 6-59 months old children are classified as anemic
if HbTable I: Baseline balance across treatment arms in the estimation sample
Control Dialogic reading Lucky Iron Leaf Lucky Iron Leaf & Books
Mean Mean Std. Diff. Mean Std. Diff. Mean Std. Diff.
N N N N
SD SD p-value SD p-value SD p-value
Household characteristics:
Household size 5.69 283 5.77 -0.04 299 5.75 -0.03 294 5.75 -0.03 285
2.01 2.30 0.63 2.26 0.71 2.34 0.72
Hindu 0.87 283 0.82 0.13 300 0.85 0.05 295 0.86 0.02 286
0.34 0.38 0.13 0.36 0.52 0.34 0.84
Caste category:
Scheduled caste 0.30 282 0.30 -0.01 300 0.31 -0.02 295 0.28 0.04 285
0.46 0.46 0.89 0.46 0.85 0.45 0.65
Scheduled tribe 0.04 282 0.04 -0.01 300 0.02 0.09 295 0.04 -0.02 285
0.19 0.20 0.95 0.15 0.29 0.20 0.85
Other backward class 0.59 282 0.58 0.02 300 0.58 0.02 295 0.61 -0.04 285
0.49 0.49 0.77 0.49 0.82 0.49 0.66
General category 0.07 282 0.08 -0.02 300 0.09 -0.06 295 0.07 0.02 285
0.26 0.27 0.79 0.28 0.45 0.25 0.84
Highest education in HH:
No schooling 0.43 283 0.49 -0.10 300 0.47 -0.08 295 0.40 0.07 286
0.50 0.50 0.21 0.50 0.34 0.49 0.38
Primary 0.19 283 0.15 0.11 300 0.16 0.07 295 0.17 0.05 286
0.39 0.35 0.19 0.37 0.38 0.37 0.54
Middle school 0.13 283 0.13 0.00 300 0.15 -0.04 295 0.17 -0.11 286
0.34 0.34 0.98 0.35 0.60 0.38 0.18
≥ High school 0.25 283 0.24 0.02 300 0.22 0.06 295 0.26 -0.03 286
0.43 0.43 0.76 0.42 0.44 0.44 0.68
Asset quintilea 5.31 282 5.41 -0.04 300 5.01 0.10 293 5.23 0.03 285
2.88 2.90 0.66 2.88 0.22 2.94 0.75
Housing quintileb 3.76 283 3.70 0.02 300 3.48 0.10 295 3.62 0.05 286
2.77 2.73 0.79 2.75 0.23 2.82 0.55
Mother characteristics:
Age in years 24.99 283 24.75 0.06 300 24.56 0.11 295 25.07 -0.02 286
3.98 4.15 0.48 3.74 0.18 4.03 0.80
Completed education:
No schooling 0.74 283 0.76 -0.06 300 0.84 -0.26 295 0.73 0.01 286
0.44 0.43 0.49 0.36 0.00 0.44 0.91
Primary 0.09 283 0.05 0.16 300 0.03 0.24 295 0.07 0.09 286
0.29 0.22 0.05 0.18 0.00 0.25 0.26
Middle school 0.05 283 0.08 -0.10 300 0.04 0.08 295 0.10 -0.19 286
0.22 0.27 0.25 0.19 0.36 0.31 0.02
High school or higher 0.12 283 0.11 0.02 300 0.08 0.11 295 0.09 0.07 286
0.32 0.31 0.80 0.28 0.20 0.29 0.39
Can read SMS 0.27 283 0.28 -0.03 300 0.18 0.20 295 0.28 -0.03 286
0.44 0.45 0.75 0.39 0.02 0.45 0.69
Worked past 12 months 0.91 283 0.89 0.06 300 0.91 -0.00 295 0.91 0.01 286
0.29 0.32 0.48 0.30 0.99 0.30 0.92
Empowermentc 0.37 283 0.46 -0.20 300 0.38 -0.02 295 0.40 -0.06 286
0.48 0.50 0.02 0.49 0.83 0.49 0.45
Decides child nutrition 0.52 267 0.57 -0.11 279 0.54 -0.05 264 0.49 0.05 251
0.50 0.50 0.21 0.50 0.57 0.50 0.60
Note: Table continues on next page. Standard deviations (SD) are presented directly below means. Std. Diff. refers to the stan-
dardized difference in means of the control group and the respective treatment group. p-values refer to a t-test of the equality of
means of the control group and the respective treatment group and are presented below the Std. Diff.. a 10 quintiles based on
a durable asset index generated by factor analysis. b 10 quintiles based on a housing quality index generated by factor analysis.
c Indicator equals one if the mother is allowed to go alone to one of five places (market, health facility, neighbor’s, relatives or
friends outside the village, place of worship) and participates in one of four decisions (health investments, household purchases,
family visits outside village, and farm).
11Table I continued
Control Dialogic reading Lucky Iron Leaf Lucky Iron Leaf & Books
Mean Mean Std. Diff. Mean Std. Diff. Mean Std. Diff.
SD N SD p-value N SD p-value N SD p-value N
Child characteristics:
Sex of child 0.50 282 0.55 -0.10 298 0.58 -0.16 292 0.48 0.05 281
0.50 0.50 0.23 0.49 0.06 0.50 0.53
Currently breastfed 0.90 280 0.93 -0.10 294 0.90 -0.03 284 0.89 0.03 273
0.31 0.26 0.23 0.29 0.74 0.32 0.71
Vit-A past 6 months 0.72 180 0.73 -0.02 179 0.72 0.01 182 0.77 -0.11 180
0.45 0.44 0.84 0.45 0.96 0.42 0.28
Iron past 3 months 0.33 252 0.37 -0.09 258 0.34 -0.03 264 0.37 -0.09 253
0.47 0.48 0.31 0.48 0.71 0.48 0.32
Home environment:
Stimulation indexd 5.63 270 5.58 0.03 281 5.60 0.02 268 5.59 0.02 263
1.73 1.68 0.70 1.75 0.85 1.79 0.77
Good educat. measurese 0.81 267 0.79 0.05 277 0.78 0.06 267 0.79 0.04 257
0.40 0.41 0.60 0.42 0.46 0.41 0.66
Bad educat. measures f 0.73 274 0.68 0.12 284 0.74 -0.02 270 0.73 -0.01 264
0.44 0.47 0.16 0.44 0.85 0.44 0.90
Outcome measures:
Cognitive 0.00 250 -0.11 0.11 261 -0.08 0.07 257 0.01 -0.01 255
1.00 1.01 0.22 1.21 0.44 1.04 0.91
Receptive language -0.00 256 -0.19 0.18 267 -0.10 0.09 266 -0.18 0.17 260
1.00 1.02 0.04 1.13 0.29 1.05 0.05
Expressive language 0.00 255 -0.13 0.12 268 -0.11 0.10 265 -0.10 0.10 264
1.00 1.16 0.19 1.10 0.24 1.01 0.27
Motor 0.00 248 0.02 -0.03 255 0.08 -0.08 250 -0.01 0.01 251
1.00 0.95 0.78 1.00 0.37 0.98 0.87
Socioemotional -0.00 250 -0.06 0.05 264 -0.11 0.10 258 0.11 -0.10 256
1.00 1.17 0.54 1.16 0.26 1.13 0.26
Hemoglobin g/dL 10.21 191 10.11 0.08 197 10.25 -0.03 185 10.32 -0.08 197
1.34 1.32 0.43 1.41 0.78 1.40 0.44
Anemia (any type) 0.71 191 0.72 -0.02 197 0.68 0.06 185 0.66 0.09 197
0.46 0.45 0.85 0.47 0.59 0.47 0.38
Moderate Anemia 0.39 191 0.43 -0.08 197 0.39 0.01 185 0.36 0.08 197
0.49 0.50 0.44 0.49 0.95 0.48 0.45
p-value of joint F-test 0.19 0.68 0.35
Note: Standard deviations (SD) are presented directly below means. Std. Diff. refers to the standardized difference in means of
the control group and the respective treatment group. p-values refer to a t-test of the equality of means of the control group and
the respective treatment group and are presented below the Std. Diff.. d Sum of stimulating activities conducted with the child
in the past 3 days. e Equals 1 if the caregiver explains wrong behavior to child, takes away privileges or gives child something
else to do. f Equals 1 if the caregiver shouts, yells or screams at the child or spanks, hits, kicks or slaps the child.
among mothers is uncompleted primary school. About 90 percent of mothers were breastfeeding
their children at baseline and 59 percent breastfed exclusively. About 35 percent of children re-
ceived iron supplements in the last three months. Of the eight stimulating activities we enquired
about, 5.6 activities were conducted with the child in the past three days. Over 70 percent of care-
givers used yelling or physical violence (e.g. spanking or slapping) as an educational measure in
the past month (“bad educational measure” in Table I).
We use standardized differences in means, statistical significance of differences in means (p-
value), and a joint F-test for orthogonality to evaluate sample balance in Table I. Overall, the
joint F-test does not reject the equality of control group and treatment group means (see bottom
of Table I). Few characteristics differ judged by individual significant differences or standardized
12differences of 0.2 or larger (Cohen, 1988; Imbens and Rubin, 2015). These include maternal edu-
cation, literacy and empowerment, and children’s sex. Notably, in the combined intervention and
dialogic reading groups, children are worse off in receptive language skills. Other skill dimensions
do not show statistically significant differences.
IV E STIMATION STRATEGY
The main analysis focuses on the evaluation of the four main treatment arms on children’s out-
comes. The dialogic reading calendar will be considered with respect to intervention take-up in
section VI.A. We estimate intention-to-treat effects using the following specification:
yi = α + β1 DRi + β2 LILi + β3 DR&LILi + Xi γ + ui . (1)
yi is one of five child development scales, hemoglobin levels or an anemia dummy. DRi , LILi
and DR&LILi indicate treatment assignment to the dialogic reading, the Lucky Iron Leaf and the
combined intervention group, respectively. Xi is a vector of imbalanced baseline covariates and
includes mothers’ education, reading abilities and empowerment, children’s sex, and subdistrict
fixed effects. In estimations on hemoglobin levels and anemia, we additionally control for mea-
surement device fixed effects. β1 and β2 represent the intention-to-treat effects, i.e. disregarding
non-compliance, of the respective stand-alone intervention, whereas β3 measures the interaction
effect of the combination of both interventions. Due to random treatment assignment at the house-
hold level, we do not cluster standard errors.
In addition to the covariate adjusted treatment effects, we present intention-to-treat effects
without covariate adjustment and with baseline outcomes (ANCOVA). Controlling for baseline
outcomes, increases the estimates’ precision and overcomes a potential downward bias from im-
balances in receptive language apparent in both dialogic reading groups; however, it also reduces
the estimation sample by more than 100 observations. Therefore, we present the ANCOVA esti-
mates as additional evidence only. Due to the dialogic reading groups’ baseline disadvantages in
receptive language, the no-covariate and covariate adjusted estimates on receptive language present
lower bound estimates.
In total, we test 30 hypotheses in the main intention-to-treat analysis, following from six out-
comes tested in five subgroups. The six outcomes refer to iron deficiency, proxied by Hb levels
and anemia, and the five development scales. The five subgroups refer to the main effect estima-
tion and four heterogeneous treatment effect estimations by maternal education and empowerment,
and children’s sex and anemia status at baseline. We correct for multiple hypotheses testing using
Bonferroni adjustment and taking into account the average correlation across outcomes of 0.31
13(Sankoh, Huque and Dubey, 1997; Aker et al., 2012). The multiple hypotheses testing corrected
equivalent 10 percent significance level is 0.0096 and the equivalent 5 percent significance level is
0.0048. We will use these thresholds to mark adjusted significance levels in regression tables.
Given a sample size of roughly 280 observations per main treatment arm, statistical power of 80
percent and a significance level of 0.05, we are able to detect effect sizes of 0.24 standard deviations
in child development outcomes. Using the multiple hypotheses testing corrected significance level
of 0.0048 (equivalent to 0.05), the minimum detectable effect size rises to 0.31 standard deviations.
The minimum detectable effect size in hemoglobin is 0.35 g/dl (0.46 g/dl after multiple hypotheses
testing correction) and 11.9 percentage points in anemia prevalence (15.4 percentage points after
multiple hypotheses testing correction), given a sample size of 260 children per treatment arm.
The multiple hypotheses testing adjusted minimum detectable effect size in hemoglobin is less
than half the size of the impact (1.18 g/dl) the Lucky Iron Fish had on hemoglobin of Cambodian
women (Charles et al., 2015).
V R ESULTS
V.A Intention-to-treat effects on child development
Table II presents the intention-to-treat estimation results on cognitive development, receptive lan-
guage, expressive language, motor skills, and socioemotional development. The different columns
refer to a simple regression of the outcome on the three treatment group indicators (model 1), a
covariate adjusted model (model 2), and a covariate and baseline outcome adjusted model (model
3). The intention-to-treat effects are small and statistically insignificant across the three treatment
arms, outcomes and specifications. The adjustment for covariates causes a slight and insignificant
increase in the effect size relative to the simple model across all development scales. When we
additionally control for baseline outcomes, the magnitude of the effects remain similar and the
sample size decreases by about 10 percent. For subsequent analyses, we use the covariate adjusted
specification (model 2) as our preferred specification because it potentially purges the coefficients
of selection and improves efficiency, but maintains the larger sample size.
To test the results’ robustness, we add children’s age fixed effects (in months) and development
test facilitator fixed effects to model 2 (see appendix Table A.III.1). Further, we exploit the panel
structure of our data and estimate treatment effects using difference-in-differences, child fixed
effects and inverse probability weighted estimations. At last, we test whether dialogic reading
affected head circumference as an alternate measure of early mental functions (see appendix Table
A.III.2; Dupont et al., 2018).11 The robustness checks confirm the findings of Table II.
11 Head circumference was standardized according to WHO growth reference tables (World Health Organization,
14Table II: Intention-to-treat effects on child development
Model 1 Model 2 Model 3
Cognitive
DR 0.029 0.107 0.082
(0.087) (0.085) (0.089)
LIL -0.067 -0.001 -0.016
(0.088) (0.085) (0.089)
DR & LIL 0.037 0.064 0.083
(0.089) (0.086) (0.089)
Observations 1146 1136 1013
Adjusted R2 -0.001 0.082 0.087
Control mean -0.00 -0.00 -0.00
Receptive language
DR -0.046 -0.008 -0.027
(0.085) (0.085) (0.090)
LIL -0.026 0.017 -0.022
(0.085) (0.085) (0.089)
DR & LIL -0.008 0.018 0.001
(0.086) (0.086) (0.090)
Observations 1159 1148 1038
Adjusted R2 -0.002 0.029 0.030
Control mean -0.02 -0.02 -0.03
Expressive language
DR -0.014 0.035 0.040
(0.089) (0.088) (0.092)
LIL -0.039 0.040 0.031
(0.089) (0.088) (0.092)
DR & LIL 0.020 0.036 0.056
(0.090) (0.089) (0.092)
Observations 1159 1148 1041
Adjusted R2 -0.002 0.049 0.077
Control mean -0.01 -0.01 0.00
Motor
DR -0.013 0.051 0.005
(0.085) (0.083) (0.087)
LIL -0.022 0.020 -0.026
(0.085) (0.084) (0.087)
DR & LIL 0.029 0.059 0.015
(0.086) (0.084) (0.087)
Observations 1123 1113 994
Adjusted R2 -0.002 0.068 0.082
Control mean -0.00 0.00 0.00
Sociomeotional
DR 0.009 0.061 0.093
(0.081) (0.080) (0.086)
LIL -0.022 0.040 0.085
(0.081) (0.080) (0.086)
DR & LIL -0.017 0.012 0.019
(0.082) (0.081) (0.086)
Controls
Baseline outcome
Observations 1151 1140 1017
Adjusted R2 -0.002 0.039 0.044
Control mean -0.01 -0.01 0.00
Note: Dependent variables are standardized development scores and effect sizes are in standard deviations. Control variables are
maternal education, reading ability and empowerment, the child’s sex and subdistrict fixed effects. Baseline outcome indicates
that the estimation controls for the baseline value of the model’s dependent variable. Standard errors are in parentheses. Con-
ventional significance levels: * pV.B Intention-to-treat effects on hemoglobin and anemia
The causal impact chain of the Lucky Iron Leaf on child development runs through iron defi-
ciency. The null results of the Lucky Iron Leaf on child development suggest no improvements in
hemoglobin levels. In Table III, we formally test the treatment impact on hemoglobin, any type of
anemia, and moderate anemia. We use linear probability models to estimate the impact on binary
anemia outcomes.
We find no effect of the Lucky Iron Leaf as a stand-alone intervention or in combination with
dialogic reading on children’s hemoglobin levels and anemia status. The coefficients are close to
zero in the unadjusted model (model 1) and the covariate adjusted model (model 2). The baseline
outcome adjusted model coefficients (model 3) are somewhat larger but have the opposite sign than
expected. This is a result of sample selection caused by the reduction in sample size (see appendix
Table A.III.3 for results from all models in the baseline outcome adjusted sample).
The results are robust to replacing the standard covariates by a set of covariates, which we
identified in a balance analysis of a sample restricted to non-missing hemoglobin values at endline,
rather than only non-missing child development scores as in Table I. Further, the results are robust
to difference-in-differences and fixed effects estimations.
Failure to reduce iron deficiency implies early disruptions in the causal chain from intervention
implementation to its impact on anemia and mental development. If there had been temporary
improvements in iron deficiency, they did not sustain until endline and did not affect development
outcomes in the medium term. To further explore the effect of the Lucky Iron Leaf on outcomes
that show lasting effects of temporary nutritional changes, we estimate its impact on stunting,
known for its representation of nutrition history (Black et al., 2013), as well as on wasting and
underweight.12 The results show that the Lucky Iron Leaf intervention also had no impact on
growth outcomes (see appendix Table A.III.2).13
We presume zero-effects of the dialogic reading treatment on iron deficiency because there is
no theoretical link from book reading to nutrition. Yet, in Table III, the intention-to-treat effects
of the stand-alone dialogic reading treatment on hemoglobin are negative and, in models 2 and
3, statistically significant before multiple hypotheses testing. The effect in model 3 is driven by
sample selection due to missing baseline anemia information (see appendix Table A.III.3). We
do not find a statistically significant negative effect of the pure book sharing intervention on early
skills. If the book sharing intervention indeed had a negative effect on iron deficiency, which also
affected child development, then these negative effects on child development were compensated
2007).
12 Growth outcomes were derived in accordance with WHO growth reference tables (World Health Organization,
2007)
13 The link between iron intake and growth outcomes is still disputed (Rivera et al., 2003; Iannotti et al., 2006).
Therefore, the lack of treatment effects may also be interpreted as a missing link between the two in general.
16Table III: Intention-to-treat effects on hemoglobin and anemia
Model 1 Model 2 Model 3
Hemoglobin in g/dl
DR -0.152 -0.177 -0.121
(0.119) (0.119) (0.125)
LIL 0.003 -0.010 -0.132
(0.120) (0.120) (0.127)
DR & LIL 0.025 -0.012 -0.158
(0.119) (0.120) (0.125)
Observations 1048 1039 710
Adjusted R2 -0.000 0.033 0.269
Control mean 10.63 10.63 10.67
Any anemia
DR 0.056 0.073* 0.112**
(0.043) (0.043) (0.048)
LIL 0.008 0.016 0.064
(0.044) (0.044) (0.049)
DR & LIL -0.018 -0.004 0.045
(0.043) (0.044) (0.048)
Observations 1048 1039 710
Adjusted R2 0.000 0.025 0.176
Control mean 0.56 0.56 0.54
Moderate anemia
DR 0.035 0.035 0.030
(0.039) (0.040) (0.046)
LIL 0.006 0.003 0.044
(0.040) (0.040) (0.047)
DR & LIL -0.009 -0.001 0.054
(0.040) (0.040) (0.046)
Observations 1048 1039 710
Adjusted R2 -0.001 0.013 0.111
Control mean 0.28 0.28 0.26
Controls
HemoCue machine fixed effects
Baseline outcome
Note: Hemoglobin is measured in g/dl. Any and moderate anemia are binary indicators. Control variables are maternal educa-
tion, reading ability and empowerment, the child’s sex and subdistrict fixed effects. HemoCue machine fixed effects control for
the hemoglobin measurement device and tester. Baseline outcome indicates that the estimation controls for the baseline value
of the model’s dependent variable. Standard errors are in parentheses. Conventional significance levels: * pcomes at a cost of credibility, among other important disadvantages (Humphreys, De la Sierra and
Van der Windt, 2013; Miguel et al., 2014; Ofosu and Posner, 2020). To attenuate such concerns,
for each tested heterogeneity, we present theoretical underpinnings that directly emerge from the
relevant literature:
1. Maternal education
In a series of estimations of production functions for cognition and health of children in
low income settings, Attanasio and coauthors investigate the relevance of parental cognition,
typically proxied by education and literacy (Attanasio, Meghir and Nix, 2020; Attanasio
et al., 2020a,b).14 For India, Attanasio, Meghir and Nix (2020) find that parental cognition
improves the productivity of investments on children’s cognition, but not on health. Based
on this, we hypothesize that the productivity of the dialogic reading investment is higher for
better educated mothers. Educated mothers are likely to follow the training and internalize
the methods of dialogic reading with more ease and perform higher quality book sharing.
In line with Attanasio, Meghir and Nix (2020), we do not expect strong heterogeneities by
mother’s education for the nutrition intervention, because the cooking procedures are simple
to implement.
2. Maternal empowerment
The literature on the influence of spousals’ bargaining power on investments in children is
abundant (e.g., Dyson and Moore, 1983; Thomas, 1993; Lundberg, Pollak and Wales, 1997;
Haddad, Hoddinott and Alderman, 1997; Attanasio and Lechene, 2002; Duflo, 2003; Smith
et al., 2003; Maitra, 2004; Qian, 2008; Bobonis, 2009; Jensen and Oster, 2009; Doepke
and Tertilt, 2019; Kandpal and Baylis, 2019). In this literature, women are often found
to invest more resources than men into children’s health and education, provided they are
sufficiently empowered to make these decisions. Similarly, in the context of this study,
women’s empowerment may matter for the regular use of picture books and the Lucky Iron
Leaf. More empowered women may choose to spend their time on book sharing or decide
to alter cooking habits in order to incorporate the use of the Lucky Iron Leaf. Further, more
empowered women can participate more confidently and engaged in the dialogic reading
trainings, which may improve their understanding of dialogic reading concepts and, thus,
the quality of book sharing.
3. Children’s sex
Differential investments into children by sex and the impact of that on children’s outcomes
14 In the estimation of the production function in Colombia, Attanasio et al. (2020b) use mother’s education, vocab-
ulary, Raven’s score, the number of adult books and the number of magazines and newspapers in the home to proxy
for mother’s cognition.
18have been widely documented in India. Already early in life, daughters are breastfed for
shorter time, receive less childcare time, vaccinations, and vitamin supplements, are less
likely to be hospitalized, are shorter, have lower cognitive skills and suffer excess mortality
(e.g. Klasen and Wink, 2002, 2003; Jha et al., 2006; Oster, 2009; Asfaw, Lamanna and
Klasen, 2010; Bhalotra and Cochrane, 2010; Jayachandran and Kuziemko, 2011; Barcellos,
Carvalho and Lleras-Muney, 2014; Bongaarts and Guilmoto, 2015; Jayachandran and Pande,
2017; Ebert and Vollmer, 2019). Therefore, caregivers may also choose to invest more or
better quality book sharing into their sons than daughters or tend to rather feed the fortified
meals to their sons than daughters.
4. Children’s anemia status
Children’s anemia status, as a proxy for iron deficiency, can matter along two dimensions for
the effectiveness of the interventions. Biologically, iron deficiency can have multiple effects
that adversely alter brain growth and behavior (Lozoff, 2007; Beard, 2008). Iron deficient
children are tiring easily, are more wary, hesitant, unhappy and have less social interactions
(Lozoff, 2007). However, children’s interest and active engagement during book sharing is
key for children to learn and, thus, improvements in mental development from book sharing
may be compromised among iron deficient children (Arnold et al., 1994; Jalongo, 2004;
Ortiz, Stowe and Arnold, 2001). Also economists studying the production function of child
development, show that good health positively affects parental investment in children as well
as later health and cognitive outcomes (Attanasio, Meghir and Nix, 2020; Attanasio et al.,
2020a). The second dimension along which children’s baseline anemia may affect children’s
hemoglobin level and, therefore, mental development, is parents’ behavioral response to the
results of their children’s baseline anemia testing. The knowledge of, or being reminded
about, your child’s anemia status may evoke parents’ motivation to learn about and utilize
the Lucky Iron Leaf.
The results by mothers’ education and empowerment and children’s sex do not confirm the
hypotheses derived from the literature. The interaction coefficients of the dialogic reading inter-
vention groups with maternal education are mostly negative and insignificant (see appendix Table
A.IV.1).15 Similarly, the coefficients by maternal empowerment show no consistent patterns and
are insignificant (see appendix Table A.IV.1). The heterogeneity analysis by children’s sex pro-
15 The coefficients on the interaction of the Lucky Iron Leaf intervention with maternal education are positive and
sizeable for cognitive and receptive language skills (0.40 and 0.51 SD) and negative for hemoglobin (0.50 g/dl), but
are insignificant after multiple hypotheses testing. The coefficients’ size and significance decrease when the main
effects are added such that the effect on hemoglobin is not significant even before multiple hypotheses testing. If we
wanted to interpret the effects on cognition and receptive language, then these results could only stem from temporary
improvements in iron deficiency, which later reversed. However, given the inconsistency of these results, we refrain
from drawing any conclusions.
19vides some evidence opposing our third hypothesis (see appendix Table A.IV.2). Although not
significant after multiple hypotheses testing, girls in the dialogic reading and Lucky Iron Leaf
groups improve in motor development (0.28 SD and 0.20 SD respectively), whereas boys do not.
One explanation may be that boys have less potential than girls to improve in motor skills, which is
in line with the observed boy-premium in motor development (appendix Table A.IV.2). The same
treatment intensity across sexes (or even lower treatment intensity among girls) could then lead to
a larger increase in motor skills among girls than boys.
The heterogeneous treatment effects by children’s baseline anemia status provide compelling
insights. Non-anemic children, who make up 30 percent of the baseline sample, gain 0.54 standard
deviations in receptive language skills from the combined intervention, whereas anemic children
do not benefit at all (see appendix Table A.IV.2). The effect is significant at the five percent
equivalent level after multiple hypotheses testing. The estimates of the stand-alone dialogic reading
treatment on receptive language skills and the combined intervention on cognitive skills for non-
anemic children are also considerable in size (0.42 SD and 0.45 SD, respectively), but are no longer
statistically significant after multiple hypotheses testing. The reason we find a salient effect in the
combined intervention group might be that the additional home visit to distribute the Lucky Iron
Leaf, which focused on children’s health, reinforced the dialogic reading training.
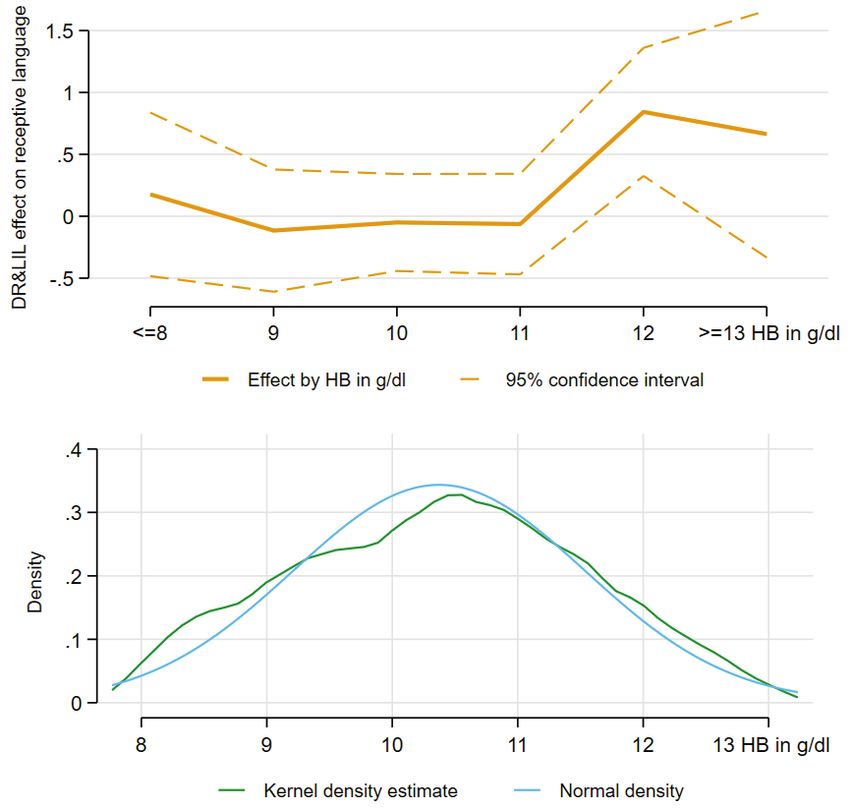
Figure 2 visualizes the treatment effect heterogeneity by hemoglobin level of the combined
intervention on receptive language skills. The marginal treatment effect at each hemoglobin level
is estimated based on a model in which each treatment indicator is interacted with each hemoglobin
level (rounded to the nearest integer). The top panel of Figure 2 displays these treatment effects
and the bottom panel shows the kernel density distribution of hemoglobin as well as the normal
density distribution for comparison reasons. Interestingly, the heterogeneity in treatment effects
exactly corresponds to the WHO anemia cut-off for children below 59 months. Children with a
hemoglobin level of 11 g/dl or above are considered non-anemic and show higher treatment effects
on receptive language than anemic children do.
The results are in line with the hypothesis that non-anemic children gain more from dialogic
reading because they can engage more actively in book sharing in comparison to anemic children
who tend to be tired and less explorative. We examine potential mechanisms of the link between
baseline anemia and intervention effectiveness in detail in the subsequent section V.D.
We do not observe heterogeneous treatment effects of the Lucky Iron Leaf by children’s base-
line anemia status on hemoglobin levels at endline. Therefore, we reject the hypothesis that care-
givers of anemic children are more motivated to learn about and utilize the Lucky Iron Leaf. In
fact, the coefficients rather suggest improvements in hemoglobin from iron fortification among
non-anemic children and adverse effects among anemic children, though all coefficients are in-
significant (see appendix Table A.IV.2).
20You can also read