RULE THE MARKET ISSUE: 016 - 22ND DECEMBER, 2018 - Karvy
←
→
Page content transcription
If your browser does not render page correctly, please read the page content below

22ND DECEMBER, 2018

RULE THE MARKET

          ISSUE: 016
CONTENTS
                                                                                                              From The Desk Of Research Head
   Equity                                                                       1-6

   Derivatives                                                                 7-8

   Commodity                                                                  9-12           Tightened Immigration rules in the US, an opportunity for
   Currency                                                                  13-14           Indian IT companies to evolve higher
                                                                                             The current mulling of the US Immigration and Citizenship Services (USCIS) to take back the existing
   Events                                                                        15
                                                                                             lottery system for H-1B visas wasn’t a surprising one. Stricter immigration laws and modification of
                                                                                             visa rules became a foreseeable feature of Donald Trump’s Presidency. It became a difficult tenure for
                                                                                             techies to get their aspiring IT jobs in the US due to the continuous changes in H-1B visa rules. Around
     Team                                                                                    10 months ago, for instance, a replacement rule was introduced, that forced firms to prove that their
     Dr Ravi Singh                                                                           H-1B workers at a third-party worksite had specific and special skills to function prompting the USCIS
     Arun Kumar Mantri
                                                                                             to reduce the visa period to less than a month in some instances. All this emanates, as the Trump
     Aditya Kistampally
                                                                                             administration believes that firms hire cheap foreign labor over Americans. However, a domestic US
     Deepak Balkrushna Sakure
                                                                                             analysis shows that H-1B employees are paid higher over US-born employees who hold graduation
     M V Narasinga Rao
     Murad Bapuji Chinoy                                                                     ($76,356 versus $67,301), it’s also an undeniable fact that for a long time some IT services firms have

     Naga Chaitanya                                                                          heavily relied on taking affordable, competent labor to countries like the USA. This model made the
     Osho Krishan                                                                            Indian IT corporations to lead in the low-cost projects but made it tough to navigate in the shift over to
     Srinivas Krishnan Bobba                                                                 new transformational platforms like AI, robotics and automation.
     Vivek Korkondabhattar
     Munindra Upadhyaya
                                                                                             Diverging the business models
     Yash Bhotika                                                                            The tightened visa rules might turn as a boon for Indian IT companies as they may diverge their
     Sarath Jutur                                                                            business blueprints to which they already started domestic hiring in the US and has started to increase
     Konpal Pali                                                                             the percentage of their offshore work. Recently, TCS won a landmark judgment in one of the USA
     Thomas Abraham
                                                                                             proceedings when a state jury rejected claimed that TCS had discriminated against non-South Asian
     Vivek Ranjan Misra
                                                                                             employees within the USA. The company has won the case as it was able to show that it invested over
     Veeresh Hiremath
                                                                                             100 million dollars in the US in skill development and has created around 17,000 jobs in the US during
     Arpit Chandna
                                                                                             the years 2011-2017. Since Indian IT services firms have started hiring onshore instead of relying on
     Ravi Pandey
     Anup. B.P                                                                               H-1B visas, this may lead for a shift in businesses to digital technologies, that tend to use automation,
     Amit Kumar                                                                              resulting in lower demand of large human resource. Globally, these new technologies are enabling
     Ramesh Chenchala                                                                        tectonic shifts in systems and processes that require superhuman capabilities in varied dimensions.
     Vinod Jaya kumar
                                                                                             What else could be done to boost the sector further?
     Ravikanth Pedapati
                                                                                             Indian IT firms ought to unfold the business to additional geographies, particularly within the domestic
     Karvy Head Office                                                                       market. Our country accounts for fewer than ten percent of the revenues compared to the most IT
     Karvy Stock Broking Limited, Plot No.31, 6th Floor, Karvy                               giants even during the times when the US and Europe are moving towards stricter immigration rules.
     Millennium Towers, Financial District, Nanakramguda,                                    IT services firms ought to use this as a chance to adapt to automated delivery platforms for the digital
     Hyderabad, 500 032, India.
                                                                                             age.
     For More updates & Stock Research
     Visit: www.karvyonline.com                                                                                                                                                                 - DR. RAVI SINGH
     Toll free: 1800 419 8283                                                                                                                                          Head-Technical & Derivatives Research
     Email: research@karvy.com
     Analyst Certification
     The following Karvy Research Desk, who is (are) primarily responsible for
     this report and whose name(s) is/ are mentioned therein, certify (ies) that
     the views expressed herein accurately reflect his (their) personal view(s)
     about the subject security (ies) and issuer(s) and that no part of his (their)
     compensation was, is or will be directly or indirectly related to the specific
     recommendation(s) or views contained in this research report.

Disclaimer: Karvy Stock Broking Limited [KSBL] is registered as a research analyst with SEBI (Registration No INZ000172733). KSBL is also a SEBI registered Stock Broker, Depository Participant, Portfolio Manager and also
distributes financial products. The subsidiaries and group companies including associates of KSBL provide services as Registrars and Share Transfer Agents, Commodity Broker, Currency and forex broker, merchant banker
and underwriter, Investment Advisory services, insurance repository services, financial consultancy and advisory services, realty services, data management, data analytics, market research, solar power, film distribution
and production, profiling and related services. Therefore associates of KSBL are likely to have business relations with most of the companies whose securities are traded on the exchange platform. The information and
views presented in this report are prepared by Karvy Stock Broking Limited and are subject to change without any notice. This report is based on information obtained from public sources, the respective corporate under
coverage and sources believed to be reliable, but no independent verification has been made nor is its accuracy or completeness guaranteed. The report and information contained herein is strictly confidential and meant
solely for the selected recipient and may not be altered in any way, transmitted to, copied or distributed, in part or in whole, to any other person or to the media or reproduced in any form, without prior written consent
of KSBL. While we would endeavor to update the information herein on a reasonable basis, KSBL is under no obligation to update or keep the information current. Also, there may be regulatory, compliance or other
reasons that may prevent KSBL from doing so. The value and return on investment may vary because of changes in interest rates, foreign exchange rates or any other reason. This report and information herein is solely
for informational purpose and shall not be used or considered as an offer document or solicitation of offer to buy or sell or subscribe for securities or other financial instruments. Though disseminated to all the customers
simultaneously, not all customers may receive this report at the same time. KSBL will not treat recipients as customers by virtue of their receiving this report. Nothing in this report constitutes investment, legal, accounting
and tax advice or a representation that any investment or strategy is suitable or appropriate to your specific circumstances. This material is for personal information and we are not responsible for any loss incurred based
upon it. The investments discussed or recommended in this report may not be suitable for all investors. Investors must make their own investment decisions based on their specific investment objectives and financial
position and using such independent advice, as they believe necessary. While acting upon any information or analysis mentioned in this report, investors may please note that neither KSBL nor any associate companies of
KSBL accepts any liability arising from the use of information and views mentioned in this report. Investors are advised to see Risk Disclosure Document to understand the risks associated before investing in the securities
markets. Past performance is not necessarily a guide to future performance. Forward-looking statements are not predictions and may be subject to change without notice. Actual results may differ materially from those
set forth in projections. Associates of KSBL might have managed or co-managed public offering of securities for the subject company or might have been mandated by the subject company for any other assignment in
the past twelve months. Associates of KSBL might have received compensation from the subject company mentioned in the report during the period preceding twelve months from the date of this report for investment
banking or merchant banking or brokerage services from the subject company in the past twelve months or for services rendered as Registrar and Share Transfer Agent, Commodity Broker, Currency and forex broker,
merchant banker and underwriter, Investment Advisory services, insurance repository services, consultancy and advisory services, realty services, data processing, profiling and related services or in any other capacity.
KSBL encourages independence in research report preparation and strives to minimize conflict in preparation of research report. Compensation of KSBL’s Research Analyst(s) is not based on any specific merchant
banking, investment banking or brokerage service transactions. KSBL generally prohibits its analysts, persons reporting to analysts and their relatives from maintaining a financial interest in the securities or derivatives
of any companies that the analysts cover.KSBL or its associates collectively or Research Analysts do not own 1% or more of the equity securities of the Company mentioned in the report as of the last day of the month
preceding the publication of the research report. KSBL or its analysts did not receive any compensation or other benefits from the companies mentioned in the report or third party in connection with preparation of the
research report and have no financial interest in the subject company mentioned in this report. Accordingly, neither KSBL nor Research Analysts have any material conflict of interest at the time of publication of this report.
It is confirmed that KSBL and Research Analysts, primarily responsible for this report and whose name(s) is/ are mentioned therein of this report have not received any compensation from the subject company mentioned
in the report in the preceding twelve months. It is confirmed that Research Analyst did not serve as an officer, director or employee of the companies mentioned in the report. KSBL may have issued other reports that are
inconsistent with and reach different conclusion from the information presented in this report. Neither the Research Analysts nor KSBL have been engaged in market making activity for the companies mentioned in the
report. We submit that no material disciplinary action has been taken on KSBL by any Regulatory Authority impacting Equity Research Analyst activities.
EQUITY

                                      NEWS                                                                                  TREND SHEET
                                                                                                 Symbol           CMP         S2         S1          R1         R2         TREND
Economy
•   The government will infuse Rs. 830 billion in state-owned banks to strengthen their
                                                                                                 SENSEX          35742.07    35137      35440       36300      36858       Down
    capacity to lend. The action will help the banks to come out of the Reserve Bank of
    India’s Prompt Corrective Action (PCA).
                                                                                                  NIFTY           10754      10579      10667       10913      11072       Down
•   The Lok Sabha passed Consumer Protection Bill, 2018, which seeks to widen the ambit
    of consumer protection.
•   The government of Maharashtra announced a Rs. 1,500 million relief package to its onion     NIFTYBANK        26869.65    26475      26672       27218      27567        Up
    farmers. The package is set to benefit 250,000–300,000 farmers in the state who sold
    their produce between November 1 and December 15 this year.                                 IBULHSGFIN        816.85      714        765         872        926         Up
Automobile
•   Hyundai Motor India has announced price hike of up to 30,000 rupees across all models,       YESBANK          182.95      171        177         189        194         Up
    effective January.
BFSI                                                                                             RELIANCE        1,100.20    1063       1082         1133       1166       Down
•   The credit growth of Indian banks remained firm with loan books growing over 15% in
    the fortnight ended Dec 7.                                                                   MARUTI          7,536.30    7232       7384         7819       8102       Down
•   Indian Banks’ Association has written to the RBI seeking some dispensation on
    treatment of debt to beleaguered Infrastructure Leasing & Financial Services and            AXISBANK         620.85       591        606         644        667         Up
    group entities in Oct-Dec due to the legal uncertainty.
•   The RBI has introduced a limit on the overall outstanding stock of external commercial
                                                                                                   INFY          646.20       599        622         691        736        Down
    borrowings at 6.5% of the GDP.
Aviation
                                                                                                ICICIBANK        354.20       341        348         365        376        Down
•   Indigo has revised its capacity addition for FY19 to 30% from 25%. Most analysts
    believe that the aggressive deployment of planes should take its market shares to at
    least 45% in next three years from 43% at present.                                         BAJFINANCE        2,591.25    2373       2482        2665        2738        Up

Metals
                                                                                                   SBIN           291.90      279        285         300        309         Up
•   The National Company Law Appellate Tribunal has reserved its order on the Bhushan
    Power and Steel insolvency case.
                                                                                                  HDFC           1,948.60    1877       1913         1985       2021        Up
•   Coal India said it would pay interim dividend of INR 7.25 per share aggregating to INR
    45bn to its shareholders. The record date is 31st December.
Telecom
•   The Bharti Airtel’s board approved sale of up to 591.2mn equity shares, representing
    32% stake of Bharti Infratel owned by the company to its arm Nettle Infrastructure
    Investments. After the deal, Bharti Airtel will own 18.33% stake in its Infratel arm                         FORTHCOMING EVENTS
    and Nettle Infrastructure Investments and the public will hold 35.18% and 46.49%,
    respectively.                                                                               COMPANY NAME                EX DATE                         PURPOSE
Pharma
•   Online pharma companies have got temporary relief from the Madras High Court, after             RITES Ltd.              27-Dec-18           Interim Dividend - Rs. 4.7500
    a division bench, consisting of Justice M Satyanarayanan and Justice P Rajamanickam
    suspended a single-judge order banning online sale of drugs and cosmetics, till it gives    SAYAJI INDUSTRIES                                     Stock Split From
    final order in the matter.                                                                                              27-Dec-18
                                                                                                          LTD.                                       Rs. 10/- to Rs. 5/-
•   Dr Reddy’s Laboratories: Aquestive and Indivior said they would file a petition with
    the U.S. Court of Appeals for the Federal Circuit for hearing on the ruling to vacate
    the preliminary injunction that enjoined Dr. Reddy’s from launching its generic            TRIVENI TURBINE LTD.         27-Dec-18                Buy Back of Shares
    buprenorphine/naloxone sublingual film.
Oil and gas
•   India is moving towards getting discounts on crude oil purchases from the Organisation
                                                                                                CAPITAL FIRST LTD.          28-Dec-18                  Amalgamation
    of the Petroleum Exporting Countries and the days of paying so-called Asian premium
    are over.

                                                                                                 COAL INDIA LTD.            28-Dec-18           Interim Dividend - Rs. 7.2500

                 INTERNATIONAL NEWS
                                                                                               DHANUKA AGRITECH
                                                                                                                            01-Jan-19                Buy Back of Shares
                                                                                                          LTD.
• Foreign Ministers of India, China hold talks under new framework
• US air campaign against Islamic State in Syria likely to end                                  TECHNO ELECTRIC
• UN Secretary General welcomes resolution of political crisis in Sri Lanka                      & ENGINEERING              02-Jan-19                Buy Back of Shares
                                                                                                 COMPANY LTD.
• Japan’s cabinet approves record $900 billion budget, aims to soften sale tax
  blow
• Japan prosecutors re-arrest Carlos Ghosn on new allegations
• US slaps fresh sanctions on Russian spies for meddling in 2016 election, nerve
  agent use
• Bank of England leaves interest rates on hold as Brexit hits the economy - as it
  happened
• The Fed took the target range for its benchmark funds rate to 2.25 % to 2.5 %.
  GDP is now seen as rising 3 % for the full year of 2018, down one-tenth of a
  %age point from September and 2.3 % for 2019, a 0.2 % point reduction

KSTREET - 22ND DECEMBER 2018                                                                                                                                                 1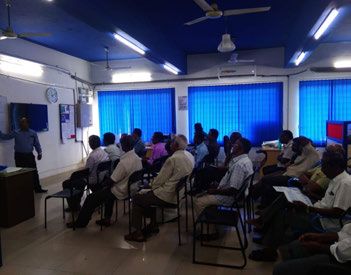
2
ZEE ENTERTAINMENT ENTERPRISE
NSEFMCG
FII/FPI & DII TRADING (IN RS. CRORES)
19-12-18
INFOSYS LTD
NSEREAL
TATA CONSULTANCY SVCS LTD
SECTORAL INDICES (% CHANGE)
TOP GAINERS & LOSERS (1W)
NSECON 18-12-18
UPL LTD
NSENRG
17-12-18 GRASIM INDUSTRIES LTD
DII
NSEMET
KOTAK MAHINDRA BANK LTD
FII/FPI
NSEIT 16-12-18
JSW STEEL LTD
NSEPHRM
TATA MOTORS LTD
15-12-18
NSE NIFTY
NSESRV POWER GRID CORP OF INDIA LTD
NSEBANK BHARAT PETROLEUM CORP LTD
14-12-18
HINDUSTAN PETROLEUM CORP
NSEAUTO
200
-200
800
600
1000
400
-400
0
0
-5
-10
5
10
15
-1
-4
0
1
-5
-3
-2
2
CAC 40 GRAPHITE INDIA LTD
NIFTY Midcap 100
LARSEN & TOUBRO INFOTECH LTD
FTSE 100
Nifty Next 50
TOP GAINERS & LOSERS (1W)
QUESS CORP LTD
GLOBAL INDICES (% CHANGE)
SHANGHAI COMP
INDIAN INDICES (% CHANGE)
OBEROI REALTY LTD
BSE SmallCap
HANG SENG JUBILANT LIFE SCIENCES LTD
KSTREET - 22ND DECEMBER 2018
NIFTY MIDCAP100
IDFC BANK LTD
BSE MidCap NIKKEI
DEWAN HOUSING FINANCE CORP
S&P500
SENSEX VAKRANGEE LTD
DOW JONES
EQUITY
BANK OF INDIA
Nifty 50
NASDAQ CENTRAL BANK OF INDIA
-0.6
-0.8
-0.2
0.6
0.8
0.2
0
1
-0.4
0.4
0
20
-5
-10
5
10
15
-1
-4
0
-5
-6
-9
-8
-3
-2
-7
EQUITY

                                        BEAT THE STREET - FUNDAMENTAL ANALYSIS

Shriram Transport Finance                                                                        VALUE PARAMETERS
CMP 			Rs.1200                                                                    Face Value (Rs.)                                            10

                                                                                  52 Week High/Low (Rs.)                             1668/902
Target Price		 Rs.1400
                                                                                  M.Cap (Rs. Bn/US $mn)                               272/388
Upside		 16.7%                                                                    EPS (Rs.)                                                  140

                                                                                  P/E Ratio (times) (FY20E)                                 8.57

                                                                                  Dividend Yield (%)                                        0.41

                                                                                  Stock Exchange                                             NSE

                                                                                                % OF SHARE HOLDING

Investment Rationale
• AUM growth to sustain ~20% over FY19E-FY21E; rural know a formidable
  forte: The AUM growth as of 2QFY19E was at 20.9% YoY and we estimate
  the same to sustain at 20%-19% in FY19E-FY20E. While we assess the
  old book vehicle portfolio structural growth rate at ~14-15%, we see
  the delta in growth from the growing presence in the rural, new vehicle
  and business loans over a smaller base. We underscore that rural-semi-
  urban now constitutes ~35% of the AUM, and we estimate the inch-up to
  continue. The rush for pre-buying relating to the implementation of BS-VI
                                                                                  in Rs.Mn             ACTUAL             ESTIMATE
  starting 1st April 2020 could lead to some pressure on pricing in the older
  vehicle sales. However, expect an increase in pricing in FY20E as the BS-       YE Mar                  FY 18   FY 19              FY 20
  VI implementation expected to lead to ~10-15% in increase in pricing of
  vehicles.                                                                       NII                     67687   81708              97297

• Business model to stand out on margins amidst the borrowing cost                PAT                     24701   25675              31808
  upheaval: We estimate largely a stable outlook on margins factoring in the
                                                                                  BV (Rs.)                 594    696                 822
  business model providing for strong pricing power. Impact on yields from
  Inch up in the new vehicle in the overall AUM is estimated to be more than      EPS (Rs.)                109     113                140
  offset by increasing share of the rural and other business loans. The 8 bps
  sequential increase in the NIMs in 2QFY19 is aided by inch up in a share of     RoE (%)                  19.2    17.5              18.5
  rural and also higher assignments.
                                                                                  Gross PA(%)              8.7     9.5                8.8
• Higher than estimated credit cost in 2QFY19; assess improvement going
  ahead: The annualized credit cost in 2QFY19 was at 2.6% vs. 2.1% in 1QFY19.
  Adjusted for Kerala related provisioning (Rs. 600 million) the credit cost is
  still relatively high at 2.4%.
                                                                                                           P/E CHART
• The management attributed the incremental cost to monsoon-related
  slowdown and had guided for the credit cost at ~2.0% over the next one
  and a half year. We have built-in improvement in credit cost to 2.1% in
  FY20E vs. 2.3% in FY19E.

    Valuation
    The stable margins performance coupled with the healthy growth
    over FY19-FY20E shall underscore the strong and niche competitive
    positioning. We estimate ROE at 17.4%/18.0% in FY19E/FY20E. We
    value the stock at Rs. 1400 (1.7x FY20E P/B) as the formidable size
    yielding a modest outlook on growth, and the overhang from the
    speculated M&A, tempers our expectation on the target price.

KSTREET - 22ND DECEMBER 2018                                                                                                                  3
EQUITY

                                          BEAT THE STREET - FUNDAMENTAL ANALYSIS

Jain Irrigation Systems Ltd                                                                     VALUE PARAMETERS
CMP 			Rs.69                                                                     Face Value (Rs.)                                            2.0

                                                                                 52 Week High/Low (Rs.)                               150/55
Target Price		 Rs.101
                                                                                 M.Cap (Rs. Bn/US $mn)                               35.6/0.5
Upside		 46%                                                                     EPS (Rs.)                                                  10.6

                                                                                 P/E Ratio (times) (FY20E)                                   6.5

                                                                                 Dividend Yield (%)                                         1.4%

                                                                                 Stock Exchange                                             ---N

                                                                                              % OF SHARE HOLDING

Investment Rationale
• Jain Irrigation Systems Limited is the 2nd largest in the world and the
  largest in the country in Micro-Irrigation Systems business. Apart from MIS,
  the company also deals in plastic piping, agro-processing and renewable
  energy which provides good synergy to business.
• Central government’s initiatives like adding at least 1 million hectares of
  land under micro irrigation every year, building 100 smart cities, housing
  for all, etc. to ensure continued orders for MIS and plastics pipes & sheets
  products.                                                                      in Rs.Mn             ACTUAL             ESTIMATE

• The lower level of water in parts of Maharashtra, Gujarat and Madhya           YE Mar                  FY 18   FY 19              FY 20
  Pradesh to create demand for MIS products such as Drip & Sprinkler
  irrigation in the regions.                                                     REVENUE                79468    90427              102540
• PE pipes within pipe project business are growing at a faster pace and the
                                                                                 EBITDA                 10554    13233              15979
  company continues to get a good flow of order.
• Food processing business of the company is doing very well especially in       EBITDA(%)                13.3   14.6                15.6
  overseas markets.
                                                                                 PAT                      2213   3764               5470
• Stabilization of political and economic situations in Turkey, Brazil and
  Mexico will ensure the company getting new irrigation projects, food           EPS (Rs.)                4.3     7.3                10.6
  processing and pipes orders from these regions.
                                                                                 ROE (%)                  5.2     8.3                11.1
• Export-focused business strategy is yielding good results. The company
  has started getting PE pipes orders from overseas markets which have
  primarily been domestic.
• The company is aiming at substantially reducing its debt by bringing in                                 P/E CHART
  business efficiency in terms of reduction in receivables, inventories and
  old receivables.

    Valuation
    Taking into considerations stabilizing INR, softening of crude oil and
    strong order books we have valued the stock on 1 year forward PE 9.5x
    of FY20E EPS and have arrived at a target price of Rs.101 with a potential
    upside of 46%. However, key risks to valuation could include high capital
    intensive nature of business and Fx-fluctuations.

KSTREET - 22ND DECEMBER 2018                                                                                                                 4
EQUITY

                                             BEAT THE STREET - TECHNICAL ANALYSIS

Ingersoll Rand India Limited
                                                                                                                                             Stock              INGERRAND

                                                                                                                                              CMP                   564.9

                                                                                                                                             Action                 BUY

                                                                                                                                              Entry               550-560

                                                                                                                                            Average                 480

                                                                                                                                            Stop loss               450

                                                                                                                                             Target                 709

                                                                                                                                            Target 2                 738

                                                                                                                                          Time Frame            6-9 Months

INGERRAND has rallied from 189 levels in August 2013 to 733 levels in April 2015 and corrected from there to 382 levels, which is around 61.8% Fibonacci retracement level of
the said rally and bounced back to settle above 38.2% Fibonacci retracement levels of the rally, indicating the end of the correction. The stock is well placed above an unfilled
gap 533.5-533.65 in the daily chart, suggesting strong support around these levels. Adding to it, the Parabolic SAR and Heiken candlesticks are signaling a positive trend on
the daily charts, reflecting the stock is well placed to move higher in the coming days. 14 periods RSI is trading above the 9-period averages in the weekly chart, indicating
positive momentum. The stock is trading well above all of its major moving averages on the daily as well as weekly charts, indicating strong positive momentum in the counter
for all major time frames. On Bollinger bands, the weekly chart stock has tested the mean and started to move towards upper bands, indicating positive momentum. At the
current levels, the stock has given an excellent opportunity for medium to long-term investors to accumulate the stock on dips around 550-560 levels for the potential upside
targets of 709-738 levels over the next 6-9 months, keeping a stop loss below 450 levels.

Aditya Birla Fashion and Retail Ltd
                                                                                                                                             Stock                 ABFRL

                                                                                                                                              CMP                   205

                                                                                                                                             Action                 BUY

                                                                                                                                              Entry               195-200

                                                                                                                                            Average                  175

                                                                                                                                            Stop loss                160

                                                                                                                                             Target                 250

                                                                                                                                            Target 2                 263

                                                                                                                                          Time Frame            6-9 Months

ABFRL has rallied from 132.10 levels in July 2018 to 215.75 levels in August 2018 and corrected from there to 160.25 levels, which is around 61.8% Fibonacci retracement level
of the said rally and bounced back to settle above 23.6 % Fibonacci retracement levels of the rally, indicating the end of the correction. The stock has given symmetric
triangle chart pattern breakout with a jump in volume during this phase, indicating a fresh leg of the rally in the stock. Adding to it, the Parabolic SAR and Heiken candlesticks
is signaling positive trend on the daily charts, reflecting the stock is well placed to move higher in the coming days. 14-periods RSI is trading above the 9-period averages in
the weekly chart, indicating positive momentum. The stock is trading well above all of its major moving averages on the daily charts, indicating strong positive momentum in
the counter for all major time frames. On Bollinger bands, the weekly chart stock has tested the upper bands and the bands show expansion indicating positive momentum.
At the current levels, the stock has given an excellent opportunity for medium to long-term investors to accumulate the stock on dips around 195-200 levels for the potential
upside targets of 250-263 levels over the next 6-9 months, keeping a stop loss below 160 levels.

KSTREET - 22ND DECEMBER 2018                                                                                                                                                5
EQUITY

                                                                        SECTORAL SNIPPETS

 NIFTY FINSE (11,439.05) outperformed Nifty and closed the week with a positive               NIFTY BANK (26,869.65) outperformed Nifty with a gain of 0.16% during the week
 return of 1%., whereas, Nifty closed the week with a negative return of around 0.45%.        passed by while the broader index Nifty lost by 0.48%. During the week, the index
 The index has seen strong move and after making swing low of around 10,838 levels.           took resistance at 27,370 levels after surpassing the previous swing high at 27,037
 The index has bounced after finding support around 200 DEMA on daily charts.                 levels. However, on the last trading day of the week, it fell below the mentioned levels
 The bounce in the index from the low of 10,029 levels has seen making higher high            indicating 27,200 surround zone as a strong resistance to the index. Considering
 and higher low, which indicates strength in the index. Most of the stocks from               the technical setup on the daily charts, the index may trade with a positive bias in
 the financial space were seen trading comfortably last week. The index is trading            the short term ahead until unless 26,400 levels are breached. On the stock front,
 above all its major moving averages on daily charts indicates strength in the index.         IDFCBANK, PNB and BANKBARODA gained by 9.96% to 3.28% during the week. On
 The immediate support in the index comes around 11290 levels and below that at               the other side, RBLBANK and KOTAKBANK lost by 2.23% respectively with respect
 11050 levels. The index may find resistance around 11650 levels and above that are           to the weekly closing basis. Technically, Bank Nifty may face crucial resistance at
 11750 levels. Most of the stocks from the sector have closed the week in green.              27,050 and 27,370 levels. For the week ahead, support for the index can be pegged
 BAJFINANCE, BAJAJFINSV, EDELWEISS, IBULHSGFIN, ICICIPRULI and PFC have                       at 27,750 levels followed by 26,380 levels. On the momentum setup, 60-period
 closed the week with a positive return of around 4.05%, 2.89%, 5.36%, 3.20%, 4.86%           weekly CCI is plotting above its +100 line indicating an underlying bullishness in the
 and 8.32% respectively. Whereas, the stocks like BHARATFIN and HDFC have closed              index. However, we may expect a subdued movement in the index if it falls below
 the week in red and generated a negative return of 1.83% and 2.07%. The index is             the 26,400 levels.
 expected to trade with positive to sideways tone for the coming week.

 NIFTY AUTO (9337.25) ended the week with marginal gains of around 0.50% concluding           NIFTY METAL (3162.30) index ended the week with a gain of more than 1.5%
 around 9300 levels. The index has broken the major resistance levels of 9250-9300            and had formed a DOJI pattern (OPEN = CLOSE) on weekly charts, indicating
 level last week and is trading well above the major short-term moving averages on            participants are indecisive on the sector. Currently, the index is placed around
 the daily charts. On the other hand, the index had reversed gains in the last trade and      its short-term moving averages, where its 21 days moving average is providing
 is currently trading near the previous breakout levels of 9300. The current structure of     support, while its 50 days moving averages is acting as a resistance. The index has
 the index looks sideways in all the time frames with crucial support placed around 9150      gapped up on 17th of this month and is still holding despite the selloff in the broader
 levels which is pegged above the 20 day-EMA coupled with a unfilled gap on the daily         market, indicating some outperformance in the counter. Over last one week, the
 charts. Technically, the index has witnessed a strong rally from 8700 level to 9500 level    index is placed in a tight range of 3100-3230 levels and on breach of the same, shall
 on daily charts in the past couple of weeks and is currently under the profit booking        trigger next major move in the counter. On going into the internals, the breadth of
 zone. The index is now well poised to move towards 9200 level on the lower side and          the index is strong, with 10 stocks ending in green for the week, and rest 5 stocks
 form the bottom around the same for the near term. On oscillator front, the 14-period        ended in red. Leading the laggard board, APLAPOLLO and Welcorp have lost more
 RSI is trading around 50-55 and is poised with strong bias after the recent run-up in the    than 9% and 5% respectively, while Hind copper, JSW Steel gained more than 5%.
                                                                                              Technically, immediate supports for the NIFTY METAL index are pegged around
 index price. Going forward, the supports for the index are placed around 9100-9150
                                                                                              3100-3120 followed by 3000-3030. Whereas on the upside, immediate resistances
 levels followed by 9000 levels. Whereas on the upside, resistance is placed around 9400
                                                                                              are pegged around 3225-3250 followed by 3300-3325. Going forward, we expect
 levels followed by 9500 levels. For the near term, index is expected to consolidate in the
                                                                                              the index to trade sideways in the range of 3100 to 3250 with a positive bias.
 range of 9100-9400 levels with bullish bias coupled with stock specific action among the
 individual index stocks. TVSMOTOR & ESCORTS are expected to outperform its peers in
 the near term after the recent positive move in the stocks.

BAJAJ FINANCE LTD: BUY BAJFINANCE (JAN FUTURE) | CMP: 2602.30                                                                                                  SECTOR: BFSI

 BAJFINANCE managed to close with gains of more than 4%, whereas NIFTY                                                                                Sentiment
 Financial Services Index closed with gains of 1% on a weekly closing basis,
 exhibiting outperformance of the stock in comparison to the benchmark.
 After placing a swing low of 2332 in the previous week, the stock witnessed                                                                          Stop Loss                  2450
 a gradual recovery in last few trading sessions. The stock price consolidated
                                                                                                                                                      Target                      2750
 above its 21 & 50-DEMA which is currently placed near 2487 & 2441
 respectively, while holding well above its long term 200-DEMA (2274). On the                                                                         Lot Size                     250
 momentum setup, 14-period weekly RSI has witnessed a positive crossover
 of its 9-pd signal line above the equilibrium level, exhibits strength in the                                                                        Margin                    114200
 counter and momentum may accelerate further in sessions to come. Prices                                                                              21-DEMA                     2487
 managed to sustain above its middle the Bollinger Band (20,2) in the last
 couple of sessions. Hence, we recommend Smart Trader to initiate a Long                                                                              Open Interest Shares    6062250
 position on dips near 2570 levels for the higher target of 2750, keeping a stop
                                                                                                                                                      Change in OI            -282750
 loss below 2450 levels.
                                                                                                                                                      Cost of Carry (%)           -2.23

 ZEE ENTERTAINMENT ENTERPRISES LIMITED: SELL ZEEL (JAN FUTURE) | CMP: 451.15                                                                                   SECTOR: MEDIA

 ZEEL closed the week with a negative return of more than 8% and
 underperformed its benchmark index NIFTYMEDIA during the last week.                                                                                  Sentiment
 Adding to that, the stock is trading below its major moving averages on the
 daily chart, exhibiting underlying weakness in the stock. On the technical
                                                                                                                                                      Stop Loss                    481
 indicator front, the 14-period RSI is trading below its 9-day signal line and
 poised with weak bias, indicating downtrend in the counter in the near term.                                                                         Target                       424
 The Parabolic SAR (Stop & Reverse) on the daily chart is trading above the
                                                                                                                                                      Lot Size                    1300
 price on the daily chart, indicating weakness is likely to continue in the stock.
 The derivatives data suggests that the stock has witnessed closer of long                                                                            Margin                   102200
 positions during the last trading session, re-confirming our bearish view.
                                                                                                                                                      21-DEMA                      470
 From the above observation of price momentum, it seems the stock is likely
 to trade with negative bias in the coming trading sessions also. Therefore, we                                                                       Open Interest Shares   14183000
 recommend Smart Traders to initiate a short position in the counter around
                                                                                                                                                      Change in OI            2455700
 458 levels with a stop loss placed above 481 levels for the lower target of
 424 levels.                                                                                                                                          Cost of Carry (%)          16.98

KSTREET - 22ND DECEMBER 2018                                                                                                                                                      6
DERIVATIVES

                                                              WEEKLY VIEW OF THE MARKET

NIFTY (10,754): Nifty after making a swing high at 10985 levels witnessed a sharp fall towards 10,738 levels and closed with a weekly loss of 0.48%. The index erased all the
gains on the last trading day to close at 10,754 levels due to the selloff in global markets after the US Federal Reserve raised interest rates and signaled more rate hikes. Market
participants might also have acted cautiously as the government might announce populist measures to woo voters ahead of 2019 general elections which may lead to fiscal
slippage. The downside occurred after the index witnessed the swing resistance at 10,985 levels. In the current scenario, 10,935-10,985 zone may act as hurdle zone which is
in confluence with prior swing highs and 50% Fibonacci retracement for the down move of 11,760 levels to the major swing low of 10,030 levels. This indicates that the above
resistance zone might act as strong resistance in the short run ahead. The current weakness in Nifty may suggest that the weakness in the index is likely to persist for some
more days ahead unless the resistance at 10,985 levels is confidently taken out from the downside. For the week ahead to note, as global markets remain closed for most of
the weekend, we may notice lackluster volumes during the week. However, market participants may lay their eyes keenly on the ongoing parliament sessions for any major
cues ahead of the general elections. On the derivatives front, open interest data suggests that the index may trade in the range of 10,500 to 11,000 levels during the week as
the index witnessed highest OI addition at these levels.

                                                                     DERIVATIVE STRATEGIES

       Type:            Bear Put Spread in NIFTY

       First leg        Buy one lot of NIFTY JAN 10700 PE @ 185

       Second leg       Sell one lot of NIFTY JAN 10500 PE @ 110

       Max Profit       9,375

       BEP              10625

       Max Loss         5,625

       Stop loss        10850 (Spot levels)

       Rationale        The index is expected to drift further lower towards 10,550-10,600 in the coming week till it fails to surpass 10,800 levels decisively on the higher side.

       Type:            Protective Call in BANKNIFTY (DEC Expiry)

       First leg        Sell one lot of BANKNIFTY DEC FUT @ 26950

       Second leg       Buy one lot of BANKNIFTY 27DEC 27000 CE @ 160

       BEP              26790

       Max Profit       Unlimited Beyond BEP

       Max Loss         4,200

       Stop loss        27200 (Spot levels)

       Rationale        The index is expected to trade with a bearish bias and may test 26,400-26,500 levels in the near term period.

       Type:            BULL CALL RATIO in TATAGLOBAL

       First leg        Buy ONE lot of TATAGLOBAL 27 Dec 215 CE @ 3.85

       Second leg       Sell TWO lot of TATAGLOBAL 27 Dec 225 CE @ 1.10

       BEP              UBEP : 233 and LBEP 215

       Max Profit       18788

       Max Loss         3713 Below 215, Unlimited above 233

       Rationale        The stock has given a breakout from a small trading range and the volumes and derivative action on the stock are also notable. The stock has closed above its short
                        term moving averages. Hence, bullish view for near term.

       Type:            BEAR PUT in UPL

       First leg        Buy one lot of UPL 27 DEC 740 PE @ 15

       Second leg       Sell one lot of UPL 27 DEC 700 PE @ 4

       BEP              728.00

       Max Profit       33600

       Max Loss         14400

       Rationale        The stock has ended the week with a cut of around 5% and the volumes on the decline are huge with strong derivative action tilted towards short built up. Hence,
                        bearish view for near term.

KSTREET - 22ND DECEMBER 2018                                                                                                                                                                  7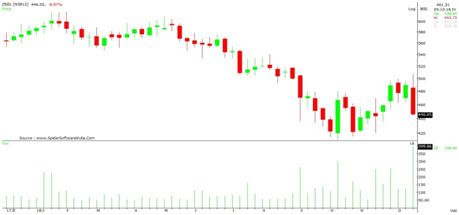
DERIVATIVES

               NIFTY OPTION OI CONCENTRATION                                           CHANGE IN NIFTY OPTION OI

       BANKNIFTY OPTION OI CONCENTRATION (WEEKLY)                               CHANGE IN BANKNIFTY OPTION OI (WEEKLY)

                FII ACTIVITY IN INDEX FUTURES                                        FII ACTIVITY IN STOCK FUTURES

                         TOP 6 LONG BUILD UP                                               TOP 6 SHORT CLOSURE

 Stock Name       LTP        % Price Change   Open Int   % OI Change   Stock Name       LTP         % Price Change   Open Int   % OI Change

   UJJIVAN       276.05          14.35        5140800       54.55         OIL           177.1            0.48        9211290      -30.30

    MRPL          74.7            2.40        6315500       48.55         NTPC         150.55            4.91        52176000     -28.82

 CHENNPETRO      279.95           0.63        1145100       36.52      COALINDIA       252.75            2.27        33954800      -21.27

    ALBK         46.65            0.21        22472000      33.03        ONGC          148.5             1.12        63731250      -18.47

  SREINFRA       34.65            6.62        15413000      30.94      RELCAPITAL      219.5             0.11        11944500     -16.60

  DCBBANK         165             1.88        5044500       30.35      TVSMOTOR        572.9             0.51        6396000       -15.66

                     TOP 6 SHORT BUILD UP                                                       TOP 6 LONG CLOSURE

 Stock Name       LTP        % Price Change   Open Int   % OI Change   Stock Name       LTP         % Price Change   Open Int   % OI Change

    CESC         689.35           -1.36       1758900       56.53         IOC          139.75            -1.06       73780000      -19.72

 ADANIPORTS       361.1          -2.03        24307500      29.93      JETAIRWAYS      252.65           -2.79        5718400       -13.03

  BALKRISIND     928.8           -0.80        3005600       28.89      ULTRACEMCO      3984.3           -0.52        1875400       -8.49

 NATIONALUM       62.2           -3.04        32880000      28.44        CANBK         265.5            -0.36        11616000      -7.65

 GODFRYPHLP      849.45          -8.26         568400       25.12        VOLTAS        569.95            -1.52       6552000       -5.43

  CHOLAFIN       1223.1          -0.52        1198000       21.56       BRITANNIA      3119.8            -0.51       2754800       -3.53

KSTREET - 22ND DECEMBER 2018                                                                                                                8
COMMODITIES
BULLION The average yield for cotton in India during year 2018-19 is estimated at 502 kg/hec.
against the 506 kg/hec. of the prior year. Cotton Association of India estimated total
Global bullion market witnessed volatile movement during the week ended on 21st cotton production for year 2018-19 at 343.25 Lakh bales, lower by 1.4% compared to
December 2018. In the first part of the week, comex gold futures were in the range- previous year. Ministry of Agriculture projected cotton production for year 2018-19
bound ahead of the US Federal Reserve policy meet, wherein it was expected that at 324.83 Lakh bales in its first advance estimates against the 348.88 Lakh bales of
Fed would raise the interest rate for the fourth time and same was done. However, prior year, lower by 7% YoY.
the focus of the market was its stance on interest rate hikes in the year 2019. Against
the expectation of three hikes in the year 2019, FOMC indicated for two hikes only.
Soon after this, comex gold futures staged a strong rally breaking long-term resistance
OILS & OILSEEDS
of $1255 per troy ounce and made 6 month high of $1270.30 per troy ounce. Apart Soybean futures could keep its down in upcoming week too due to higher
from FOMC rate decision, one more important event was final GDP numbers, which production outlook for year 2018-19. Meanwhile, limited buying at physical market
came at 3.4% for the third quarter against preliminary estimates of 3.5%. The bullion due to tumbling crush margin to millers could be other factor which may keep
market trend on Indian bourses was utterly different. MCX gold and silver futures failed prices under pressure. Soybean Processors Association of India (SOPA) estimated
to move in line with the international market because of volatility in the Indian Rupee soybean production for year 2018-19 at 114.8 lakh tons against the 83.5 lakh tons
against US Dollar. of prior year. Similarly, RM Seed futures are expected to trade on weaker note due
to higher production outlook for upcoming season reports of increased acreages
ENERGY COMPLEX under mustard seed could keep prices under pressure. The area under mustard
seed cultivation has touched 64.71 Lakh hectares as against 63.05 Lakh hec till 21st
Crude oil prices witnessed a major fall of more than 10% in the global market, December, higher by 4.29% YoY. However, expectation of rise in export demand of
wherein the Brent and WTI both fell by 11% and prices at MCX futures platform mustard seed oil cake from China could restrict major downfall. China has lifted the
perished by 12%. The crude oil prices fell in the week after China reported slower ban on the import of mustard seed cake from India. Similarly, Soy ref oil prices could
economic growth, pointing to lower fuel demand in the world’s biggest oil importer, slip further due to sluggish demand outlook. Strengthening of Indian currency could
although supply cuts little-supported market sentiment agreed last week by major impact the overall import in coming month keeping its cheaper. Likewise MCX CPO
crude producers. In a monthly report, the Organization of the Petroleum Exporting futures could trade down in expectation of rise in import in coming months. Exports
Countries said 2019 demand for its crude would fall to 31.44 million barrels per day, of Malaysian palm oil products for December 1 - 15 fell 4.7% to 525,939 tons from
100,000 bpd less than predicted last month and 1.53 million less than it currently 551,857 tons shipped during November 1 - 15 as per cargo surveyor Intertek Testing
produces. Separately, Russian oil output has been at a record high of 11.42 million Services. India’s veg oil imports in November fell 10% to 1.1 million tons from a year
barrels per day (bpd) in December so far which is above the previous average ago, a trade body said on Thursday. The country’s imports of palm oil in November
monthly record of 11.41 million bpd, reached in October, which is the baseline for stood at 691,827 tons, while soy oil imports were 203,734 tons, the Solvent Extractors’
the new agreement between the Organization of the Petroleum Exporting Countries Association of India said in a statement. Malaysia’s palm oil stockpiles at the end
and other leading oil producers to cut output. As per EIA reports of last week, US of Nov rose by 10.45% MOM to 3.007 million tons wherein export for Nov month
crude oil refinery inputs averaged 17.4 million barrels per day during the week ending dropped by 12.87% to 1.37 million tons as per latest data released by Malaysian Palm
7th December 2018, which was 51,000 barrels per day less than the previous week’s Oil Board (MPOB). However, production tumbled by 5.64% MoM to 953,750 tons as
average. Refineries operated at 95.1% of their operable capacity last week. Gasoline per MPOB.
production increased last week, averaging 10.5 million barrels per day. Distillate fuel
production decreased last week, averaging 5.5 million barrels per day. The crude
oil prices had recently entered an oversold zone where the prices might find some
SPICES
support but the negative optimism is likely to prevail in the market building up the Cardamom futures traded sideways to positive; prices traded lower early during
selling pressure on higher recovered levels. the week due to extended profit booking from an almost 2-year high of Rs.1559.5/
kg last week. Expectations of normal rainfall due to the cyclone in growing regions
BASE METALS may improve crop for next round of harvesting as well as tracking limited buying
activities at the spot market weighed prices. For the week ahead, cardamom futures
Base Metals took up the bearish trend in the week ended on 21st December after are likely to trade in a broader range of Rs.1500-1570/kg, tracking overall positive
Indian Rupee strengthened on Tuesday and Wednesday session. On the following factors in terms of lower crop size. Turmeric futures lost most of the prior week
session, the Fed interest rate hike for the fourth straight time during the year 2018 sharp gains on profit booking; prices had rallied tracking crop concerns reports from
made the metals costlier to other currency holders, and thus metals picked up various growing regions due to drought conditions in Maharashtra and crop damage
the negative trend but capped on the lower side as Indian Rupee recovered. LME in Telangana and Andhra Pradesh due to the cyclone. Further, new crop harvesting
Aluminium which was holding the key support level of $1920 suddenly fell to a 16 has begun in few regions; supplies may after Sankranthi at the spot market. We
month low of $1905.50 per ton as the postponed sanctions on Russian Rusal by recommend buying from lower levels for the week. Jeera futures continued their
US had been proposed to lift by treasury department and yet to be finalized by U.S bear trend as prices fell for the seventh week in a row losing over 17%; improvement
Congress. Globally, refined production has increased by 1% during the first nine in the sowing progress and limited demand weighed down the prices. Progress of
months of 2018. The main contributor to growth in was China due to its continued the sowing activities that was slow during the start picked up pace after the supply
expansion of capacity. Production in Chile was up by 3.5% mainly supported by a of water resources, currently area in Gujarat is at 306389 hec, lower by 12% YOY
9% increase in primary electrolytic production as output was constrained in the while it is covered 96% of the normal area. We expect jeera futures to trade higher
comparative period of 2017 due to a series of smelter maintenance shutdowns. With initially during the upcoming week on profit booking before resuming negative
the coming week having a couple of closing sessions at LME on account of Christmas trade. Dhaniya futures noted sharp loss during the week on profit booking from
and Boxing day, markets shall witness huge volatility in their prices. Also, the coming higher levels. However, a major loss was capped on expectations of the lower area
sessions which lead to the closure of contracts, prices shall take a downtrend with under dhaniya as farmers are shifting to another crop such as wheat and chana for
a little positivity in the middle of the week, but end the month on a negative note guaranteed prices. Progress is very slow in the major growing states; as per latest
without much regain. data, sowing in Gujarat is completed in only 28416 hec of land which was 67510 hec
last year during the corresponding period; the area is lower by 58% YOY while it is
COTTON covered just 30% of the normal area. Dhaniya prices are expected to resume uptick
MCX Cotton futures are expected to trade on bearish note in the upcoming week during the week.
could track weaker global cues. ICE cotton could slip further on growing worries over
the tepid export enquires from China. Lack of demand for cotton has disappointed US
traders as they are going form distress selling. Meanwhile, USDA announced special
import quota of 56650 bales of upland cotton effecting from 27th Dec. Moreover,
prices are likely to be weighed down by surging selling pressure at a physical market
in line improved arrivals at key trading centers. Domestic demand has been subdued
in recent time due to sluggish export of yarn wherein daily arrivals have improved
up to 1.75 - 1.8 Lakh bales. Spot prices are ruling near Rs. 43800 -44000 per candy
levels at Rajkot market. Further, bleak export prospects supported by strength
in Indian currency against US dollar could be another factor which may weigh on
prices. The Indian rupee appreciated further was ruling below to 70.0 level marks at
69.70 against US dollar last week. However, prices could bounce back any time due
to the weaker production outlook for year 2017-18. Lower yield realization in central
and southern region affected the pace of arrivals adversely in the coming weeks.
KSTREET - 22ND DECEMBER 2018 9COMMODITIES
TREND SHEET
% Change from 52 % Change from 52
Commodities 14-Dec 21-Dec % Change 52 Week High 52 Week Low
Week High Week Low
MCX Gold (Rs/10 gms) 31553.00 31193.00 -1.1% 32311.00 -3.46% 28433.00 9.71%
MCX Silver (Rs/Kg) 38054.00 37256.00 -2.1% 41698.00 -10.65% 34981.00 6.50%
MCX Crude Oil (Rs/bbl) 3690.00 3236.00 -12.3% 5669.00 -42.92% 3186.00 1.57%
MCX Natural Gas (Rs/mmBtu) 276.10 265.40 -3.9% 358.70 -26.01% 162.50 63.32%
MCX Copper (Rs/kg) 441.70 417.35 -5.5% 493.25 -15.39% 402.55 3.68%
MCX Lead (Rs/kg) 140.30 137.85 -1.7% 172.50 -20.09% 133.15 3.53%
MCX Zinc (Rs/kg) 183.40 177.35 -3.3% 232.70 -23.79% 163.80 8.27%
MCX Nickel (Rs/kg) 790.90 758.90 -4.0% 1095.20 -30.71% 750.60 1.11%
MCX Aluminium (Rs/kg) 137.60 133.85 -2.7% 178.85 -25.16% 128.30 4.33%
NCDEX Soybean (Rs/Quintal) 3372.00 3343.00 -0.9% 3895.00 -14.17% 3047.00 9.71%
NCDEX Refined Soy Oil (Rs/10 kg) 740.80 726.05 -2.0% 796.35 -8.83% 712.50 1.90%
NCDEX RM Seed (Rs/Quintal) 4085.00 3983.00 -2.5% 4262.00 -6.55% 3727.00 6.87%
MCX CPO (Rs/10 kg) 506.50 511.90 1.1% 673.00 -23.94% 483.40 5.90%
NCDEX Castor Seed (Rs/Quintal) 5380.00 5142.00 -4.4% 6300.00 -18.38% 3831.00 34.22%
NCDEX Turmeric (Rs/Quintal) 6294.00 6604.00 4.9% 8066.00 -18.13% 5978.00 10.47%
NCDEX Jeera (Rs/Quintal) 18320.00 17740.00 -3.2% 21900.00 -19.00% 14010.00 26.62%
NCDEX Dhaniya (Rs/Quintal) 6653.00 6340.00 -4.7% 6892.00 -8.01% 4186.00 51.46%
MCX Cardamom (Rs/kg) 1475.00 1526.60 3.5% 1550.00 -1.51% 818.50 86.51%
NCDEX Wheat (Rs/Quintal) 2118.00 2142.00 1.1% 2162.00 -0.93% 1614.00 32.71%
NCDEX Guar Seed (Rs/Quintal) 4377.00 4308.00 -1.6% 4869.50 -11.53% 3494.50 23.28%
NCDEX Guar Gum (Rs/Quintal) 8879.00 8594.00 -3.2% 10510.00 -18.23% 7200.00 19.36%
MCX Cotton (Rs/Bale) 21890.00 20770.00 -5.1% 24280.00 -14.46% 19400.00 7.06%
NCDEX Cocud (Rs/Quintal) 1910.00 1867.00 -2.3% 2043.00 -8.61% 1166.00 60.12%
NCDEX Kapas (Rs/20 kg) 868.00 868.00 0.0% 986.50 -12.01% 854.00 1.64%
MCX Mentha Oil (Rs/kg) 1491.70 1476.40 -1.0% 1846.10 -20.03% 1106.00 33.49%
TECHNICAL RECOMMENDATIONS
COPPER NICKEL ZINC
• LME Aluminium 3M forwards settled lower at $1907/Mt down by • LME copper 3M forwards settled lower at $5978/Mt, down by 2.65% • LME Zinc 3M forward has to settle lower $2589/Mt down by 1.07%,
0.73% from the previous week’s closing price of $1925. from the previous week’s closing price of $5978. from the previous week’s closing price of $2533.
• At present prices are trading below the monthly & weekly 8, 13 EMA • Prices are trading below the monthly & weekly 8, 13 EMA levels ($M • Prices have settled below the weekly 8, 13 EMA support levels
resistance levels (W$1950-1980 M&2120-2140). $6/6600 W $6130-6140).
($2545) and trading below the monthly 8,13 EMA ($2630.2740).
• Prices have breached previous low $1916 and also the long-term • The momentum indicator RSI -14 is trading around 36, which as a
rising trend line support levels around $1934 levels. potential to move lower. • Long-term falling trend line is providing resistance at $2620 levels.
• Now lower side support is seen around $1850-1855 levels which are • Prices have broken consolidation phase support levels around Lower side intermediate trend line is providing support at $2430,
the previous lows. $6030 levels. next support is seen around $2370 Previous lows.
• The momentum indicator RSI-14 is treading at 27 near to the • The commodity is finding crucial support zone around $5800-5780 • The weekly momentum indicator RSI-14 is treading at a neutral zone
oversold zone. Thus may not support to sustain below $1850 mark levels which is the previous lows, rising trend line and the Fibonacci of 41 which as a potential to fall further in the coming weeks.
on the immediate term. 50% retracement support levels of the range $7352-4366.
LME Zinc prices are expected to trade within a range of USD
• Overall in the bigger scenario bearish trend is in progress, expected • Overall bearish trend is in progress and expecting prices to extend
to extend the bearish rally up to $1850-1855. fall during the coming week. 2370-2630 on a negative bias. Long-term bearish trend is in
LME Aluminium, Long-term bearish trend is in progress, only a LME Copper prices are likely to trade on a negative note in progress, only a sustainable trade above 2630 may interrupt the
sustainable breach above $1980 may interrupt the trend. Lower the range of USD 5780 - 6180 on a bearish tone. MCX Feb-19 trend. MCX Jan 2019 futures are expected to trade in the range
side supports are seen at $1850-1855. MCX Jan Aluminium contract futures are expected to trade in a range of Rs 403-433 of Rs. 165-186 on downside bias.
futures are expected to trade within a range of Rs 130-138/Kg. with downside basis.
KSTREET - 22ND DECEMBER 2018 10COMMODITIES
NEWS DIGEST WEEKLY COMMENTARY
• Crude oil prices were trading higher on Friday after falling around 5% on • Oil prices fell again on Friday, ending with an 11% weekly loss, the largest in
Thursday; with OPEC production cuts that start next month seen being deeper nearly three years. Bears are closing in on what could be their ultimate prize
than previously expected. On the other hand, precious metals including gold and before the New Year, a test of the $40 support level. A surprise climb in the U.S.
silver were trading in red in the morning trade. rig count, showing a rise in drilling despite the bear market for oil, and a slump
• Turmeric futures (Apr) is expected to trade with a downside bias and test Rs on Wall Street on fears of a government shutdown, were all that was needed to
6600-6550 levels. Overall, the underlying sentiments are mostly bearish due to seal the fourth day of losses of out five in crude.
lack of sufficient demand. Adding to the woes would be the inflows of the new • Gold futures fell on Friday, pressured by strength in the U.S. dollar, which gained
crop in Nizamabad from mid-January which can further pressurize prices. as the U.S. stock market weakened on the back of worries about a partial
• Guar seed and Guar gum dropped also at major markets across Rajasthan due government shutdown. Prices, however, still gained about 1.4% for the week.
to lackluster demand from crushers amid sharp losses in prices on futures, February gold GCG9, -0.69% lost $9.80, or 0.8%, to settle at $1,258.10 an ounce,
tracking bearish crude oil. Demand for guar gum as a hydraulic fracturing agent pulling back from a 0.9% gain Thursday, when it settled at $1,267.90, a nearly six-
has dropped after crude oil prices started falling. month high, according to FactSet data.
• Base metal prices on the London Metal Exchange were mixed at the close of • Agri Commodities Index dipped 0.19% to 107.96 during the week ended
trading on Thursday, December 20, with a continued retreat in the United States December 15, 2018, from 108.16 the previous week as onion (down 10.8%) and
dollar index failing to spur upward price action amid broadly moderate volumes. potato (down 4.73%) extended their falling trend. Pulses and spices also fell
while maize, wheat and rubber gained.
• Raw sugar futures on ICE fell on Friday to their lowest since early October,
dragged down by weakness in crude oil and declining equities markets, while
coffee and cocoa prices also fell. March raw sugar settled down 0.09 cent, or
0.7%, at 12.34 cents per lb, after dipping to 12.23 cents, its lowest since Oct. 4.
The contract declined 2.5% on the week.
• Oil prices fell to their lowest since the third quarter of 2017 and headed for
weekly losses of more than 10% as global oversupply kept buyers away from the
market ahead of holidays. Lower energy prices diminish the competitiveness
of ethanol in Brazil, bolstering concerns that mills may switch more production
from the biofuel back to sugar. A decline in global equities markets linked to
concerns about economic growth also pressured commodity prices.
MCX CRUDE MCX NATURAL GAS
1.2 0
7-Dec
20-Dec
8-Dec
9-Dec
10-Dec
12-Dec
21-Dec
17-Dec
13-Dec
18-Dec
16-Dec
19-Dec
15-Dec
11-Dec
14-Dec
-0.02
1
-0.04
-0.06
0.8
-0.08
$/BBL
$/MMBtu
0.6 -0.1
-0.12
0.4
-0.14
0.2 -0.16
-0.18
0
-0.2
10-Dec 12-Dec 14-Dec 16-Dec 18-Dec 20-Dec
MCX CRUDE- PRICE, VOLUME & OPEN INTEREST MCX NATURAL GAS – PRICE, VOLUME & OPEN INTEREST
400000 3900
90000 340
350000 3850 80000 330
300000 3800 70000 320
250000 3750 60000 310
200000 3700 50000 300
40000 290
150000 3650
30000 280
100000 3600
20000 270
50000 3550
10000 260
0 3500
0 250
7-Dec
20-Dec
6-Dec
5-Dec
10-Dec
12-Dec
21-Dec
17-Dec
13-Dec
18-Dec
19-Dec
11-Dec
14-Dec
5-Dec 7-Dec 11-Dec 13-Dec 17-Dec 19-Dec 21-Dec
Volume Open Interest Price (INR/Bbl) Open Interest Volume Price (INR/MMBTU)
KSTREET - 22ND DECEMBER 2018 11COMMODITIES
SPOT PRICES (% CHANGE) WORLD BUREAU OF METAL STATISTICS
Turmeric 4.93%
Jan-Oct 2018 (in MT)
Barley 3.56%
Aluminium Production 49.2936
Cardamom 3.50%
Aluminium Consumption 49.54
Wheat 1.13%
CPO 1.07% Balance -0.2464
Soybean -0.86%
China production 27.714
Mentha Oil -1.03%
Gold
China net exports (unwrought) 0.309
-1.14%
Guar Seed -1.58% China net exports (Semis) 4.069
Lead -1.75%
Total reported stocks 2348
Soy Oil -1.99%
Silver -2.10%
Copper mine production 17.11
Cotton Seed Oil Cake -2.25% Refined Copper Production 19.56
RM Seed -2.50%
Refined Copper Consumption 19.48
Aluminum -2.73%
Jeera -3.17% Balance 0.080
Guar Gum -3.21%
China apparent consumption 10.269
Zinc -3.30%
EU demand 2.826
Natural Gas -3.88%
Nickel -4.05% Refined Lead Production 9.376
Castor Seed -4.42%
Refined Lead Consumption 9.654
Dhaniya -4.70%
Balance -0.278
Cotton -5.12%
Copper -5.51% China apparent consumption 4.023
Crude Oil -12.30%
Nickel mine Production 1.92
-15.00% -10.00% -5.00% 0.00% 5.00% 10.00%
Refined Nickel Production 1.70
Refined Nickel Consumption 1.71
Balance -0.01
WEEKLY STOCK POSITION IN LME (IN TONS)
Refined Zinc Production 11.29305
Refined Zinc Consumption 11.14675
SHANGHAI WAREHOUSE STOCKS (IN TONS)* Balance 0.1463
China apparent consumption 4.917
Commodity Previous week This week Change % Change
China apparent consumption 0.438
Copper 122222 110702 -11520 -9.43%
Zinc 24879 21520 -3359 -13.50%
Aluminium 688825 681045 -7780 -1.13%
COMEX WAREHOUSE STOCKS (IN TONS)
*Until Wednesday
Commodity Previous week This week Change % Change
LME WAREHOUSE STOCKS (IN TONS) Copper 120020 112369 -7651 -6.37%
Commodity Previous week This week Change % Change
Copper 121800 129725 7925 6.51% PRICES OF METALS IN LME/ COMEX/ NYMEX (IN US $)
Zinc 122400 130375 7975 6.52%
Commodity Exchange Contract 14-Dec 21-Dec % Change
Aluminium 1169625 1265250 95625 8.18%
Aluminium LME 3M 1925.50 1907.00 -0.96%
Lead 107200 107625 425 0.40%
Copper LME 3M 6140.50 5978.00 -2.65%
Nickel 209592 209052 -540 -0.26%
Lead LME 3M 1954.00 1961.50 0.38%
Nickel LME 3M 11040.00 10875.00 -1.49%
INTERNATIONAL COMMODITY PRICES
Zinc LME 3M 2533.00 2489.00 -1.74%
Commodity Exchange Contract 14-Dec 21-Dec % Change
Gold CME DEC 1238.10 1255.00 1.36%
Soybean CBOT NOV 926.25 909.50 -1.81%
Silver CME DEC 14.49 14.72 1.55%
Soy oil CBOT DEC 28.72 28.72 0.00%
WTI Crude oil CME OCT 51.23 45.42 -11.34%
CPO BMD DEC 2068.00 2156.00 4.26%
Cotton ICE DEC 74.90 74.90 0.00% Natural Gas CME OCT 3.79 3.67 -3.14%
KSTREET - 22ND DECEMBER 2018 12You can also read