Rural Development in Sabah - SLUSE
←
→
Page content transcription
If your browser does not render page correctly, please read the page content below
Rural Development in Sabah
     -a study of Natural Resource management and
   livelihood strategies in Kampung Sinulihan, Sook
                      sub-district

              SLUSE Field Report, December 2001

Authors
Peter Byrial Dalsgaard
-Geography and International Development Studies, Roskilde University Centre

Amos Gyau
-Institute of Economy and Natural Resources, The Royal Veteerinary and
Agricultural University

Anders Peter Hjort Hansen
-Biology, University of Copenhagen

Karin Thomsen
Anthropology, University of Copenhagen

Tutors
Dr. Ole Mertz, Institute of Geography, University of Copenhagen
Dr. Quentin Gausset, Institute of Anthropology, University of Copenhagen
Tina Svan Hansen, Institute of Geography, University of Copenhagen
1. Introduction ................................................................................................... 2
1.1 Study area................................................................................................................ 4
1.2 Agricultural development and natural resource management in Sabah........... 5
1.3 The Malaysian Vision 2020 .................................................................................... 6
2. Methodologies............................................................................................... 7
2.1 Collaboration with Malaysian counterparts ........................................................ 8
2.2 Working with translators....................................................................................... 8
2.3 Questionnaire .......................................................................................................... 9
2.4 Semi-structured interviews .................................................................................. 10
2.5 Participant observation ........................................................................................ 12
2.6 Field observation................................................................................................... 13
2.7 Mapping/GPS ........................................................................................................ 13
2. 8 Natural Scientific Methods ................................................................................. 14
2.9 Soil and Field Analysis ......................................................................................... 15
2.10 Crop sampling and analysis ............................................................................... 15
2.11 Water Quality...................................................................................................... 16
3. Results: Analysis and discussion ................................................................ 17
3.1 Health status.......................................................................................................... 17
3.2 Education............................................................................................................... 19
3.3 Economic aspects .................................................................................................. 20
3.4 Farming practices and soil analysis .................................................................... 22
3.5 Agricultural Practices in Sinulihan..................................................................... 25
3.6 The Fields............................................................................................................... 25
3.7 Governmental assistance and subsidy................................................................. 26
3.8 Agriculture and water quality ............................................................................. 26
3.9 Institutional and organizational framework in the village ............................... 27
3.9.1 JKKK – objectives and functions ............................................................................................... 27
3.9.2 JKKK – government funding ..................................................................................................... 28
3.9.3 KPPP/K3P .................................................................................................................................. 30
3.9.4 Vision 2020 village program ...................................................................................................... 30
3.10 Attitude towards development........................................................................... 31
3.10.1 Land use in accordance with government-planning ................................................................. 31
3.10.2 Hard working immigrants......................................................................................................... 32
4. Concluding remarks .................................................................................... 33
5. List of references ......................................................................................... 35
11. Introduction
Since the end of the 1950’s when Malaysia obtained independence, the country has
experienced considerable economic growth and development. This has had profound
consequences for the natural environment, not least in Sabah, one of the Eastern Malaysian
states: Due to an increase in the logging industry as well as an expansion of agricultural
activities – both shifting and settled cultivation – more than half of the original forest-cover
in Sabah is estimated to have been removed (Sutton & McMorrow, 1998). These land use
changes involve corresponding crucial changes of the livelihood strategies of the Sabahan
people who are still by majority residing in rural areas.
The development of the agricultural sector and the rural areas, which is of primary
importance to this report, has been an integrated part of the Malaysian government-policies
for economic growth. Besides implementing large scale settlement schemes the aim of the
authorities has been to modernize farming techniques and cropping patterns among small-
holders (Sutton & McMorrow 1998, Brookfield et al. 1995).
By looking into the natural resource management and livelihood strategies of a farming-
village the report will highlight which factors influence successful rural development.
Dahlan (1991:51-52) states that rural development is generally considered to mean a
greater involvement of the rural sector into the market economy, nationally as well as
globally: The agrarian societies are to a higher degree to be interlinked with the
surrounding society, e.g. the urban economy. More specifically rural development aims for
farmers to become more productive, to grow cash crops and to rely on off-farm activities
as an important source of income. According to Dahlan this integration of the farming
societies into the national economy should enable them to prosper. Likewise Schutz (1964)
uses the relative contribution of the various sectors of a national economy to measure a
country’s developmental stage, and he characterises a move from subsistence farming
towards commercial farming, industrialization and finally a service-oriented economy as a
sign of positive growth.
The research that the report bases its arguments on has been carried out in October 2001 in
Kampung Sinulihan, a Dusun village located in the Sook area of Sabah. The main source
of income of the village is agriculture, where cash-cropping seems to have a growing
importance. Off-farm activities are also gradually becoming more important to the village-
economy. Sinulihan is considered to be one of the most dynamic and developed villages in
2the Sook area. Furthermore the village enjoys a high level of organization and it is chosen
as a model village of the Malaysian Vision 2020. Located close to Sinulihan, and
investigated by another SLUSE-group, is the village of Pauh which is considered to be
poorer and less developed.
These two villages exemplify the fact that the governmental strategies for modernization
and development of the agricultural sector have been received differently among the
farming communities of Sabah. To investigate why these differences appear, this report
will seek to answer,
which factors constrain and which facilitate rural development?
Supported by Degnbol-Martinussen & Engberg-Pedersen (2001), it will be argued that
factors of highest importance are the level of organization and representation of institutions
in the local rural community, including the presence of a dynamic and pro-development
attitude among the people.
In order to answer this question on the basis of our locally founded research data, we will
present our findings on the natural resource management and livelihood strategies of the
people of Kampung Sinulihan in relation to a set of criteria. These criteria are selected
because we find them to represent determining factors in rural development, and they will
therefore function as our guideline for data-analysis.
The criteria are as follows:
• Health status
• Education
• Economic aspects
• Farming practices and access to resources
• Institutional and organizational framework in the village
• Attitude towards development
When analysing our data from Kampung Sinulihan we will compare our findings to those
of the study carried out in the nearby Kampung Pauh. Through comparison in relation to
the selected criteria we will seek to give possible explanations for the differences between
the two villages and the consequences of the differences. This will enable us to understand
what determines the present situation in Sinulihan; which prevailing conditions facilitate
3the village’s level of development as opposed to those corresponding factors that seem to
be limiting development in Pauh.
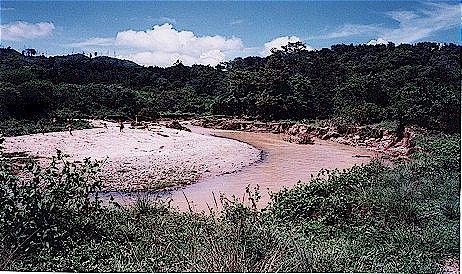
1.1 Study area
Kampung Sinulihan is located on the Sook Plain, in the Sook sub-district, which is situated
in the South Western interior part of Sabah. The climate of the area is humid-tropical and
its natural vegetation is tropical rain forest. However not much of this original vegetation
remains since a large part of the land has been cleared for farming and logging.
The Sinulihan community was established 30 years ago when a group of people from the
Tuaran district migrated to the Sook area in search for new fertile land. They cleared a
forested area which they have recently applied for land-title to. Their applications are
currently in the process of being surveyed. Currently, the village consists of 49 households
and 351 inhabitants. This census does not include the neighbouring settlements of Baru
Jumpa and Tebobon, but when counted together – as is normally the case for official,
administrative purposes – the three settlements consist of around 80 households and 650
inhabitants. The typical household of Sinulihan comprises two adults and 6 to 8 children.
The main crops grown are hill rice, oil palm, rubber, yam and a variety of vegetables and
fruits. Yam is the major cash crop and hill-rice the most important crop for subsistence-
use. The village has three grocery shops and off-farm activities are generally increasing
4their importance as a source of income generation. A primary school is located in the
village.
As already mentioned Sinulihan is a well organized community that hosts a number of
different institutions. As a model village of the Malaysian Vision 2020-program it is
considered – and considers itself – a progressive and dynamic society. In this respect it
stands in clear contrast to the neighbouring village of Pauh which is generally conceived of
as one of the poorest communities in the Sook sub-district. In this neighbouring village,
situated 5 km upstream of Sinulihan, the majority of the 30 households, comprising around
300 people, rely on subsistence farming of wet rice.
Whereas the population of the Sook area is traditionally Murut (as in Pauh) the people of
Sinulihan are Dusun. The Dusun-term means ”people who are traditionally farmers” (Regis
1989:415) and was given to this group in colonial times by newcomers to the area. They
are now also called Kadazan-Dusun. The Dusun are described by Appel and Harrison
(1969) as being a culturally heterogenous population group, and apart from their farming
traditions the different Dusun groups have only their related languages in common.
The majority of the native peoples of Sabah have converted to either Islam or Christianity.
The Dusun people of Sinulihan are Muslims while the Murut people of neighbouring Pauh
are Christians.
In Sinulihan, Islamic practices seem to be interwoven with the traditional Dusun practices:
The traditional harvest festival is preserved, but also a village mosque has been built and
Islamic prayers are carried out on an every day basis as well as during ceremonial
gatherings in the village. Furthermore alcoholic drinks and eating of porc are prohibited.
1.2 Agricultural development and natural resource management in Sabah
Malaysia has experienced a uniquely rapid development in its land use and agricultural
sector since the 1950s and this has led to radical changes in the physical environment (Sani
1987). Peninsula Malaysia has been subjected to profound intensification in its agriculture
resulting in the conversion of natural forests mainly into rubber and oil palm plantations.
This has together with urban and infrastructural development led to rapid deforestation and
thus profound changes in the environment (Barraclough & Ghimire 2000).
The trend has been somewhat similar in Sabah but on a smaller scale. Between 1973 and
1983, though, the area of undisturbed forest was halved in the region (Sutton &
5McMorrow1998) Logging, mining and rampant bush fires have been the main factors in
the deforestation process.
The agricultural sector has accordingly expanded tremendously in terms of both small-
scale subsistence farming and estate-type plantations. In this context, it has been a
consistent policy of the respective regional and federal authorities to promote a broad-
based commercial agricultural sector increasingly relying on intensive cash-cropping
systems. Sabah has thus seen an introduction and spread of new crops like cocoa, coconut,
rubber and oil palm; the latter currently being the most important economically and in
acreage.
The strategy for modernisation of Sabah’s agricultural sector has involved the foundation
of large settlement schemes in an attempt to increase rural development and crop
diversification (Sutton & McMorrow1998) – the Sabah Rubber Fund and the Federal Land
Development Authority being the main implementing agencies. Another part of the
strategy has been to improve the existing small-scale farming sector by introducing new
cash-crops and providing training, seedlings, fertilizers etc on the village level – the main
agencies involved are the Department of Agriculture and the Rural Development
Corporation (KPD). The resettlement schemes have now generally been halted whereas the
local level development schemes are still being actively used.
In conjunction with the Vision 2020 strategy, the state of Sabah have put forward a new
proposal for further development of the agricultural sector – the end result being a fully
developed intensive and commercial farming sector (Second Sabah agricultural policy,
1999-2010). This is to be achieved through strategies for optimal utilization of agricultural
resources and promotion of agro-based industries, research and efficient marketing
systems. Interestingly, sustainable development is also an integrated part of the policy.
1.3 The Malaysian Vision 2020
Malaysia is recognized as a middle income country. For many years, the country has
experienced rapid economic growth and development and has been characterized by a low
inflationary rate, almost full employment and high national savings; e.g. the annual
average growth rate from 1990 to 1997 was 8%. The per capita GDP (2000) is estimated at
3200 US$ and this is reflected in the quality of life index which has shown a positive
6development between 1980 and 2000. Within this period, incidence of poverty has been
reduced from 32% in 1980 to about 5% in the year 2000 (Danced 2001).
The Vision 2020 is the overall national development strategy for Malaysia. The major
objective of this strategy which is part of the ”New Development Policy” is to turn
Malaysia into a fully developed country by the year 2020 (Brookfield et al. 1995:49).
Economic growth is emphasized as the main parameter for the success of the development
plan but also political, cultural and psychological dimensions are important aspects
according to the speech ”Vision 2020. The Way Forward”, held by the Malaysian Prime
Minister. Moreover the vision-plan, which is similarly found in other newly industrialized
countires, acknowledges the preservation of natural resources and the need for
”environmentally sustainable development” as a condition for long term growth (Danced
2001:8).
Among other keywords in the visionary plan are concepts like industrialisation,
liberalisation of the economy, urbanisation, modernity, capitalism etc. The plan was
presented in 1991 and nine challenges were listed which must be adressed and if resolved
will bring a ”…united, psychologically liberated, democratic, moral and ethical, liberal and
tolerant, scientific, caring, economically just and prosperous society.” (Johari 1992: 354).
The nine challenges incorporate mainly three topics; nationbuilding, industrialisation and
economic growth. In order to achieve the economic objectives of the plan, Malaysia must
have an anual real growth rate of at least 7% starting from 1990. At this rate Malaysia’s
GDP in 2020 should have expanded at least eight times of the nation’s GDP in 1991.
Kampung Sinulihan has been chosen as a model village of the ”Garakan Desa Wawasan”,
the vision village program – a selection this report will investigate further.
2. Methodologies
As stated in our synopsis, the overall assignment of our study was to assess the natural
resource management and livelihood strategies in Sinulihan. Our more specific objectives
aimed to survey the human and physical environment and to investigate farming practices,
environmental issues and government support. Following these objectives, we decided to
use a range of research methods during our stay in Sinulihan. These were social scientific
as well as natural scientific methods, all chosen in co-operation with our Malaysian
7counterparts. To facilitate comparison between the conditions in the villages of Sinulihan
and Pauh an attempt was also made to harmonize our choice of methods with that of group
2. In this section we will briefly argue for choosing the methods and present our
experiences using them; what were the advantages and which problems we had when
carrying out the research. Also to be covered are the adjustments made to our
methodologies following our initial experiences in the field.
2.1 Collaboration with Malaysian counterparts
As this is an interdisciplinary project one of the major challenges is to cooperate among
different scientific disciplines. But SLUSE is also an internationally based study program
and therefore another great challenge is to cooperate with different nationalities. The fact
that we had to coordinate our synopsis and choice of methods with our Malaysian fellow
students meant that a lot of communication via e-mail took place before we actually met in
Sabah. This was both a source of useful information and frustrating misunderstandings but
most of all, a means of getting acqauinted with each other.
During our fieldwork we realized that different academic traditions meant that what
seemed to be a Danish preference for qualitative social scientific methods had to
compromise with a Malaysian preference for quantitative research-strategies. Furthermore
students of social science had to acknowledge the importance of data derived from natural
science and vice versa.
This meeting between different cultures – scientific as well as national – was a fruitful
experience and an exercise into the art of tolerance and compromise. In retrospect we can
say that we did manage to function as one integrated group during our fieldwork.
2.2 Working with translators
Carrying out a fieldwork in a place where we as Danish and Ghanaian students did not
know the language put certain limits to our use of especially the social scientific methods.
All communication with the people in Sinulihan had to be mediated either by one of our
Malaysian fellow students or by one of the two interpreters since no one, except for the
secretary of the JKKK, spoke English. This meant that we rarely engaged in non-planned
8informal conversation, but had to make arrangements for interviews when we knew an
interpreter would be available. This was a limitation for us since it is often through such
informal conversation or ”chit-chatting” that interesting information is revealed and formal
interview-statements are challenged.
Another disadvantage is that much information may be lost or ”filtered out” in the process
of translation; details such as body language or the informant’s use of words that can tell a
lot on their perception of things are lost when the translator is there as a third part. (Larsen
1995:97). However, our translators spoke good English, and we are confident that they did
the translations as precisely as possible.
Luckily though, our Malaysian colleagues were able to engage in informal communication
with the villagers and shared their information with us.
2.3 Questionnaire
In Sinulihan we carried out a household survey in the form of a questionnaire that
contained questions on household and family composition, economic matters and farming
practices (see appendix 1). Also included was a section of statements to clarify the
respondent’s attitude towards certain matters, among these the surrounding environment,
infrastructure, government support etc. The intention of this survey was to provide us with
an overview of the village, its demographic and socio-economic characteristics. In order to
obtain quantifiable data suitable for statistic analysis the questions posed to the respondents
were identical and closed, i.e. answers had to fall into predefined fixed categories (Casley
& Kumar 1988:54-56).
Since the village of Sinulihan counts 49 households we initially thought that given our
limited time frame it would be impossible to cover all these and we therefore selected 50%
of the households using a simple random sampling strategy. But because the villagers were
very willing to cooperate and because the secretary of JKKK put a big effort into
informing and gathering them we were actually able to do a full census.
Before initiating the survey we tested the questionnaire on several villagers and found that
it had to be shortened and that it contained questions that the villagers were not able to
answer. This led to adjustments: Problematic questions were eliminated and the remaining
ones were grouped according to topics. The investigation of the tourism-potential of a
9nearby waterfall was also left out since the waterfall turned out to be placed in a rubber
plantation and on land not belonging to Sinulihan.
Even though we adjusted the questionnaire upon several preliminary testings some of the
questions still posed difficulties for the villagers – something which calls for precautions
when analysing the data obtained. First of all it was difficult for the villagers to give
accurate estimates of the acre-size of the different crops they grow, partially because
intercropping is the most common cropping pattern but also the people interviewed can
have different perceptions of the acre-measurements. As Casley & Kumar (1988) point to,
standard terms and definitions are necessary in a structured survey. Valuing inputs and
outputs for each crop was also difficult since most of the crops are cultivated for
subsistence use and therefore not weighed.
Another problem was the sensitive questions on income, expenditures and saving patterns
– something people were reluctant to answer particularly in the presence of other villagers,
and since the questionnaires were carried out in one of the bigger village houses other
people were always present.
When asked to move the interviewing to their respective homes the villagers were reluctant
for reasons unknown to us. This also meant that the household-belongings checklist could
not be ticked of by us but had to be asked to people. The gathering of the villagers in one
of the bigger village-houses was arranged by the JKKK-secretary and it occured to us that
people had also been requested to give prearranged, identical answers to certain questions,
e.g. the sensitive ones on income and the ones on the size of their land which were difficult
to estimate.
Our experiences with the questionnaire lead us to conclude that it is not an easy task to ask
clear and simple questions, especially not when having to phrase these before actually
knowing the setting of the survey site and without knowledge of the data processing
program, SPSS. The most straightforward and well functioning part of the questionnaire
was the statements-section, where the respondents were asked to give their opinion on
certain issues on a scale from 1 to 4 (see appendix 1).
2.4 Semi-structured interviews
To supplement the questionnaire-data, we carried out a number of qualitative interviews.
These mostly took the form of topic-focused interviews with key informants who were
10knowledgeable about certain issues. Prior to the interviews we formulated specific
interview-guides (see appendix 2 for examples) which enabled us to control or guide the
interview but at the same time these guides were sufficiently open to let the informant
come up with topics that he or she found of particular importance. Contrary to the
structured survey the qualitative interview is open-ended and can provide the interviewer
with an insight into new unforeseen problems and areas of interest.
The strategy of the interview-guides was to initiate the interview with questions on the
informants’ background in relation to the topic to be covered and then subsequently move
to more in-depth and sensitive issues. As interviewers we tried to stay as neutral as
possible and expressed interest in the topic at stake. Notes were usually taken by one of us
during the interview and afterwards a brief summary was written down in order to share
the information with the other group members. These procedures are supported by Casley
& Kumar (1988:11-16).
In Sinulihan we conducted semi-structured interviews with four farmers, the village
headman and the chairman of JKKK. The farmer-interviews were centred on farming
practices and cropping patterns whereas the two leading villagers were asked about village-
organization and government funding. A planned interview with the headmaster of the
primary school was cancelled because of his fear of sensitive issues and because we had
not obtained an official permission from the educational department in Keningau and the
local police. Instead one of our Malaysian counterparts was allowed to interview two
school teachers.
The trouble we experienced with the headmaster stood in sharp contrast to the friendliness
and co-operation the other villagers had shown us and it attracted our attention to the fact
that the headmaster had come into conflict with other villagers over matters of government
funding.
Interview-informants outside of Sinulihan consisted of administrative government-staff:
The assistant district officer and the agricultural officer in Sook, the headmaster of the
secondary school and the assistant nurse in nearby Tulid and in Kenigau we visited the
department of Land and Survey and the Rubber Fund Board. Characteristic of these
interviews was that they were carried out together with members of the other groups and
therefore it was not always possible to obtain answers to the specific questions of interest
to Sinulihan, e.g. the Vision 2020-program.
11By using qualitative interviews that met the informants at their own premises we obtained
into depth information on the village community we studied. Considerations to be made
regarding this information are the impact that the interviewer might pose on the informant
and the type of data he is willing to provide; the informant may want to please the
interviewer by answering in a way he believes the interviewer desires (Casley & Kumar
1988:23). To what extent we influenced the answering of our informants is difficult to
judge given our limited time frame; crosschecking information would require knowledge
of the village-situation on a longer time span. Additionally the context of the interview
matters, for example choosing to interview the farmers in their fields, as we did, made
them feel comfortable and ”on their own territory” (Hammersley & Atkinson 1993:150).
2.5 Participant observation
This method, favoured particularly by anthropologists, can provide the researcher with into
depth information about the studied community. In Sinulihan we had the opportunity to
participate in the villagers’ monthly communal working day where we assisted in the
clearing of a piece of communal land for sheep-grazing and in the cleaning up of the
village. Furthermore we were invited to participate in several ceremonies taking place in
the village: One was the honouring of those that had passed away and another was the
namegiving of a child. Although we spent less than two weeks in Sinulihan we believe that
by interacting with the inhabitants we obtained insight knowledge of the internal relations
of the village and experienced the life the people live; its sociocultural aspects and
challenges.
Apart from the advantages of this method, described by Cohen (1984), there are also some
precautions to be taken. Among these is the fact that when the researcher himself becomes
an actor in the society he studies he cannot avoid influencing or even manipulating the
social activities he participates in (Yin 1994:88-89). This is something we considered in
relation to our participation in the village work day; did the people of Sinulihan in fact
carry out this activity on a regular basis or was it a strategic tool in convincing us that they
are a well organized and integrated community?
Finally it should be mentioned that participant observation can be a fruitful supplementary
of other methods (Hammersley & Atkinson 1993:132): e.g. our participation in a JKKK-
12meeting provided us with an insight as to how the village-organizations work and it
thereby enabled us to prepare questions for our interview with the chairman of the JKKK.
2.6 Field observation
Contrary to the method of participant observation the researcher will remain a passive
observer during field observation (Yin 1994:86-89). On the first day of our stay in
Sinulihan, after an introductory meeting with the village headman, we were taken on a
walk around the village. This provided us with a visual impression of the village setting: its
physical environment, facilities and infrastructure. Furthermore the qualitative interviews
we carried out with four different farmers took place in their fields supplying us with
concrete and in-situ knowledge of cropping patterns, field size, fertilizer-use etc. In this
way the field observation method contains both natural and social scientific characteristics.
2.7 Mapping/GPS
When we arrived in Kampung Sinulihan we did not have a map of the village, but
fortunately the villagers were able to provide us with a map that the JKKK-secretary had
drawn (appendix 3). It showed us which households were included in Kampung Sinulihan
and which belonged to the neighbouring settlements of Baru Jumpa and Tebobon. This
mapping of the village we could not have done ourselves since these settlements are
situated close together and are not seperated by physical boundaries. The reasons for the
division between Sinulihan and its neighbouring settlements were explained to us as a)
being religious, one settlement is Christian, and as b) a matter of origin, the other
settlement consisting of people originating from another village than the Sinulihan
inhabitants.
In taking this map as our point of departure this method can be seen as a participatory
exercise: Even though we didn’t request the making of the map, it can be seen as
participatory in the way that it includes the villagers’ perception of Kampung Sinulihan
and tells about their definition of themselves as a bounded community in relation to others.
Apart from providing us with a visual impression of the village, the map was also useful to
us when we numbered the houses in order to make a simple random sample of the
13households. This random sample was to be used for the questionnaire-survey (before we
decided to do a 100%-census) and in this way the two methods supplemented eachother.
We also made our own map of the village-infrastructure by using the GPS to do a
georeferencing of sample points. Apart from marking each house these points consisted of
a number of waypoints of the village-roads. Via the computer we were able to combine the
georeferenced map of the village-infrastructure with the topographic maps of the area.
Finally, as a supplement to the soil and water tests, we marked the boundaries of each field
with the GPS, enabling us to measure the size of each of the fields, and we registered the
location of each watertest-site.
Unfortunately the GPS measurements are somewhere on Borneo and is not available to us,
and we have not been able to implement the data in the report.
2. 8 Natural Scientific Methods
We collected soil and water samples with the immediate objective of receiving basic
information on indicators in these environments.
We tested the following:
• Basic soil fertility and nutrient availability in Sinulihan by field, soil and crop
analysis.
• The impact of agricultural practices on the soil fertility and land degradation in
terms of plant nutrients and water quality.
In order to compare the data later, the Pauh and Sinulihan group attempted to conduct all
the following methods in the same manner, and the section of the report was partly done in
collaboration with group 2.
142.9 Soil and Field Analysis
Field and soil analysis was performed on one hill rice plot of the five farming households
with which we conducted semi-structured interviews (i.e. on five fields). We only chose to
sample hill rice plots because of time and resource constraints and because this crop is
common in both Sinulihan and Pauh. The analysis of the fields involved drawing rough
sketches of the fields and their surroundings, including their topography, as well as noting
if any intercropping existed. The sizes of the fields were measured using GPS.
On each field we marked five roughly equally spaced 1 × 1 m subplots along a diagonal
transect reaching from one corner across to another in order to get the most complete
picture of the field. We extracted soil samples roughly from the middle of each subplot
down to rooting/plough depth (app. 40 cm) using a standard auger and the topsoil was
separated. Soils were subsequently dried back in the village.
We analysed the soils using a soil laboratory kit based on colour charts, after carefully
sieving the soils and thoroughly mixing them with soils of the same depth. This gave us ten
soil samples to analyse, two from each farm/field, which we subsequently analysed with
three replications of each. Analysis included pH, conductivity (EC) and nutrient analysis
for ammonium (NH4), nitrate (NO3), phosphorous (P) and potassium(K).
Certain precautions should be taken in respect to the sampling procedure. The relatively
small sampling size is probably not sufficient to give a representative picture given the
very heterogeneous soil structure of tropical soils (Ahn, 1993). Moreover, due to possible
misunderstandings and lack of communication, the two groups had slightly different
approaches to the sampling strategy. Group 3 measured the topsoil according to the height
of the organic matter layer whereas group 2 did fixed measurements (20 cm). This
somewhat disrupts a direct comparison.
2.10 Crop sampling and analysis
We sampled the youngest fully emerged leaf (suggested by Reuter et al. (1986) in order to
insure tissue of similar maturity) of five rice plants on each subplot. After sun-drying the
15samples, all the blades from one field were then packed into plastic bags and taken to
Denmark. We also bought rice grains from last years harvest from all the farmers whose
fields we investigated. Analysis of the rice blades and grains for N (Kieldahl), P
(colourimetrically using an autoanalyser), K and Ca (atomic absorption spectrometre) was
conducted at the Department of Plant Nutrition, the Royal Veterinary and Agricultural
University of Denmark.
2.11 Water Quality
Changes in stream water quality may be caused by several factors such as sediments
contributed by soil erosion, and waste water discharges from various point and non-point
sources such as the residential and commercial areas, and agriculture activities. To assess
the impacts, sampling stations were set up at appropriate points along the Sook river, one
upstream of Kpg. Sinulihan and another on the downstream side and another two at the
nearby tributaries.
The objective of the study is to receive readable information on the pollution level of the
river given its importance as a water resource to the village and possibly to determine the
main sources of pollution. BOD (Biological Oxygen Demand), COD (Chemical Oxygen
Demand), DO (Dissolved Oxygen) together with counts of faecal and total coliform
bacterial levels are indirect but reliable measures of water pollution levels (EEA,1994 &
WHO,1984).
A multi- hydro-lab was applied in the field for measurements of dissolved oxygen,
temperature and pH. Filtering and incubation for the measurements of BOD and COD were
conducted in the lab (see synopsis). NO3 and NH3 are among the main soil nutrients and
are causes of eutrofication (Lindegaard & Jensen;1996), and were measured with aid of a
colorimeter (see synopsis). For a full list of the measured water quality indicators see
appendix 4.
Fluctuations in physical parameters like stream flow, dissolved sediments and rainfall will
influence the results and so possibly more measurements are needed to get a full picture of
the water quality situation (Keith, 1988). However, this was not possible keeping in mind
the various tasks to be addressed in the study.
163. Results: Analysis and discussion
3.1 Health status
There are five village clinics throughout the Sook-area including one in Tulid and a bigger
one in Sook, but there is only one doctor to serve the entire district. Treatment is free of
charge for locals but outsiders must pay 1 RM for treatment. If there are certain cases the
clinic cannot handle the patients will be transferred to the clinics in Sook or Keningau.
Even though the clinic face constraints regarding funding and equipment (according to the
staff nurse) the respondents in our survey are generally satisfied with the clinic. More than
80% agree or strongly agree to the statement: “We have sufficient medical assistance from
the nearest clinic”. The most common diseases include upper respiratory track infection,
gastro intestinal, tuberculosis, worms and rash. The latter is, according to the staff nurse in
Tulid, a result of logging activities upstream causing pollution to the river, and because the
river is used for bathing throughout the year rash is very common in the area.
It is according to the staff nurse crucial that the water supply in the area should be
improved. The water supply in Kpg. Sinulihan consists of a government funded gravity
water supply which is not functioning satisfactorily. In the dry season it cannot supply the
village with a sufficient amount of water, which means that the villagers must find other
sources of water (usually river water). This surface water from this water source can easily
be polluted with faeces from animals since the river is not protected with a fence as
suggested by WHO (WHO 1984: 21f). According to the questionnaire approximately 85%
of the respondents disagrees or strongly disagrees to the statement “We can drink the water
directly from the river”, and generally the respondents are worried of the general condition
of the river eg. the low amount of fish and occurrence of human faeces in the river. 75% of
the respondents disagree or strongly disagree to the statement “We are satisfied with the
water quality and quantity”, but still 87% see the river as an important watersource. Our
water tests show that the water source used for drinking water does not contain a high
amount of coli bacteria neither does it contain any faecal coli and the total amount is 20
counts of total coliform pr. 100 ml. This is within the guidelines suggested by WHO, but
the problem is the insufficient supply from this water source which leads to the use of
alternative water sources such as the nearby river. The river contains rather high amounts
of both faecal coli and total coli. The average faecal coli in our tests is approximately 1000
17counts of faecal coli and the average total count of coli is approximately 1350 (see
appendix 4). According to WHO drinking must not contain faecal coli at all, and the total
counts of coli must not exceed 10 for unpiped water. Especially the high amount of faecal
coli is disturbing, and as a consequence it is not advisebly to use the river water for
drinking water, which is in accordance with the villagers perception of the water quality.
Malaria seems to be under control because of DDT spraying (maybe it has other effects on
the health status – not to be discussed any further) and government supported mosquito
nets. The mosquito nets can be bought at the clinic at RM 5, and this is a very efficient and
cheap way to control malaria. According to the staff nurse most households in Kpg.
Sinulihan have mosquito nets.
Besides the clinic offers health education to the schools in the area. This ”School-team”
visits each school once a year to examine the health-status of the pupils. They give BCG-
vaccines and worm treatment to the pupils, and they educate the pupils in matters
regarding health. This is not, however, functioning in an optimal manner. The pupils, and
the public in general, do not listen and learn from the health education, and this results in a
lower level of health. According to the staff nurse at the health clinic in Tulid the most
important factor for a good health status is education – awareness of health, and this
requires co-operation between the schools and the health clinic. The clinic has a “School-
team” which visits each school in the area once a year. The purpose of the school team is
to give basic information about health, give the pupils BCG vaccinations and worm
treatment and to detect malnutritioned pupils.
He is also pointing to the general level of education as a parameter for good health.
According to him the general education level in Kpg. Sinulihan is higher than in Kpg.
Pauh, and this has a positive effect on the overall health status in Kpg. Sinulihan (cf.
discussion later in this section).
Another important factor is the level of organisation in each village. The staff nurse points
out Kpg. Sinulihan as a splendid example of a village with a high level of organisation, and
this a positive effect on the overall health status.
183.2 Education
There is one primary school in Kpg. Sinulihan currently with 216 pupils, where
approximately 65% are Muslim pupils. The school was established as a result of a
collective effort from the villagers. The school was build with financial assistance from the
government, but the expenses for running the school was paid by the villagers. Today the
school receives money from the government to cover expenses for furniture, food, books
and renovation of the school, but the villagers still have to pay for school uniforms
(interview with teacher at Sinulihan Primary school 25th October 2001).
After primary school the pupils proceed to secondary school, wich can be in either Sook or
Tulid. The secondary school in Tulid has 800 pupils, and it is ”fed” by 20 different primary
schools in the Sook-area. The secondary school in Sook faces a variety of problems. These
problems range from lack of motivation from pupils, lack of funding, pupils fail to show
up for classes, and lack of teachers. These problems are all limiting the quality of
education and as a consequence the level of education is below optimal (interview with
headmaster in Sook, Oct. 1.st).
The chairman of the JKKK in Kpg. Sinulihan gives very high priority to offering the
children a good education. By raising the educational level of the village children he hopes
to bring future development to Kpg. Sinulihan. The respondents in the questionnaire have a
very positive attitude towards education and the current quality of the school system. 95%
of the respondents agree or strongly agree to the statement: “Our children are assured a
quality education” and 90% agree or strongly agree that the school has produced many
bright students the last five years, and they also display satisfaction with number of
textbooks and the physical surroundings around the school. The positive attitude towards
education is also emphasised by the fact that 85% agree or strongly agree to the statement:
“I will send my children to school even though it needs high expenditure”.
The importance that the villagers put into education can also be seen by the commitment
the villagers put into establishing the primary school 20 years ago. This was an initiative
from the villagers, and it shows the importance that the villagers put into education. He
believes that the young people with a good education will come back to the village after
finishing their education and contribute to the development of the village (Interview with
chaiman of JKKK 21st October). The teacher at the primary does, however, disagree on
19this matter. The well-educated students must because of work commitment stay in some of
the bigger nearby towns (typically Sook, Keningau or even Kota Kinabalu), but they still
feel posses a kind of belonging to Kpg. Sinulihan, and many still contribute to the
household-economy (interview with teacher at Sinulihan Primary school 25th October
2001).
3.3 Economic aspects
In Sinulihan the main source of income and employment is agriculture which employ
about 70% of the working population (See figure 3.3.1). Out of this cash cropping in the
form of rubber, yam and tobacco forms a very high percentage of the total agricultural
activities compared to their neighbours in Pauh, which rely basically on subsistence
Agriculture for livelihood.
Off farm activities are of more significance in Sinulihan compared to Pauh although it is
still minimal. 2% are in trade basically as middlemen and shop keepers, 8% in the public
sector like teaching and nursing, and 2% are drivers. In Pauh 79% of the population is
employed within farming.
Although unemployment seems to be very high, this figure includes full time house wives.
Some of these help their husbands and other family members in the farms.
Occupational Distribution Of
Population
Unemployed
Nurse 18%
1%
Driver
2%
Retailer
2%
Teacher
7%
Farmer
70%
Figure 3.3.1
20Marketing of agricultural products like yam is in the hands of middlemen who purchase it
from the farmers and sell them in the nearby cities of Sook, Keningau and Kota Kinabalu.
The Rubber fund board is the main procurement agency of Rubber.
According to our studies, it was found that about 90% of the farmers were satisfied with
the existing chain of marketing systems and prices for their products.
Total Household Income
30
24
25
Household
20 17
15
10
5
5 1
0
< RM 390 RM 391 - RM 545 - > RM 1001
RM 544 RM 1000
Income
Figure 3.3.2
The figure shows the total household income per month and it is based on the information
from the questionnaire. The reason for the intervals is that RM 390 was the poverty line in
Sabah in 1990 and RM 544 is the poverty line in Sabah in 2000. According to the
questionnaire 12,8% of the households in Sinulihan fall below the poverty line from 2000.
Based on the occupational distribution and the total household income we can conclude
that Sinulihan is heavily relying on the agricultural production which is still, by far, the
most important contributor to the overall income and employment.
213.4 Farming practices and soil analysis
The data do not point to the existence of significant differences between the immediate
nutrient availability of Pauh and Sinulihan. Furthermore, the data show the variability to be
higher among the fields of each village than between the two villages.
The profound differences in field history, topography and crop maturity between the fields
as well as the generally high heterogeneity of tropical soils should provide readable
explanations as to why this pattern is observed (Ahn,1993;Wolf, 1999).
The ammonium levels seem to be slightly higher in the top soils of Sinulihan than those of
Pauh while for the sub soils the opposite seem to be the case. The fact that top soils from
Sinulihan were taken from the nutrient rich top layer whereas those from Pauh were taken
from the top 20 centimetres is the most obvious reason as to the appearance of this pattern
rather than it being a reflection of a genuine difference. Ammonium is the first product in
the nitrogen mobilisation process and is thus found at a high level in the organic matter
rich top layer (Killham, 1994). Moreover, if the values are averaged for the top and sub
soils of the two villages the differences become insignificant - giving further support to
differences in methodology as the main source of explanation.
Avalability of nutrient (0=unavalailable; 4=high availability
4
3
2
1
0
Pauh Sinulihan Pauh Sinulihan Pauh Sinulihan Pauh Sinulihan
NH4+ NO3- P K
Plant nutrient found in fields of 6 Pauh or 6 Sinulihan farmers
Top soil
22Avalability of nutrient (0=unavalailable; 4=high availability)
4
3
2
1
0
Pauh Sinulihan Pauh Sinulihan Pauh Sinulihan Pauh Sinulihan
NH4 NO3 P K
Plant nutrient found in fields of 6 Pauh or 6 Sinulihan farmers
Sub soil
The soil kit applied in the study do not provide satisfactory information on soil nutrient
levels and can not alone be used as a measure of soil fertility and productivity. First of all
the data is non-parametric which makes it difficult to use statistically. Secondly, the data
show only immediate nutrient levels which fluctuate according to physical factors like
rainfall etc. Thirdly, other factors like soil organic matter contents, available and total P,
cation exchange capacity as well as soil texture an structure should be taken into
consideration when determining soil fertility. However, studies of these parameters were
not feasible due to time and work constraints.
In spite of these reservations, the parameters we have measured do give some valuable
indications to the fertility and productivity of the soil.
Soil pH has a strong influence on crops mainly indirectly by affecting nutrient availability.
Low soil pH (typically below 5,0) tend to increase the solubility of carbonates, phosphates
and sulfates which in humid climates potentially can lead to leaching of essential nutrients;
toxic levels of aluminium is another possible effect of low soil pH (Wolf, 1999). The
observed pH for the paddy fields in Sinulihan is between 6,0 and 7,0 which is considered
favourable to most crops but is still slightly higher than the optimal range for rice, 5,0-6,5
23(Wolf, 1999). However, the optimal pH is somewhat dependant on soil organic matter and
clay contents as well as soil type.
Conductivity can be applied as a rough estimate of soil nutrient levels (Barber, 1995). The
measured values from 0,2 to 1,4 mmhos/cm in the hill rice fields of Sinulihan indicate high
variability from low to high nutrient levels (according to Wolf, 1999).This is expected
given the differences in field history and crop maturity and is also reflected in the direct
nutrient measures. However, the data do not indicate any immediate lack of nutrients and
the salinity levels are not critical to rice growth (injury at mmhos/cm>6, Wolf, 1999).
The nutrient analysis of rice leaves and grains provides us with information on possible
deficiencies(or toxic levels) of vital nutrients like N,P,K and Ca which is an indicator of
potential low soil fertility or restrictions in nutrient availability and uptake (Dobermann,
2000). The measured values do not indicate critical deficiencies and for the vast majority
of the samples, the values lie within the optimum ranges (Dobermann, 2000).
All in all, the data at our disposal do not seem to give indications as to the existence of
low soil fertility and restricted plant nutrient availability - at least not for the hill rice
fields. However, given the limited input use of fertilizers and the fact that the
replenishment of nutrients to the soils are dependant on the application of fallow periods, a
potential soil fertility problem do exist. At least, if yields are to be boosted the use of either
fertilizer or manure is an imperative (Dobermann, 2000).
The loss of nutrients through leaching and soil erosion is known to have impacts on the
fertility and productivity of rice cropping systems, and could potentially be a problem in a
low nutrient input farming system as the one observed in our study area but whether it in
reality constitutes a genuine problem is difficult to say based on the available data
(Dobermann,2000).This is partly dependant on soil characteristics of which some have
been measured and on the distribution of precipitation as well as the topography. The fact
that the soils generally are quite sandy could form the basis for a potential erosion or
leaching problem. However, the arable land in Sinulihan is quite flat so at least erosion
seem to be of minor importance (leaching could still be a problem- still, the soil and crop
data don’t point to this).
243.5 Agricultural Practices in Sinulihan
Small-scale farming based on family labour is the prevalent land use in Kampung
Sinulihan. The major crops are rice, yam, rubber, tobacco and oil palm. Hill rice is solely
for own consumption whereas yam constitutes the main cash crop. Rubber is widespread in
the village but not on a larger plantation scale and many of the trees are too old for tapping.
Oil palm does exist but seem to be of less importance. Tobacco as a cash crop was
expected to be of greater significance, however, being of low quality, it is mainly for local
sale. Some few farmers, though, are on contract with Rothmans. In addition, many
varieties of vegetables and fruits are produced of which the majority is for own
consumption.
Distribution of Main Crops
Paddy
Others
97 ac.
112 ac. Yam
10%
12% 77 ac.
8%
Oil Palm
50 ac.
5%
Rubber
618 ac.
65%
Figure 3.5.1
The figure reflects the distribution of crops in Sinulihan based on the information from the
questionnaire. Rubber occupies 65% of the total area, but this is not necessarily in indicator
of rubber contributing with 65% of the total income.
3.6 The Fields
Intercropping between yam and hill rice is widespread. Certain common farming practices
are observed in this cropping system:
• No or only very little use of fertilizer and manure
25• Herbicides (mainly glyphosate) are used before planting but rarely during the
cropping face
• Use of shifting cultivation with fallow periods up to 7 years
• Rudimentary technology and general use of manpower (family labour) in the
weeding and harvest process
• Slash-and–burn is common procedure
3.7 Governmental assistance and subsidy
As previously mentioned it is a clear objective imbedded in the Agricultural policies of
Sabah to secure the proliferation of cash-cropping and efficient farming techniques. On a
regional level this authority lies with the Agricultural Department in Sook whose role it is
to select target villages for the introduction of new crops and farming methods (e.g. yam-,
coffee- cocoa schemes). Interestingly, it is a clear policy that this selection should favour
those villages already considered dynamic and “well-organized” and not as one might
think those that are less developed. The support is not given as direct funding, but by
offering fertilizers, herbicides or seedlings to the farmers.
The initial stage of introducing yam to Sinulihan and training of the farmers can probably
be attributed to the intervention and influence of the Agricultural Department. However,
based on farmers accounts the support from the local authorities has been halted apart from
basic advice on plant diseases and pest control. In fact, there seem to be conflicting views
as to the degree of involvement by the Agricultural Department in the village. The
villagers are possibly downplaying its role and the authorities the opposite.
3.8 Agriculture and water quality
Intensive agriculture constitutes one of the main sources of pollution in river systems given
its supply of pesticides as well as excess nutrients and organic matter (Lindegaard &
Jensen, 1996). The measured pollution levels could therefore provide indirect information
as to the impact of farming practices on the environment and are dependent on the
activities in the catchment area (EEA, 2000).
26You can also read