Russia Sanctions: Diving into the Details - Elina Ribakova IIF 14. April 2022 Markus Brunnermeier
←
→
Page content transcription
If your browser does not render page correctly, please read the page content below
P
                                           R
                                           I
                 Russia Sanctions:         N
                 Diving into the Details   C
Elina Ribakova                             E
IIF                                        T
                                           O
                                           N
14. April 2022
Markus
Brunnermeier
On Russian Sanctions: Earlier webinars
       ▪Sergei Guriev
        Russian Marcoeconomy             P
                                         R
       ▪Jim Hamilton                     I
        Oil shocks                       N
                                         C
                                         E
       ▪Baqaee-Moll:
        Impact on Germany
                                         T
                                         O
                                         N
                                             2
Sanctions
▪Trade sanctions
 ▪ Export control      (technology)               P
 ▪ Import restrictions (coal, oil, natural gas)   R
▪Financial sanctions                              I
 ▪ Activities: capital account restrictions       N
 ▪ Holdings: Freezing of reserves                 C
 ▪ Forced currency conversion                     E
                                                  T
▪Individual                                       O
 ▪ How to target?                                 N
 ▪ Travel restrictions, …
                                                      3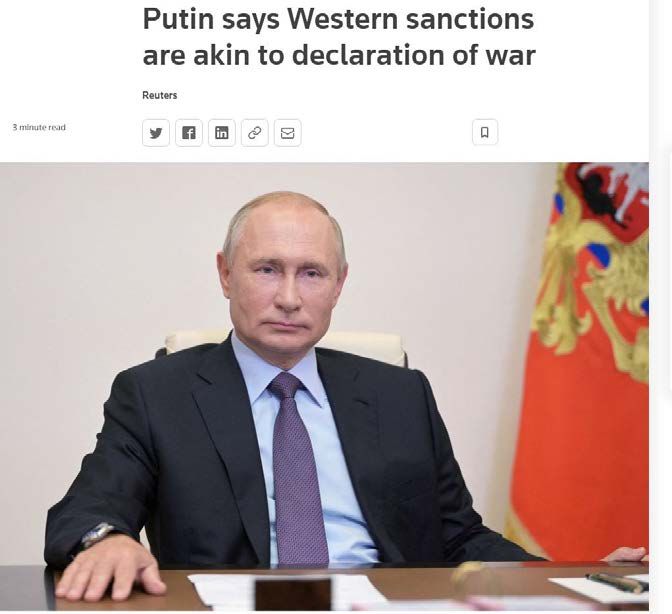
Resilience and Sanctions
▪Offensive: sustain sanctions
▪Defensive: withstand others’ sanctions   P
 ▪ Prepare: build-up reserves, autarky    R
 ▪ React, agility/flexibility             I
                                          N
                                          C
                                          E
                                          T
                                          O
                                          N
                                              4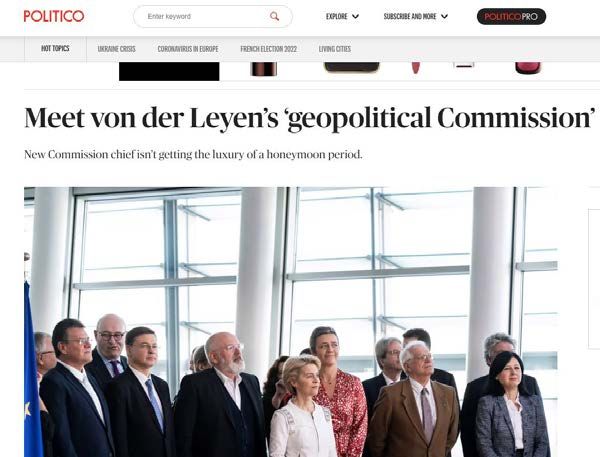
Resilience and Sanctions
▪Offensive: sustain sanctions
▪Defensive: withstand others’ sanctions   P
▪Secondary sanctions on                   R
                                          I
 Europe              Russia               N
                                          C
      Middle                              E
      East                China           T
                                          O
                                          N
                                              5
Resilience and Sanctions
▪Offensive: sustain sanctions
▪Defensive: withstand others’ sanctions   P
▪Secondary sanctions on                   R
                                          I
 Europe              Russia               N
                                          C
      Middle                              E
      East                China           T
                                          O
 ▪ China                                  N
 ▪ Shipping
 ▪ Payment                                    6
Hide and Seek Game
▪Why does Russia wants pay in Ruble
 instead of Dollar/Ruble?                              P
 ▪ Let energy importers swap currency                  R
 ▪ Easier to follow pay trail                          I
▪Why doesn’t Russia want to default on $-debt,         N
 while US wants Russia to (even to US banks)?          C
 ▪ Downgrade of Russia has many implications           E
 ▪ Existing debt becomes illiquid                      T
 ▪ Difficult to issue new debt (even after conflict)   O
▪Role of Cryptoassets (Bitcoin et al.)                 N
                                                           7
Sanctions and International Monetary System
▪Freezing of dollar reserves
▪VoxEU with Harold James and Jean-Pierre Landau      P
▪No serious alternative currency to US $             R
 ▪ Crypto, Australian $, commodities, …
                                                     I
 ▪ US improves store of value (medium of exchange)   N
                                                     C
▪Alternative to reserves holdings
                                                     E
 ▪ More frequent imposition of capital controls
 ▪ Hurts globalization
                                                     T
                                                     O
                                                     N
                                                         8
Poll
1.    Does Ruble strengthening mean
      sanctions are not working?
 a.    Yes                                          P
 b.    No                                           R
2.    Do you think a full embargo is preferable     I
      to a more gradual approach?                   N
 a.    Yes
 b.    No
                                                    C
3.    Would you pay for sanctions on Russia or a
                                                    E
      stronger EU armament? What fraction of your   T
      annual income?                                O
 a.    None    d. 10%                               N
 b.    2%   e. 25%
 c.    5%   f. 50%
                                                        9
P
                   R
                   I
                   N
                   C
                   E
Russia Sanctions   T
                   O
Markus             N
Brunnermeier
14. April 2022
Russia Sanctions:
Diving into the Details
Elina Ribakova
Benjamin Hilgenstock
April 14, 2022
Markus BrunnermeierIt is all “geopolitical” now
Russia sanctions: are they working?
1. Sanctions are having an impact
2. We focused on financial sanctions since 2014
3. Time to move to smart sanctions on energy?

   • Escrow accounts for payments for Russia's exports
   • Limitations on oil and gas purchases
   • Wavers vs secondary sanctions on countries like China/India
What is Russia: in one chart

                                      Russia: Reserve dynamics
      250
                                                       Balance of payments, in $ bn (4q moving sum)
      200
      150
      100
       50
       0
      -50
     -100                                        Current account balance
                                                 Non-resident FDI
     -150                                        Non-resident portfolio investment
                                                 Non-resident other investment
     -200                                        Other flows, net
                                                 Reserves (+ = increase)
     -250
            2011               2014                  2017                      2020
            Source: CBR, IIF
Financial sanctions from 2014 until now
2014 Russia: SOE dominated financial system
1. Access to capital markets Sberbank
VTB Bank
2022 Gazprombank
Alfa-Bank
1. Central bank sanctions Rosselkhozbank
Moscow Credit B.
Bank Otkritie Share of total banking system
2. Russian banks (incl. SWIFT) Sovcombank
assets, in % (banks disconnected
from SWIFT in red)
Rosbank
3. Export controls Tinkoff Bank
Rossiya
4. Commodity bans NB Trust
Other disconn.
5. Individuals Foreign
Other
6. “Self-sanctioning” 0 10 20 30
Source: banki.ru, IIFWhat happened in 2014?
Russia lost its access to global markets
Effect of financial sanctions in 2014 Fortress Russia hit by CB sanctions in 2022
800 700
External debt by sector, in $ bn Other sectors Composition of official reserve assets, in $ bn
MFIs
Government 650
700 Central bank o/w other
Total o/w gold
600
o/w foreign exchange
Official reserves
600 550
500
500
450
400 400
350
300
300
200 250
2007 2009 2011 2013 2015 2017 2019 2021 2010 2012 2014 2016 2018 2020 2022
Source: Haver, IIF Source: CBR, Ministry of Finance, IIFWhat did Russia do in response? Built a Fortress
Pivot away from the USD Nearly complete divestment from UST
50 180
Currency composition of reserve assets, in % Total U.S. Treasury holdings by
160 Russian residents/entities, in $ bn
40 March 2014 140
December 2021
120
30
100
80
20
60
10
40
20
0 0
EUR USD Gold GBP CNY Other 2012 2014 2016 2018 2020 2022
Source: Central Bank of Russia, IIF Source: U.S. Treasury Department, IIFAre sanctions having an impact?
Russia’s economy to contract by 15% in 2022 Inflation has picked up sharply
15 25
Contributions to change in real GDP, Inflation and policy rate
10 in pp (q/q (sa) and y/y, respectively)
20
5
Headline inflation, in % y/y
0 Core inflation, in % y/y
Policy rate, in %
15
-5
-10
10
-15 Consumption
Government
-20 Investment 5
Inventories
-25 Exports
Imports
-30 0
22Q1 22Q2 22Q3 22Q4 2022 2014 2015 2016 2017 2018 2019 2020 2021 2022
Source: Rosstat, IIF Source: CBR, Rosstat, Eurostat, IIFHowever, Ruble has strengthened…
Ruble back to pre-war levels With shallow market liquidity
130 30
Exchange rate, in RUB/$ CBR FX market turnover, RUB to $/€, in $ bn
120 w/ residents, spot
25 w/ residents, swap
110
20
100
15
Feb. 24:
90 invasion
10
80
Feb. 26-28:
70 sanctions 5
Feb. 21: recognit.
of separatist rep.
60 0
Jan-22 Feb-22 Mar-22 Apr-22 Jan-22 Feb-22 Mar-22 Apr-22
Source: Haver, IIF Source: CBR, IIF… and financial system is stabilizing
Bank runs following sanctions Skilled CBR response
6,000 6,000
Banking system structural Composition of the banking system's
structural liquidity surplus, in RUB bn*
liquidity surplus, in RUB bn
4,000 Claims on CBR,
3,000 standing facilities
Claims on CBR,
deposits, auction-
2,000 based operations
0
0 Liabilities to CBR,
30-day auction-based oper.,
moving REPOs/FX swaps
average
-2,000 Liabilities to CBR,
-3,000 standing facilities,
secured loans
-4,000 Drop
starting Liabilities to CBR,
Feb. 28 -6,000 standing facilities, Non-stand.
REPOs/FX swaps monetary pol.
-6,000
instruments
-8,000 -9,000
Jan-20 Jul-20 Jan-21 Jul-21 Jan-22 1-Feb 15-Feb 1-Mar 15-Mar 29-Mar
Source: CBR, IIF Source: CBR, IIF *7-day moving averageWhat is happening? FX from CA is flowing in 1. Exporters are required to surrender 80% of their export proceeds 2. Banking system, oil, and gas sectors are dominated by SOEs 3. Gas used for geopolitical objectives 4. Energy for Rubles via Gazprombank
Ruble payments for gas proposal
                                                      Transactions executed by Gazprombank

     Buyer’s                            Buyer’s                         Buyer’s                Seller’s
    Remitting            EUR            Special                         Special       RUB     Receiving
     Account             (EUR)         K Account                       K Account      (EUR)   Account
      (EUR)                              (EUR)                           (RUB)                 (RUB)

                                              EUR                   RUB
                                              (EUR)                 (EUR)
                                                        Moscow
                                                       Exchange
                                                      MICEX-RTS

Source: The Bank of Russia
https://cbr.ru/press/event/?id=12782
Sanctions have to address current account
Historically high current accounts Driven by commodities
200
Composition of current account, in $ bn Composition of
exports (2017-21)
150
100
Other Crude oil
50
0
-50 Nickel
Petroleum
Copper products
-100
Aluminum
Wood
-150 Oil and gas exports Other goods exports Wheat Coal
Goods imports Services bal. Natural gas
Fertilizers
Income & transf. bal. Current account bal.
Ferrous
-200 metals
2000 2003 2006 2009 2012 2015 2018 2021
Source: Federal Customs Service, IIF
Source: CBR, IIFWhich countries buy Russian energy?
Largest trade partners Purchases of oil and gas
350 100
Composition of Imports of Russian energy by EU, UK, and US
exports (2017-21) (volumes & shares of respective Russian exports)
Netherlands 300
80
Other Germany
250
60
200
150
Other EU 40
Japan
100
United
States Oil & petr. products, in tn th 20
50 Natural gas, in bcm
United Oil & petr. products, in % (rhs)
Kingdom
Natural gas, in % (rhs)
Belarus Turkey 0 0
China
2000 2005 2010 2015 2020
Source: Federal Customs Service, IIF Source: CBR, EIA, Eurostat, IIFThe EU most reliant on Russian energy
Russian imports critical for EU Gas supply is less diversified
1,000 80 100
LV CZ
EU27 imports of Russian oil and natural gas
HU Higher share SK
Oil & petr. products, volume, in toe mn for natural gas
EE
Natural gas, volume, in toe mn
800 Oil & petr. products, share of total, in % (rhs)
Natural gas, share of total, in % (rhs) 60
Natural gas (incl. LNG)
Higher
RO share for
oil & petr.
products
600 DE PL
50
40
IT
GR
400 EU
LT
NL
20 FR
200 Share of energy imports
ES BE accounted for by Russia,
PT
DK SE in % (2016-20 avg.)
UK
0
0 0 0 50 100
1990 1995 2000 2005 2010 2015 2020 Oil & petroleum products
Source: Eurostat, IIF Source: Eurostat, IIFIncluding due to lack of LNG infrastructure
LNG terminals have capacity But geographical distribution is challenge
Spain European LNG
import terminals
UK
France
Klaipéda
Italy Świnoujście
Milford Haven
Netherl. Gate Terminal
Isle of Grain Zeebrugge
Belgium Dunquerque
Portugal Montoir de Bretagne
Greece Krk
Mugardos
Panigaglia
Poland Cavarzere
Bilbao Livorno
Fos
Lithuania
Barcelona
Sines
Croatia LNG import capacity, in bcm/year Sagunto Agia Triada
Huelva Cartagena
0 20 40 60
Source: Entsog, IIF Source: Entsog, IIFOil is much more important for BoP
Oil is more important for Russia’s BOP But price dynamics may change that
100 700
Exports of oil and natural gas, in $ bn Energy prices, indices (Jan. 2021 = 100)
90
Oil & petroleum products 600
80 Natural gas (incl. LNG)
500 Brent crude
70
Natural gas, Europe
60
400
50
300
40
30 200
20
100
10
0 0
2014 2016 2018 2020 2022 Jan-21 Apr-21 Jul-21 Oct-21 Jan-22 Apr-22
Source: CBR, IIF Source: Haver, IIFOil scenarios for bop
Change in value of oil and petroleum product exports (2022 vs. 2021), in $ bn
Decline in oil export volume (2022 vs. 2021), in %
0% 5% 10% 20% 30% 40% 50% 60% 70% 80%
50 -113 -117 -120 -127
Brent oil price, in $/bbl
75 -47 -54 -60 -73 -87
100 20 10 0 -20 -40 -60
125 86 73 60 33 6 -20 -47
150 136 120 86 53 20 -14 -47
175 180 140 100 60 20 -20 -60
200 193 146 100 53 6 -40 -87
225 193 140 86 33 -20 -73
250 180 120 60 0 -60
Notes: Urals discount assumed to be $25/bbl.Oil and gas critical for the budget 1. Oil and gas account for ~ 40% of federal budget revenues 2. Non-oil budget has been consistently in deficit 3. Extraction tax has become more important vs. export duties 4. Other sources of revenues could contract sharply as well
Oil and gas are important sources of revenue
            Oil and gas revenues are significant                             Non-oil balance is in large deficits
    12                                                         60   10
          Federal budget oil and gas revenue, in % GDP                     Federal government balance, in % GDP

                                   Oil and gas revenue,                                                     Overall balance
    10                             in % total revenue
                                                               50
                                                                     5                                      Non-oil/gas balance

    8                                                          40
                                                                     0

    6                                                          30

                                        Mining and                   -5
                                        quarrying taxes
    4                                                          20

                                                                    -10
    2                                                          10
                 Export duties

    0                                                           0   -15
     2010      2012     2014     2016     2018       2020   2022          2006     2009       2012       2015      2018        2021
         Source: Ministry of Finance, Rosstat, IIF                        Source: Federal Treasury, Ministry of Finance, IIF
Oil is also more important for the budget
Oil is more important for revenues Consolidated vs. federal budget
3,000 60 80,000
Federal government revenue Consolidated government revenue and
expenditure (2021), in RUB bn
Total revenue, in RUB bn (3mma, SA) 70,000 (frames = federal government)
2,500 Share of oil revenue, in % (rhs, 3mma) 50
Share of gas revenue, in % (rhs, 3mma) Oil & petr. products Natural gas
60,000
Other revenue Expenditure
2,000 40
50,000
1,500 30 40,000
30,000
1,000 20
20,000
500 10
10,000
0 0 0
2014 2016 2018 2020 2022 Revenue Expenditure
Source: Federal Treasury, IIF Source: Federal Treasury, Ministry of Finance, IIFOther revenues will fall substantially
Non-oil/gas revenues also at risk Difficult cuts could be necessary
Composition of Composition of
revenue (2017-21) expenditure Other
expenditure
Other (2017-21)
revenue Interest
Mining &
Excise tax quarrying Government Social security
(domestic) taxes activity & services
Law
Income &
enforcement
profit tax & state
security
Export
duties on
oil & gas
VAT on Other social
National
domestic services
Economy
Taxes on goods &
imported services
goods &
services National
defense
Source: Federal Treasury, IIF Source: Federal Treasury, IIFOil scenarios for the budget
Change in fiscal revenues, in % 2021 GDP
75 RUB/$ Decline in oil export volume (2022 vs. 2021), in %
0% 5% 10% 20% 30% 40% 50% 60% 70% 80%
50 -3.4 -3.5 -3.6 -3.8
Brent oil price, in $/bbl
75 -1.4 -1.6 -1.8 -2.2 -2.6
100 0.6 0.3 0.0 -0.6 -1.2 -1.8
125 2.6 2.2 1.8 1.0 0.2 -0.6 -1.4
150 4.1 3.6 2.6 1.6 0.6 -0.4 -1.4
175 5.4 4.2 3.0 1.8 0.6 -0.6 -1.8
200 5.8 4.4 3.0 1.6 0.2 -1.2 -2.6
225 5.8 4.2 2.6 1.0 -0.6 -2.2
250 5.4 3.6 1.8 0.0 -1.8
Notes: Urals discount assumed to be $25/bbl.
Change in fiscal revenues, in % 2021 GDP
150 RUB/$ Decline in oil export volume (2022 vs. 2021), in %
0% 5% 10% 20% 30% 40% 50% 60% 70% 80%
50 -1.4 -1.6 -1.8 -2.2
Brent oil price, in $/bbl
75 2.6 2.2 1.8 1.0 0.2
100 6.6 6.0 5.4 4.2 3.0 1.8
125 10.6 9.8 9.0 7.4 5.8 4.2 2.6
150 13.6 12.6 10.6 8.6 6.6 4.6 2.6
175 16.2 13.8 11.4 9.0 6.6 4.2 1.8
200 17.0 14.2 11.4 8.6 5.8 3.0 0.2
225 17.0 13.8 10.6 7.4 4.2 1.0
250 16.2 12.6 9.0 5.4 1.8
Notes: Urals discount assumed to be $25/bbl.Domestic financial system is not very deep
Banking system is of medium depth Banks are financing most of the deficit
250 8,000 60
Banking system assets (2020), in % GDP Banks' OFZ holdings, in RUB bn
Banks' OFZ holdings, in % total (rhs)
7,000 Banks' OFZ holdings, in % total assets (rhs)
200 50
6,000
150 40
5,000
4,000 30
100
3,000
20
50
2,000
10
0 1,000
Egypt
Colombia
S. Korea
Thailand
Malaysia
Czech R.
Turkey
S. Africa
Nigeria
UAE
Brazil
Russia
Hungary
Mexico
Poland
Romania
Chile
Ukraine
Philippines
Indonesia
0 0
Jan-12 Jan-14 Jan-16 Jan-18 Jan-20 Jan-22
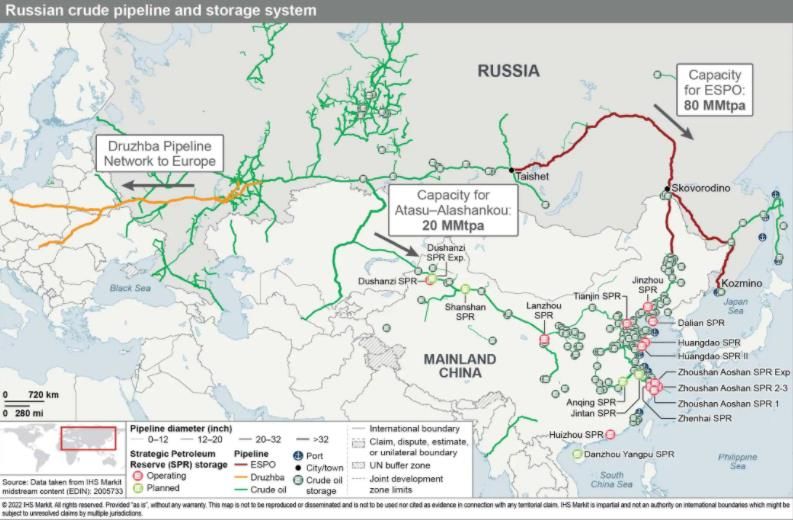
Source: Haver, IIF Source: CBR, IIFCan oil be diverted to other countries? 1. Russia’s oil infrastructure is geared towards the West 2. Pipeline to China does not have adequate capacity to divert 3. China and India can be threatened with secondary sanctions (Iran) 4. Some diversion is ok as it would help cushion market impact
China and India import of oil
EU27 China India
140 30 140 30 140 30
EU27: crude oil imports (2020), in China: crude oil imports (2020), in India: crude oil imports (2020), in
120 million tons (lhs) and % of total (rhs) 25 120 million tons (lhs) and % of total (rhs) 25 120 million tons (lhs) and % of total (rhs) 25
100 100 100
20 20 20
80 80 80
15 15 15
60 60 60
10 10 10
40 40 40
20 5 20 5 20 5
0 0 0 0 0 0
Iraq
UAE
Other
Iraq
UAE
Iraq
Other
US
Other CIS
Other
UAE
Kuwait
US
Kuwait
Russia
Other CIS
Mexico
Kuwait
Russia
US
Mexico
Mexico
Other CIS
Russia
West Africa
West Africa
West Africa
S & Centr. America
Other Middle East
Saudi Arabia
S & Centr. America
Other Middle East
S & Centr. America
Other Middle East
Saudi Arabia
Saudi Arabia
Source: BP, IIF Source: BP, IIF Source: BP, IIFRussia’s oil infrastructure geared towards West
Other
(39)
~½ via
China pipeline
Pipeline cap.:
(83) ~100 million
tons/year
Russian crude oil
exports (2020):
260 million tons
Europe
(138)
Source: S&P Global
~59 mn 42% of exp.
tons to EuropeCounter-sanctions and spillovers
Other commodities could be affected Correlation with price change
80
Palladium Share of world imports
Wheat Coal (S. Africa)
accounted for by BL, RU,
Price change, Mar. vs. Jan. (avg)., in %
Iron (basic forms) 70
Vegetable fats/oils and UA vs. price change
Barley
Fertilizers (mineral) 60
Nickel
Natural gas Nickel
Coal
Maize 50 (Europe) Wheat (avg.)
Oil/petrol. prod.
Wood (basic forms) 40
Silver/platinum Russia Oil/petrol. Fertilizers
Natural gas prod. (Brent) (DAP, U.S.)
Uranium/thor. ores Ukraine 30
Nickel ores Belarus Maize
Synthetic rubber
Aluminum 20 Iron ore
Aluminum
Copper
Zinc
Lead 10
Iron ore Gold Copper
Aluminum ores Silver/platinum (avg.)
Share of world imports by Lead
Gold 0
Zinc product/product group, in %
0 5 10 15 20 25
0 10 20 30 Share of world imports (2016-20 avg.), in %
Source: Unctad, IIF Source: Unctad, World Bank, IIFSanctions: what happens next? • Russia’s currency and financial system have stabilized • Energy exports are the key issue now: • 1. Escrow accounts for payments for Russian exports (oil products). • 2. Limitations on oil and gas purchases. • 3. Wavers vs. secondary sanctions on countries like China/India. • Beware of unintended consequences
References
• Russia Sanctions: Climbing the Escalation Ladder, February 28, 2022
  https://www.iif.com/Portals/0/Files/content/IIF_RussiaSanctionsPaper_2022.pdf
• Macro Notes: Russia Sanctions - Financial System Stabilizing
• Macro Notes: Russia Sanctions - A Possible Energy Embargo
• Macro Notes: Russia - Economy to Contract Sharply in 2022
• Macro Notes: Russia Sanctions - China’s Potentially Crucial Role
• Redefining Europe’s economic sovereignty https://www.bruegel.org/2019/06/redefining-
  europes-economic-sovereignty/
You can also read