SALIENCY MAPS CONTAIN NETWORK "FINGERPRINTS"
←
→
Page content transcription
If your browser does not render page correctly, please read the page content below
ICLR 2022 PAIR2 Struct Workshop

S ALIENCY M APS C ONTAIN N ETWORK “F INGERPRINTS ”
 Amy Widdicombe & Simon Julier
 Department of Computer Science
 University College London
 Gower Street, London, UK

 Been Kim
 Google Brain

                                                A BSTRACT

         Explaining deep learning models and their predictions is an open question with many pro-
         posed, but difficult to validate, solutions. This difficulty in assessing explanation methods
         has raised the question on the validity of these methods: What are they showing and what
         are the factors influencing the explanations? Furthermore, how should one choose which
         one to use? Here, we explore saliency-type methods, finding that saliency maps contain
         network “fingerprints”, by which the network which generated the map can be uniquely
         identified. We test this by creating datasets made up of saliency maps from different “pri-
         mary” networks, then training “secondary” networks on these saliency-map datasets. We
         find that secondary networks can learn to identify which primary network a saliency map
         comes from. Our findings hold across several saliency methods and for both CNN and
         ResNet “primary” architectures. Our analysis also reveals complex relationships between
         methods: a set of methods share fingerprints, while some contain unique fingerprints. We
         discuss a potentially related prior work that may explain some of these relationships; some
         methods are made up of ’higher order derivatives’. Our simple analytical framework is a
         first step towards understanding ingredients of and relationships between many saliency
         methods.

1   I NTRODUCTION

Being able provide explanations for a model’s decision has become crucial as more complex models used in
high stake decisions Trajanovski et al. (2018). While there has been numerous methods developed to provide
explanations, we lack fundamental understandings of how they work: what are the factors influencing them?
Do some methods include factors subset of other methods?
Methods which explain a model’s decisions by highlighting the most important part of an input are called
“saliency methods”, with a range of different justifications for why they should provide a good explanation
for a model’s prediction. These justifications and the validity of the methods themselves have been called into
question however. Adebayo et al. (2018) show that some are independent of the model predictions–the very
object it aims to explain. Nie et al. (2018) demonstrate that in contrary to common belief that explanations are
about models, some methods are essentially doing partial image recovery, producing “clearer” (superficially
more desirable) explanations. These prior works highlight the risk of using only visual analysis to create,
understand and select saliency methods and begs for a question: what are the main ingredients for these
explanations?

                                                   1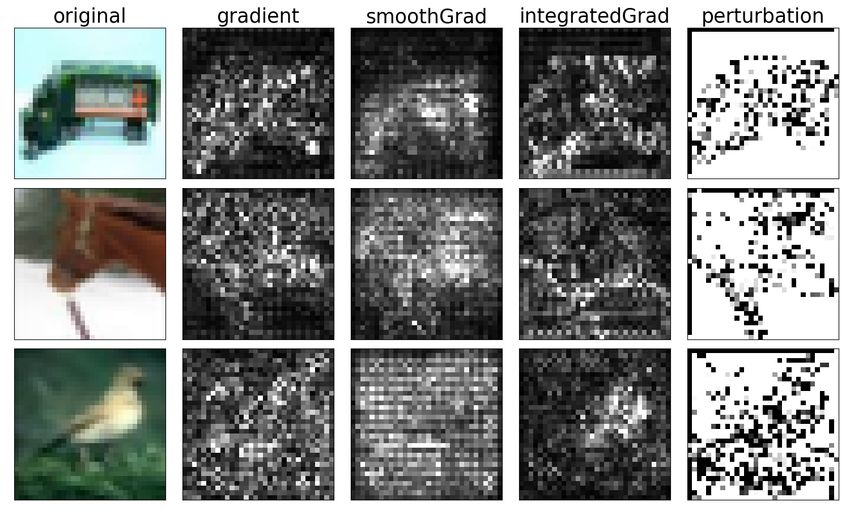
ICLR 2022 PAIR2 Struct Workshop

In this work, we take a first step towards analyzing ingredients for saliency maps, which we call “finger-
prints”. We first train a set of primary networks, from which we create a set of saliency maps. We then train
’secondary’ networks using these explanations to classify which “primary” they come from (i.e., labels are
the identify of the primary network). This simple approach can reveal things that we cannot tell visually:
the Gradient (Simonyan et al. (2013)), SmoothGrad (SG) (Smilkov et al. (2017)) and Integrated Gradient
(IG) (Sundararajan et al. (2017)) saliency methods all produce maps which contain an identifiable “network
fingerprint”, that is, we can use them to identify different networks, even when the networks have identical
architecture and structure. In contrast, a perturbation-based method (Fong & Vedaldi (2017)), does not
produce almost no fingerprint at all. Furthermore, our results suggest that some methods contain fingerprints
that are superset and subset of other methods. We discuss a potential connection between our findings and a
prior work Seo et al. (2018)that showed SG contains the higher order terms that other methods do not.
Our contributions are:

• We show that a set of saliency maps contain a “fingerprint” of the network which the map is generated
  from.
• We empirically look at the relationships of fingerprints (e.g., subset) between popular methods.
• We connect our work to a prior analytical work that may begin to explain some of our findings.

2       E XPERIMENTS
2.1      C HOICE OF P RIMARY N ETWORKS , S ALIENCY M ETHODS AND T RAINING DATA

Primary Networks: We have used three types of primary networks: a simple 2 layer CNN, a MiniResNet
(11 layers), and a MiniCNN (11 layers), which is identical to the MiniResNet network, but without the skip
connections. All of the secondaries use the MiniCNN architecture.
Saliency methods: We use the PAIR saliency library (PAIR) for Grad Simonyan et al. (2013), SG Smilkov
et al. (2017) and Integrated Gradients (IG) Sundararajan et al. (2017). For Meaningful Perturbation Fong &
Vedaldi (2017), we convert a PyTorch implementation1 into TensorFlow, using the same modifications for
speed up, as well as some changes made in the original paper(Fong & Vedaldi (2017)) author’s branch2
Datasets: All the primaries are trained on CIFAR10 Krizhevsky (2009).

2.2      T RAINING

Primary Networks: Each primary network was trained separately using the CFAR10 dataset. The Glorot
uniform initializer was used to initialize the weights randomly.
Secondary Networks: For each saliency technique, we trained a separate secondary network. The training
data for these networks was obtained by applying the saliency technique to each primary for all of the images
in the dataset.

2.3      R ESULTS AND A NALYSIS

Can we identify unique primary networks from just the saliency maps?
We first investigated whether a secondary classifier, using the gradient saliency method from Simonyan et al.
(2013), could be trained to classify primary networks using different network architectures (A1 and A2). Our
    1
        https://github.com/jacobgil/pytorch-explain-black-box, visited on 03/05/2022
    2
        https://github.com/ruthcfong/pytorch-explain-black-box, visited on 03/05/2022

                                                 2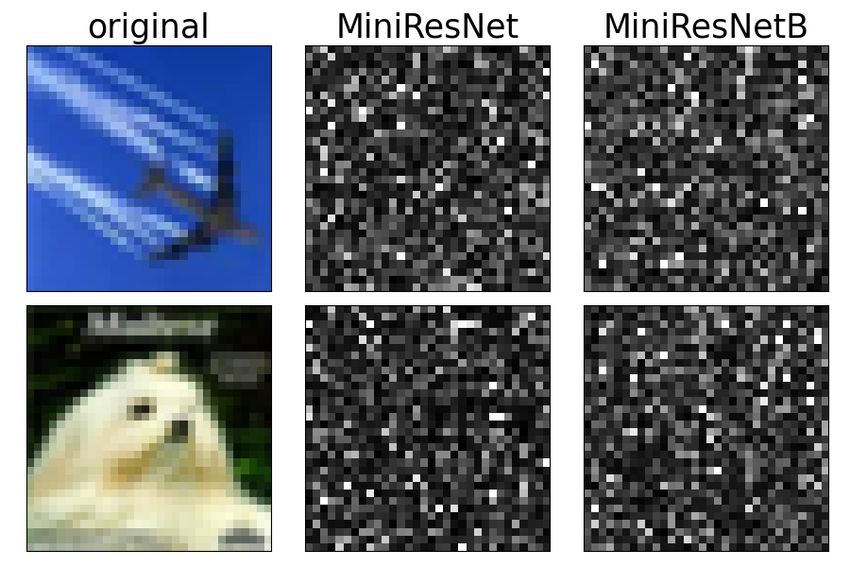
ICLR 2022 PAIR2 Struct Workshop
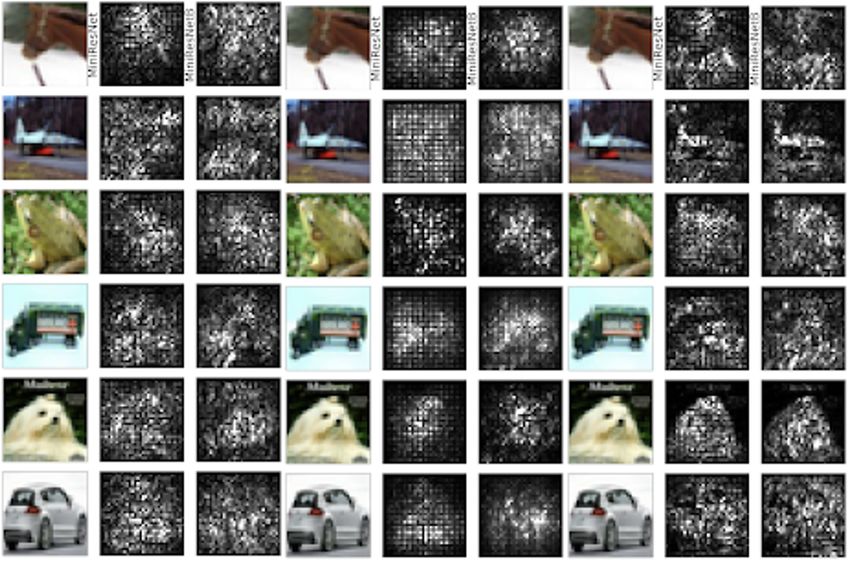
Figure 1: (left) Gradient maps for two identical (but differently initialised and trained) ResNets A and B
for images 1 and 2. Visually maps for the same input appear more similar than they do for the same primary
network, but somehow the secondary network has learned to identify a pattern/feature which every map for
a given primary has in common. (right) An example of shuffled pixels - the same maps as on the left, but
with the pixel order randomized.
Table 1: Results: cross-comparison across architectures and methods. Random/chance accuracy is 0.5 (left),
0.5 (middle) and 0.1 (right).
experiments revealed that the performance of the classifier was surprisingly high, with all initial experiments
getting over 90% accuracy .
To test if the fingerprints are only capable of distinguishing between different network architectures, we
then explored if we could train a secondary to classify between a set of primaries which all had the same
architecture but different weights. Each primary was trained using a different randomly chosen subset of
CFAR10 for the training data, and GlorotUniform initializer. This experiment also resulted in a very high
accuracy ∼ 95% (for comparison, the same architecture as the secondary gets only ∼ 73% with no data
augmentation for CIFAR10, meaning that classifying between the primaries’ maps is easier than a single
primary correctly classifying CIFAR10 images). To see whether this finding extends other widely used
saliency methods, we explored two other gradient-based methods, SmoothGrad (SG) Smilkov et al. (2017)
and IntegratedGradients (IG) Sundararajan et al. (2017). Once again, the classification accuracy was high
(see 1 for accuracies), suggesting that saliency maps contain a strong network fingerprint of the primary
network.
3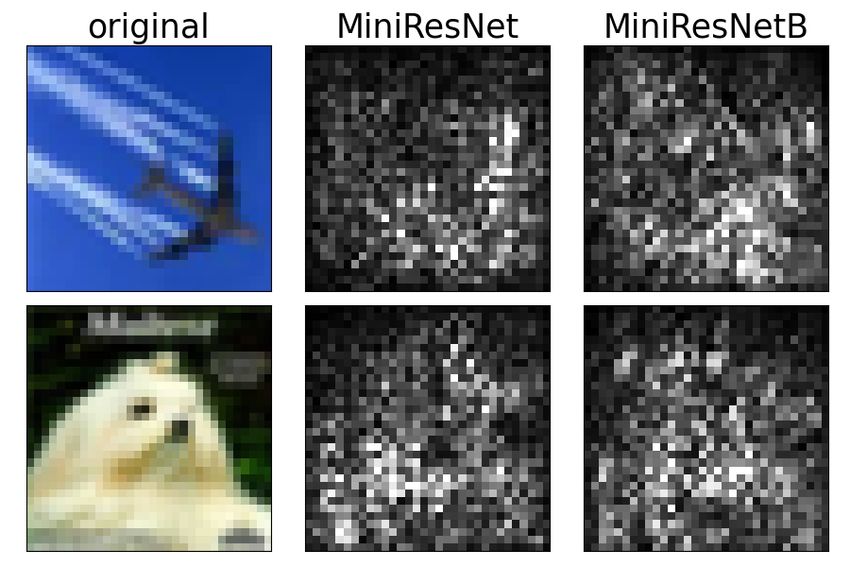
ICLR 2022 PAIR2 Struct Workshop

                       Figure 2: Example Saliency maps from Grad, SG, IG and PM.

In contrast, a perturbation-based methods (meaningful perturbation, MP Fong & Vedaldi (2017)) does not
contain the same kind of fingerprint, achieving close to random performance in prediction identity of primary
networks.
Are we identifying the networks using unstructured statistics?
To test whether the fingerprints arise from the structure of the maps (rather than unstructured statistics such
as the mean and covariance of pixel intensity values), we randomly shuffled the pixels in each of the maps
in a dataset, and then trained a new secondary based on this pixel-shuffled dataset. We found that, when
comparing the maps from two ResNets, Grad gets a validation accuracy of ∼ 60% (compared with ∼ 95%
unshuffled), SG gets ∼ 54% (compared with over 99%) and IG gets ∼ 54% (compared with with over 99%).
This suggests that the main component of the fingerprint comes from the spatial relationship between the
pixels.
Cross-comparison: Is there any commonality between the fingerprints in different primaries?
So far, we learned that Grad, SG and IG contain fingerprints of the primary network. The next natural
question is: do they contain the same types of fingerprints? To test this, we tested the accuracies of each
of the secondary networks with the test dataset from the saliency methods it was not trained with (results
shown in Table 1). High test accuracy of method A with a secondary model trained on method B implies
that fingerprints in method B also exists in method A.
Our analysis (Table 1) reveals complex relationships between methods. While some methods do share
fingerprints, despite the clear visual differences (shown in Figure 2), others don’t. Note than none of these
relationships can be extracted by visual inspections, at least to the authors.
First, we train secondaries to classify two primary networks, across different architectures (simple CNNs
and Resnet, left and the middle tables in Table 1). In both cases, Grad and IG seem to be use a shared, but
not identical fingerprint. Their fingerprints also exists in SG (i.e., high test accuracy with SG). This could
be explained by the fact that SG uses Grad as its main mechanism. However, what is surprising is that there

                                                  4
ICLR 2022 PAIR2 Struct Workshop
seems to be a type of fingerprint in SG that is different from the fingerprints in Grad and IG (i.e., low test
accuracy on Grad, IG). And this fingerprint in SG is a strong one; the secondary trained on SG gets the
highest accuracy. We discuss where this fingerprint might come from in the next section.
The results on PM were consistent: it does not contain fingerprints that could identify primary networks of
itself, or any other methods.
Now we give secondary networks a harder task (i.e., classify ten primaries, right table in Table 1). In order to
solve this harder task, SG now turn to the fingerprints that is shared with Grad and IG. This suggests that for
an unknown reason, the fingerprints SG relied on to identify 2 primary network is ”easier” or less complex
for SG to learn. Further studies are needed to validate this idea.
3 D ISCUSSION
The cross-comparison experiments suggest that Grad and IG use a similar set of features (i.e., their cross-
comparison performance is very similar). However, SG appears to have much less in common with Grad or
IG, which is why the performance is rather different.
Although the reason for the difference is not known at this time, we believe that the work of Seo et al. (2018)
provides a strong indication of where to look. This paper performed a Taylor Series expansion of SG in the
limit as the number of samples goes to infinity. They showed that the higher order terms can be written as
sums of products of moments of Gaussians and partial derivatives of the network. Note that these higher
order terms do not exist in Grad.
Since IG can also be written as a Taylor series with high order terms, the simple presence of these terms
does not guarantee that the features will be different. Further analysis of the role of the higher order terms is
required.
4 C ONCLUSIONS AND F UTURE W ORK
Despite numerous methods that can produce explanations are produced and an unified mathematical frame-
work Lundberg & Lee (2017), we yet to understand what makes up these explanations, and whether those
ingredients are shared across many methods. Our work is a preliminary step towards understanding using
a simple approach by training secondary networks with generated explanations. We show that a fingerprint
of the primary network strongly remains in gradient-based methods, but not in a perturbation-based method.
We also find that the kinds of finger prints in SG differs from other methods, and points to a potential con-
nection with a prior analytical work. Future work could extend to a wider range of saliency methods and
primary and secondary network architectures.
ACKNOWLEDGMENTS
We would like to acknowledge the support of Google Cloud.
R EFERENCES
Julius Adebayo, Justin Gilmer, Michael Muelly, Ian J. Goodfellow, Moritz Hardt, and Been Kim. Sanity
checks for saliency maps. CoRR, abs/1810.03292, 2018. URL http://arxiv.org/abs/1810.
03292.
Ruth C. Fong and Andrea Vedaldi. Interpretable explanations of black boxes by meaningful perturbation.
2017 IEEE International Conference on Computer Vision (ICCV), pp. 3449–3457, 2017.
5ICLR 2022 PAIR2 Struct Workshop
Alex Krizhevsky. Learning multiple layers of features from tiny images. Technical report, 2009.
Scott M Lundberg and Su-In Lee. A unified approach to interpreting model predictions. In
I. Guyon, U. V. Luxburg, S. Bengio, H. Wallach, R. Fergus, S. Vishwanathan, and R. Gar-
nett (eds.), Advances in Neural Information Processing Systems, volume 30. Curran As-
sociates, Inc., 2017. URL https://proceedings.neurips.cc/paper/2017/file/
8a20a8621978632d76c43dfd28b67767-Paper.pdf.
Weili Nie, Yang Zhang, and Ankit Patel. A theoretical explanation for perplexing behaviors of
backpropagation-based visualizations. In Jennifer Dy and Andreas Krause (eds.), Proceedings of the
35th International Conference on Machine Learning, volume 80 of Proceedings of Machine Learn-
ing Research, pp. 3809–3818, Stockholmsmässan, Stockholm Sweden, 10–15 Jul 2018. PMLR. URL
http://proceedings.mlr.press/v80/nie18a.html.
Google PAIR. Pair saliency. URL https://github.com/PAIR-code/saliency.
Junghoon Seo, J. Choe, Jamyoung Koo, Seunghyeon Jeon, Beomsu Kim, and Taegyun Jeon. Noise-adding
methods of saliency map as series of higher order partial derivative. ArXiv, abs/1806.03000, 2018.
Karen Simonyan, Andrea Vedaldi, and Andrew Zisserman. Deep inside convolutional networks: Visualising
image classification models and saliency maps. CoRR, abs/1312.6034, 2013. URL http://arxiv.
org/abs/1312.6034.
Daniel Smilkov, Nikhil Thorat, Been Kim, Fernanda B. Viégas, and Martin Wattenberg. Smoothgrad:
removing noise by adding noise. CoRR, abs/1706.03825, 2017. URL http://arxiv.org/abs/
1706.03825.
Mukund Sundararajan, Ankur Taly, and Qiqi Yan. Axiomatic attribution for deep networks. CoRR,
abs/1703.01365, 2017. URL http://arxiv.org/abs/1703.01365.
Stojan Trajanovski, Dimitrios Mavroeidis, Christine Leon Swisher, Binyam Gebrekidan Gebre, Bas Veeling,
Rafael Wiemker, Tobias Klinder, Amir Tahmasebi, Shawn M. Regis, Christoph Wald, Brady J. McKee,
Heber MacMahon, and Homer Pien. Towards radiologist-level cancer risk assessment in CT lung screen-
ing using deep learning. CoRR, abs/1804.01901, 2018. URL http://arxiv.org/abs/1804.
01901.
A A PPENDIX
6ICLR 2022 PAIR2 Struct Workshop
Figure 3: Maps for two resNet from our gradient-based saliency method. Left to right - Grad, SmoothGrad
and IntegratedGrad.
7You can also read