Salmon & White Rivers Flood Risk Assessment - Strathcona ...
←
→
Page content transcription
If your browser does not render page correctly, please read the page content below
Salmon & White Rivers
Flood Risk Assessment
Project # 2221-49200 | Revision 0 | April 4, 2019

McElhanney Consulting Services Ltd.        Contact: Mark DeGagné, P.Eng.
1196 Dogwood Street                        Branch Manager
Vancouver BC, V9W 3A2                      778-560-2001 | mdegagne@mcelhanney.com   2221-49200
1. INTRODUCTION

McElhanney Limited was retained by the Strathcona Regional District (the District) to complete a flood risk assessment
for the Salmon and White Rivers. The report has been developed to meet the requirements of the National Disaster
Mitigation Program (NDMP), Stream 1. Specifically, the report is structured around gathering the necessary information
to fill out the Risk Assessment Information Template (RAIT) and meet the requirements to pursue NDMP Stream 2
funding. In addition to the NDMP requirements, it is also intended that this report can be used to support the District
when developing their own initiatives including emergency preparedness planning, input into GIS systems, budgeting
for future investigations or mitigation and land use planning.

1.1.     SCOPE OF WORK
This project was completed utilizing funding from National Disaster Mitigation Program (NDMP). In recognition of
increasing disaster risks and costs, the Government of Canada is investing $200 million over five years for the NDMP.
The NDMP addresses flood risks and costs and builds the foundation for informed mitigation investments that could
reduce the effects of flood events in the future. Public Safety Canada established the NDMP in April 2015 to build a
body of knowledge on flood risks in Canada and invest in foundational flood mitigation activities. Activities include
developing a wider understanding of flood risks and employing effective mitigation strategies to reduce the impacts of
flooding.

Funding for the NDMP is allocated to recipients via four streams:

Stream 1 (Risk Assessments) provides funding for the completion of risk assessments to inform flood risks. Risk
assessments are the foundational step in disaster mitigation. These risk assessments will identify flood hazards,
potential impacts, and community and infrastructure vulnerabilities, as well as the overall flood risk profile for the area.

Stream 2 (Flood Mapping) provides funding for the development and/or modernization of flood maps. A flood map
identifies the boundaries of a potential flood event based on type and likelihood and can be used to help identify the
specific impacts of a flood event on structures, people and assets.

Stream 3 (Mitigation Planning) provides funding for the development and/or modernization of mitigation plans to
address flood risks. A comprehensive mitigation plan allows applicants to develop realistic and sustainable mitigation
solutions by clearly outlining the plan's objectives, key activities, expected outputs, timelines, and roles and
responsibilities.

Stream 4 (Non-structural and Small-Scale Structural Mitigation Projects) provides funding for other non-structural
and small-scale structural disaster mitigation projects. Eligible projects would include actions such as the replacement
of storm culverts, or projects that improve flood resilience by proactively preventing or mitigating damages and losses.

The Scope of Work for this assignment represents Stream 1 funded work. This report summaries the work that was
basis for the completed RAIT and Stream 2 application. The completed RAIT is included in Appendix A.

Salmon and White Rivers Flood Risk Assessment | 2221-49200-00                                                          Page 1
Prepared for Strathcona Regional District | Mr. Shaun Koopman, Protective Services Coordinator
2. BACKGROUND INFORMATION COLLECTION AND REVIEW

2.1.     INFORMATION REVIEWED
The risk assessment relies on existing information, including anecdotal and record information on historic flooding within
the community. This information is combined with other existing information such as GIS base mapping, current 200-
year floodplain mapping, Ministry of Environment historical records, building information, and infrastructure databases to
determine the risk of flooding to the community.

Floodplain modelling for the 200-year event was undertaken in 1980. This modelling does not extend to cover the
Village of Sayward but covers the Sayward valley immediately upstream of the village. The basis for this assessment
and the completion of the RAIT has therefore been historical flooding based on anecdotal information from the District
and community members.

The Regional District have previously mapped an approximate extent for the 2016 flood event which was also used in
the analysis of flood risk.

2.2.     PUBLIC CONSULTATION
Community engagement sessions were held on 4 and 10 December 2018 to engage with members of the public
regarding flooding that has been experienced in the past.

A total of approximately 20 residents attended between the two sessions, with feedback provided across the study area.
Residents and members of the community identified areas that have previously flooded, as well as the impacts of this
flooding as shown on the attached maps (Appendix B). Community members were asked to provide details on the dates
and extents of flooding that had been experienced as per the questionnaire in Appendix C.

Members of the public provided information on their own flooding experiences, with flood events in 1975, 1990, 2008,
2011, 2014 and 2018 specifically highlighted. A common theme in the discussion with members of the community was
the concern around emergency access during flood events as well as specific property level flood risk. This presents a
significant health and safety risk and is discussed later in this report.

It was apparent from the discussions with the public that the level of snow on the adjacent mountains and the speed at
which it melts, followed by heavy rainfall causes a concern with public perception of flood risk, as well as changing land
use in the surrounding area. Many residents also made reference to the impact of “King tides” on the level of flooding
that has been experienced.

Some residents have witnessed contamination of flood water such as oil and sewage and there were many references
to fast flowing water during flooding. These issues present both an environmental and health and safety concern, which
is discussed later in this report.

In addition to sharing their experiences of flooding, members of the public provided input into potential mitigation to
mitigate against/reduce the impact of potential flooding and these options will be assessed and reviewed as part of the
later stages of work outside the scope of this report.

Salmon and White Rivers Flood Risk Assessment | 2221-49200-00                                                       Page 2
Prepared for Strathcona Regional District | Mr. Shaun Koopman, Protective Services Coordinator
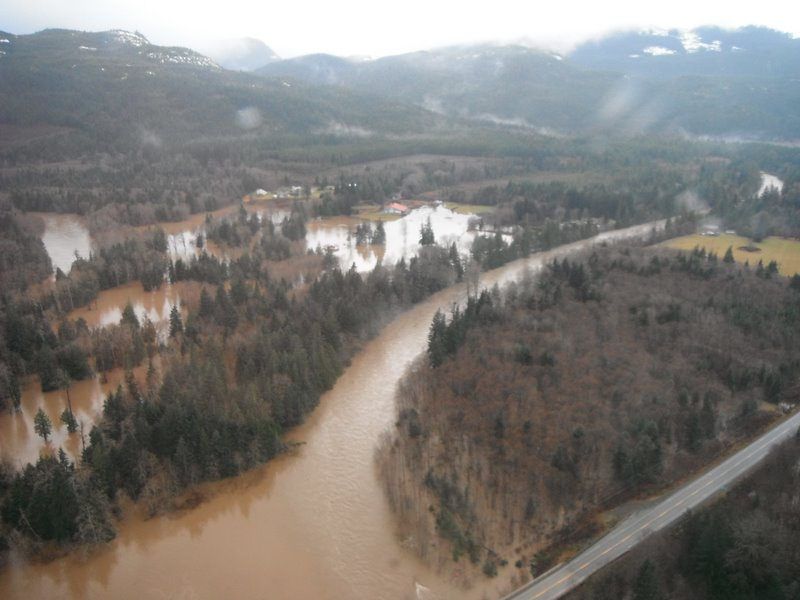
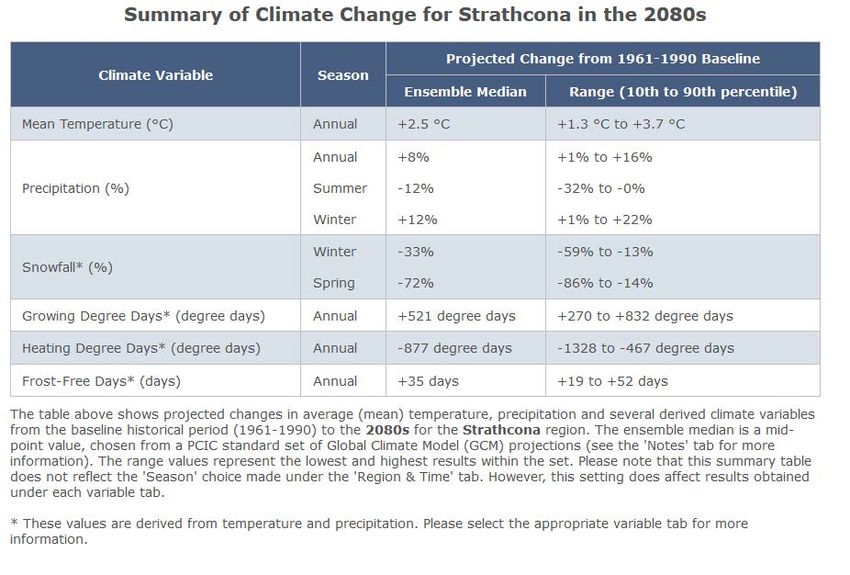
2.3.     HISTORICAL RECORDS OF FLOODING
Review of a Ministry of Environment document “Flooding and Landslide Events Southern British Columbia 1808-2006”
by D.Septer makes reference to flooding in the Sayward area in 1867, when a member of the Slocan band was
referenced in the Daily Colonist on June 23, 1894 as having experienced flooding where river levels in the Pend
d’Oreille River, near Sayward reached levels some 30ft above the high water mark reached during the 1894 flood.

The same report references a Louis Merigner, a Colville Valley farmer in the same newspaper as refencing flooding in
1877 in the Pend d’Oreille River, near Sayward, where water levels were as high as the 1882 level. The report
references the 1882 event in the Sayward area. The 1882 event occurred in June 7-14 1882. The report details that the
1867, 1877 and 1882 floods were all as a result of spring runoff.

The report highlights flooding experienced December 30- January 3, 1927, when rain on snow resulted in widespread
flooding in the area, specifically on January 4, warm rain melting snow in the mountains resulted in heavy flooding, with
the Sayward Valley experiencing a severe flood after the Salmon River overflowed its banks.

One flood of particular note that the report details is in 1949 (November 26 – December 3) when a Sayward resident
was drowned in a raging creek (unspecified name).

Additionally at the public consultation, there were anecdotal reports, photos & newsprint articles regarding flood events
in 1975, 1990, 2008, 2011, 2014 and 2018.The public consultation highlighted that these historical flooding events are
not restricted to forgotten “history” , with flooding occurring on a semi-regular basis, with most residents able to recall
several flood events which had personally affected either their properties, or their access in and out of the Sayward
valley.

2.4.     METEOROLOGICAL AND SEASONAL CONDITIONS
From the public consultation and the information provided by members of the community it is apparent that many of the
flooding incidents that have occurred are as a result of heavy rain following a period of high snowmelt and “King tides”
or a combination of both.

Although snowpack data for the flood events was not available at the time of this study, it is reasonable to conclude that
snowmelt provides a large contributing factor to the risk of flooding in the study area and it is recommended that a
regional hydrologic analysis is undertaken as part of the hydraulic modelling, including analyzing the risk from the
potential impacts of climate change. Engineers and Geoscientists of British Columbia and Provincial Jurisdictions such
as The Ministry of Forests, Lands, Natural Resource Operations and Rural Development, Ministry of Transportation and
Infrastructure and Ministry of Environment and Climate Change Strategy require that the potential effects of climate
change be considered in a design. To understand the changes to climatic conditions anticipated by 2080, it is
recommended that the Plan2Adapt tool that was developed and maintained by the Pacific Climate Impacts Consortium
(PCIC) is utilized. This tool generates maps, graphs, and data describing projected future climate conditions for various
regions within British Columbia. These are drawn from a set of 30 Global Climate Model (GCM) projections based on 15
different GCMs, each driven by two different greenhouse gas emissions scenarios. The emissions scenarios are the A2
(high) and B1 (low), which predict atmospheric concentrations of greenhouse gases in the year 2100 of approximately
1250 ppm and 600 ppm, respectively. The Plan2Adapt tool presents the median changes predicted by this ensemble of
model projections. The ensemble will predict a range of possible outcomes; the median is a robust estimate of the
central tendency of the ensemble members.

For the Salmon River watershed, it is estimated that precipitation as rainfall will increase due to climate change for the
Fall/Winter/Spring seasons by approximately 10% by the year 2080. Due to an increase in winter temperatures,
snowpack is expected to drastically decrease during this time. Due to the rain-on-snow, or rainfall during freshet
flooding which sometimes occurs, it is difficult to predict exactly how climate change may affect flooding in this area.

Salmon and White Rivers Flood Risk Assessment | 2221-49200-00                                                        Page 3
Prepared for Strathcona Regional District | Mr. Shaun Koopman, Protective Services Coordinator

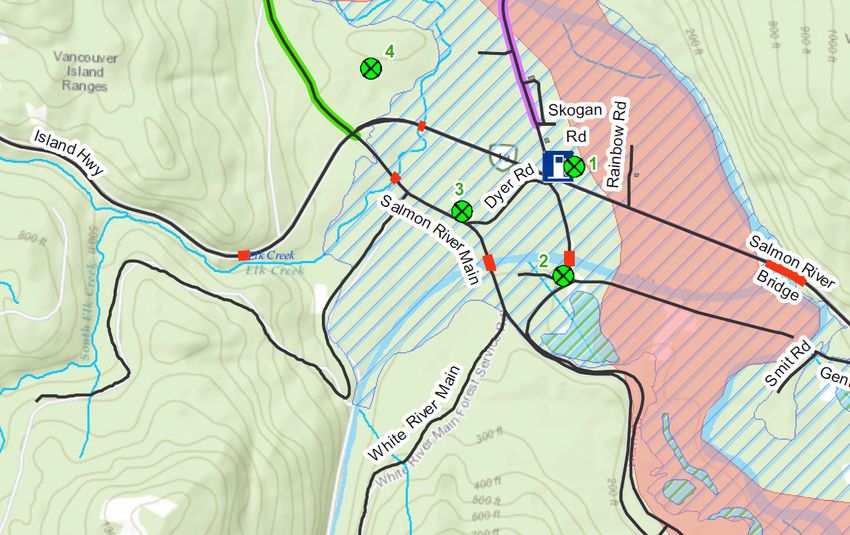
3. RISK ASSESSMENT

3.1.     RISK VS HAZARD
The EGBC guidelines on Flood Mapping in BC define Inundation Maps as “Topographic maps showing the extent of
floodwater in plan, under defined flood events”; Flood Hazard Maps as “Maps that go beyond inundation maps by
providing information on the hazards associated with defined flood events, such as water depth, velocity and duration of
flooding”; and Flood Risk Maps as “Maps that reflect the potential damages that could occur as a result of a range of
flood probabilities, by identifying populations, buildings, infrastructure, residences and the environment, cultural and
other assets that could be damaged or destroyed.”.

This report considers flood risk only; detailing modelling and risk analysis is proposed as part of the next stages of the
project, should funding be received.

The mapping produced as part of this report used the District’s base GIS data and the flood mapping data for the 200-
year flood event which was completed by the Provincial government in 1980. The information obtained from the public
consultation was also mapped onto the GIS base to identify trends and clusters of flooding which have been used in the
flood risk assessment below.

3.2.     RISK THRESHOLD
This section reviews the type of flood risk to Sayward resulting from periods of heavy rainfall and/or high snowmelt. The
most likely flooding is due to heavy local rainfall in the fall, winter or spring. This leads to a rapid onset of increased
water levels in the Salmon and White Rivers, and potential surcharging in local drainage systems. A similar likely cause
is a large freshet event in combination with a rainfall event, which could cause already high river levels to flood beyond
the river banks. However, it is estimated that climate change impacts over the coming decades will drastically reduce
the snowpack in this watershed, and therefore flooding will be more likely to occur due to short, intense rainfall events.

BC has not adopted a formal Flood Risk tolerance criteria and risk tolerance must be viewed over varying spatial
scales. For example, significant flood damage to a single home in an extreme flood may be tolerable to society, as this
constitutes hardship mainly to the homeowner and may not have a significant effect on society at large. However, if
many homes are impacted, losses are increasingly deferred to taxpayers. The 200-year event, along with a review of
historical flooding has been used as a basis for hazard assessment and this scenario will be examined in the risk
assessment as part of this study. However, the District is encouraged to consider establishing a tolerable limit for flood
safety (which would be standard-based and/or Risk based) for future development in the area.

Due to the limited level of hydraulic modelling that has been undertaken, the anecdotal historical evidence provided by
members of the public, combined with the approximate 2016 flood event mapped by the District and the 200-year
floodplain extent modelling were used as a basis for the impacts/consequence assessment. Should funding be received
to undertake hydraulic modelling, an assessment should be undertaken to identify the impacts of the smaller, more
frequent storm events versus the larger, less frequent storm events to identify the flood events to be modelled. It is likely
that the larger storms may only have slightly higher consequences and therefore the smaller storm events that cause
frequent flooding may have a greater impact. It is therefore recommended that the 5-year, 10-year and 100-year events
are modelled in addition to any others identified.

Salmon and White Rivers Flood Risk Assessment | 2221-49200-00                                                         Page 5
Prepared for Strathcona Regional District | Mr. Shaun Koopman, Protective Services Coordinator

3.3. IMPACTS/CONSEQUENCES ASSESSMENT
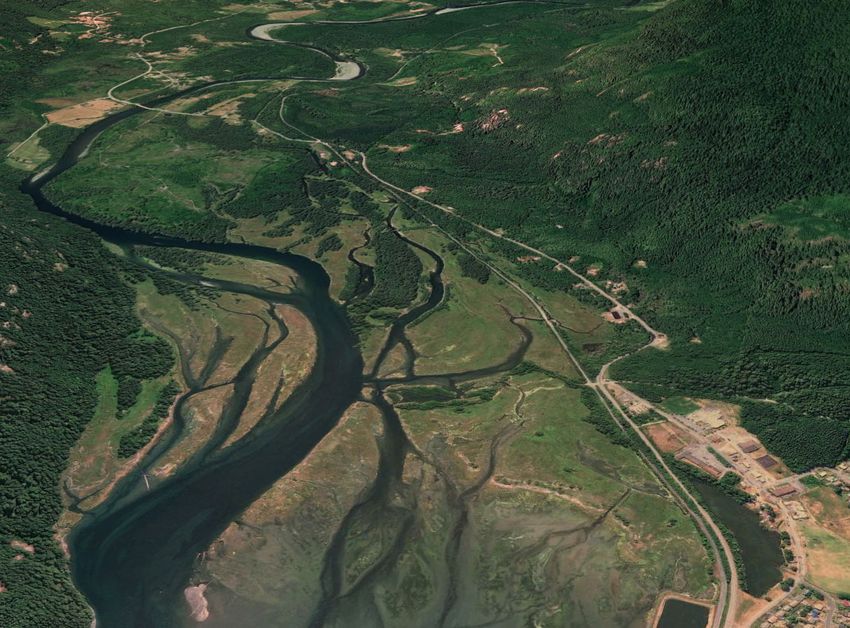
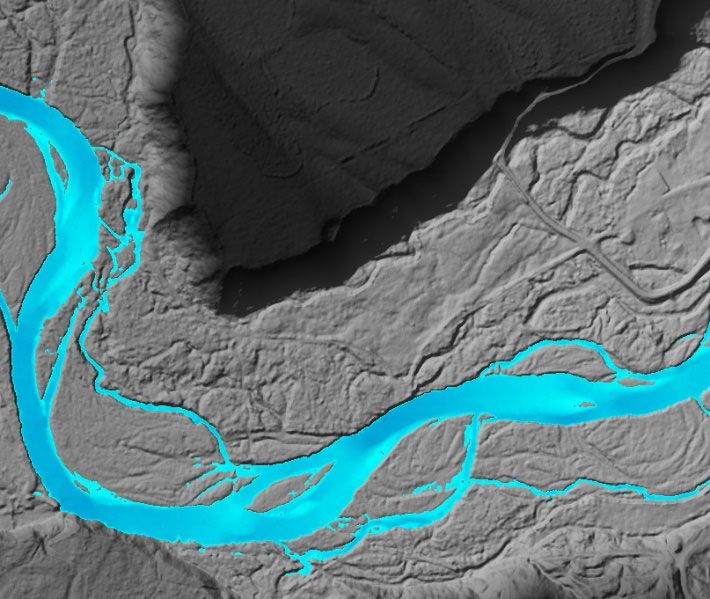
The area of inundation from the existing modelling does not extend to the centre of the Village of Sayward but includes
many residential areas including associated infrastructure. The study area includes residential and commercial
development, with associated infrastructure and roads. There are also schools, a hospital, conservation areas,
municipal buildings, library, campground, parks, and trails within the study area, many of which were highlighted in the
public consultation as having been affected by flooding.
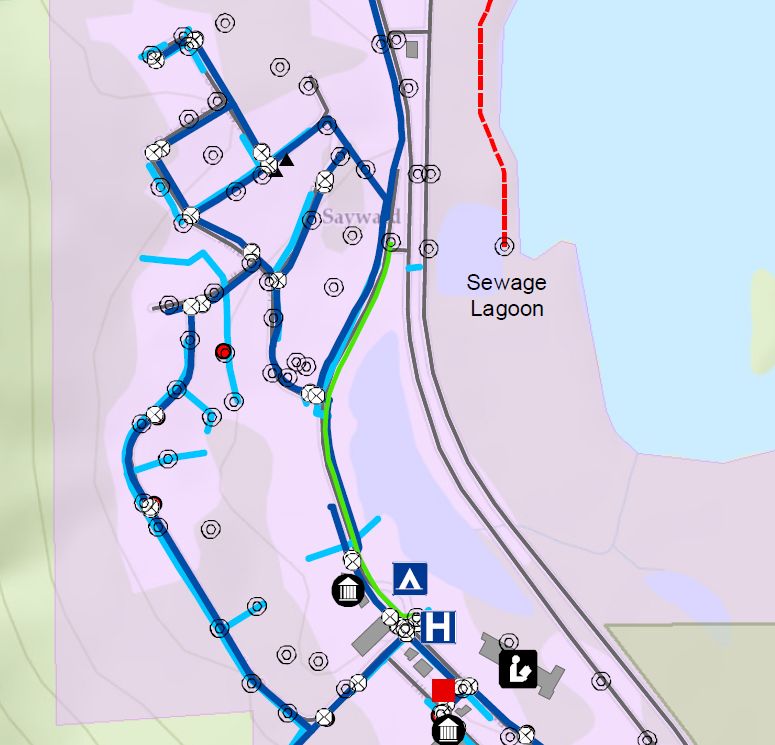
The attached maps show the areas that could be at risk during the 200-year event based on current modelling and
identify key infrastructure within Sayward that has been included in the flood risk assessment.
The risk assessment included a review of the following impact categories within 5 impact classes as presented by the
National Disaster Mitigation Program:
People and Societal Impacts
Fatalities
Injuries
Displacement
Environmental Impacts
Local Economic Impacts
Local Infrastructure Impacts
Transportation
Energy and Utilities
Information and Communications Technology
Health, Food, and Water
Safety and Security
Public Sensitivity Impacts
Each of these impacts has been assessed in the sections below, along with an explanation of the risk rating as
assigned in the RAIT.
3.3.1. People and Societal Impacts
It is a priority at the municipal, provincial and federal levels to protect the health and safety of Canadians. Impacts on
people are therefore considered pertinent in the assessment process given that natural hazards, such as the flooding
experienced in Sayward, can result in societal disruptions such as evacuations as well as injuries.
There are only 2 road accesses into the Village of Sayward and discussion with the District and community members
indicate that members of the community were stranded during the flooding experienced in 1975, with members of public
needing to be evacuated by helicopter from farm roofs and their homes, as well as in 1990 on Ryans Rd where people
were unable to get out of the area. In addition, community members explained that there are ongoing localized areas
becoming cut off for 1-3 days at extremely high water (Sayward Road and bridge) as roads became flooded. The
potential for road flooding presents a large concern for emergency access during times of flooding.
The public consultation also identified that when flooding does occur the water is often fast flowing, which presents a
danger to members of the public. People are at risk of suffering death or serious injury when flooding occurs, People
are unable to stand in deep or fast flowing floodwater. Once they are unable to stand there is a risk of death or serious
injury.
Salmon and White Rivers Flood Risk Assessment | 2221-49200-00 Page 6
Prepared for Strathcona Regional District | Mr. Shaun Koopman, Protective Services CoordinatorSampling and analysis of environmental media (soil, groundwater, surface water, or soil vapour) was not undertaken as
part of this assessment.
The ERIS database search noted 143 entries. Nine entries were noted in the SREG data, 16 in the EM data, 57 in the
WWIS data and 6 in the FCS data. All the 143 entries were evaluated for relevance to the assessment and in
conjunction with the Google Earth examination, targets were determined for examination during the site visit.
The site visit consisted of driving the Sayward Valley bottom from the Village to a few kilometers southeast of the
Sayward Road/Highway 19 intersection in the developed area of the Valley. Each of the targets identified were
assessed from the roadway or publicly accessible area. There was no access onto private properties.
Based on the information gathered and observations on the ground the following point-source Potential Flood
Environmental Hazards (PFEH) were identified:
Table 1: Potential Flood Environmental Hazards
Potential Flood Description and Location Hazard Description
Environmental
Hazard #
Underground fuel storage tanks and related
Co-op Gas Station at intersection of Sayward
1 Road and Highway 19.
dispensing facilities. Potential mobilization of
fuel contamination in water.
Sayward’s White River Resort on Sayward Underground fuel storage tanks and related
2 Road 0.5 km south of Highway 19 at Salmon dispensing facilities. Potential mobilization of
River Bridge. fuel contamination in water.
Western Forest Products yard on Salmon 4 above-ground fuel storage tanks and related
3 River Road 0.5 km southwest of Highway 19 dispensing facilities. Potential mobilization of
intersection. fuel contamination in water.
Former Sayward municipal landfill and Landfilling of municipal waste and industrial
4 MacMillan Bloedel ash landfill northeast of wood ash. Potential mobilization of metals and
Salmon River Road bridge over Highway 19. volatile organic contamination in water.
Additionally, it was also concluded that virtually all the houses, industrial and commercial operations up the Sayward
Valley to the east of the Village are on septic fields for sewage treatment. The septic fields are potential sources of both
chemical (nitrate/nitrite, ammonia) and biological (coliform) water contamination. Many of these sites will also have a
well for water supply as evidenced from the 57 hits in the WWIS database. The wells are not a source of water
contamination but may provide a conduit for contamination to enter the underlying aquifer. The general proximity of
each well to a septic field makes them significantly susceptible to contamination during a flood.
It is also noted that residences in the area may have heating fuel oil tanks, likely of the above-ground type. These tanks
constitute a potential source of water contamination and should be sealed and secured if possible, to prevent flood
waters from displacing the contents. Ideally, new tanks should be placed on a stand if they can be kept above flood
level on a site-specific basis.
Potential actions that can be pro-actively taken to minimize contamination issues include contamination source control
that can be undertaken for point sources such as the Underground Storage Tanks (USTs) identified in Table 1. This
may include ensuring that fuelling systems have appropriate shutoff systems, proper securing measures are present
(tie-downs, weighting) to keep partially empty tanks from floating, water-tight seals on filling ports and ventilation
Salmon and White Rivers Flood Risk Assessment | 2221-49200-00 Page 8
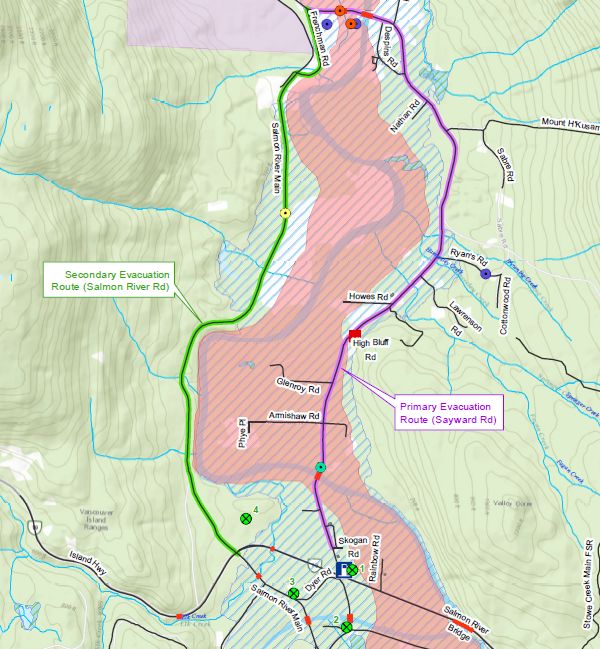
Prepared for Strathcona Regional District | Mr. Shaun Koopman, Protective Services Coordinator3.3.4. Local Infrastructure Impacts It is recognized that there are several local infrastructure components, that are fundamental to the viability and sustainability of a community. The NDMP therefore includes local infrastructure in the assessment process to identify components that may be at risk that would have a wider impact on the community. The area includes infrastructure such as roads, storm water infrastructure, and sanitary system infrastructure. Transportation Routes & Emergency Access Sayward Road is the main access into the Village of Sayward from the Island Highway. There exists only one alternate access, the Salmon River Main, which generally runs on the opposite side of the Sayward Valley. Based on review of the existing 200-year floodplain extent & discussion with residents, there are indications that both these roads are at risk of flooding and have flooded during past flood events. This can result in the village being completely cut-off from road access. In addition to the Salmon River Main, the Island Highway itself is also shown to be at risk in the 200-year extent. This is a vital north-south transportation corridor for Vancouver Island, and is the only road link for the Southern island to Sayward and the rest of Northern Vancouver Island. Although the Island Highway itself does not flood as often as Sayward Rd / Salmon River Main, it likely would be at risk during a large (200-year) flood event. A common theme throughout all of the public consultation was the risk of people being cut off or roads becoming inaccessible. Insufficient emergency access presents a great risk for emergency response purposes, as well as economic impacts as discussed above. The public consultation identified a number of bridges that have also experienced flooding, and in some cases, structural damage. These bridges are highlighted in red on the attached maps. Alternative access & evacuation plans should be considered by the SRD. Although anecdotal evidence from residents is that past (recent) flooding events have only resulted in short-term road blockages of hours, a larger flood event could restrict or cut-off access due to high water for days. If bridges are damaged/washed-out, this could extend to weeks. Alternative access/evacuation possibilities are water access or helicopter access. Given the far reaching and wide-scale disruption caused to the local infrastructure, the risk rating for transportation has been assigned as 5, the highest level as it is felt that this is the greatest risk to the local community. Communications, Energy & Utility Infrastructure During flood events there may be energy and utility disruption at an individual property level as service connections become flooded, although these impacts are likely to be restricted to the properties directly affected by the flooding. Based on anecdotal evidence from the public consultation there has been limited impact on energy and utilities during previous flooding. However, as there are likely to be energy and utility infrastructure within the affected area, we would estimate that although local activity may be disrupted for a short time, there is a potential that roads would also be flooded and hence access may be difficult for energy and utility providers to access properties to undertake repairs. The risk rating for energy and utility disruption has therefore been set as 2, duration of impact 13-24 hours. Any disruption to Information and Communications Technology (ICT) is likely to be at the property level, as individual property services become flooded. Wider impacts are not anticipated, therefore the risk assessment for impacts to ICT has been set as 1. The potential effect of contamination of floodwaters was previously discussed. It was highlighted during the public consultation that some properties that have been affected by flooding have onsite sewage disposal systems which are at risk of breaching into the floodwaters. This is in addition to the direct health impacts of the flooding listed above. As previously discussed, there have been incidents when people have been unable to evacuate due to inaccessible roads Salmon and White Rivers Flood Risk Assessment | 2221-49200-00 Page 10 Prepared for Strathcona Regional District | Mr. Shaun Koopman, Protective Services Coordinator
4. CONCLUSION & RECOMMENDATIONS
4.1. SUMMARY
The flood risk assessment for the Salmon and White Rivers through the Village of Sayward, which was commissioned
by the Strathcona Regional District, was prepared using available information, including flooding locations and
photographs. Historical information was used as a baseline for the assessment. It is clear from this anecdotal evidence
that the greatest risk posed is a lack of safe emergency access and egress during flood events. This lack of access has
the potential to impact most of the community, with previous incidents of evacuation from roofs required by helicopter.
There is a perception from the community that action is needed to mitigate against these risks.
Anecdotal evidence provided by residents indicates that the more frequent, smaller storm events cause frequent,
localized flooding within the community. It is these events that appear to have the most impact. Larger storms are likely
to have higher consequence; however, the information and analysis is not available to accurately quantify these risks.
The risk assessment included a review of the 12 impact categories within 5 impact classes as presented in the RAIT,
with a rating of 1 (least impacts) to 5 (greatest impacts) assigned as per the descriptions in the RAIT. The RAIT is
provided in Appendix A.
4.2. NEXT STEPS
The regional District should take the following actions to progress this risk assessment into a more detailed study that
can be used to identify potential mitigation options:
Undertake flood mapping to assess how the area would be affected by flooding events. This would identify the
geographical boundaries of several potential flooding events based on the type and likelihood of flooding. An
application for Stream 2 NDMP funding can be prepared to undertake this.
o As part of this exercise, update and extend existing floodplain modelling, to include the interaction with
tidal flooding. This help with planning for flood mitigation and also provides a tool for planning
purposes when assessing future development.
Review Sea Level Rise (SLR) estimates, gather estimates of storm surge and/or wave run-up, and compare
against the height around the sewage lagoon to determine the potential vulnerability to ocean inundation or
damage from storm events (independent from large flood events within the river);
Use the updated flood mapping to identify structures, people and assets that are within the flood zone that are
most likely to be impacted by the flood event and development site-specific response plans, targeted
information campaigns, etc.
Update this risk assessment with data from flood mapping to identify and classify potential hazards and
economic impacts of flooding.
Conduct a detailed assessment of the fuel storage tank locations, including residential fuel oil tanks, determine
what flooding safeguards are in place and what improvements, if any, are feasible.
Conduct a groundwater well location and condition survey to identify locations where the aquifer is vulnerable
to contamination via surface water intrusion.
Salmon and White Rivers Flood Risk Assessment | 2221-49200-00 Page 12
Prepared for Strathcona Regional District | Mr. Shaun Koopman, Protective Services Coordinator Conduct a detailed assessment of the former Sayward Municipal / Macmillan Bloedel ash landfill location to
determine the extent of vulnerability to floodwater intrusion and determine whether additional protection is
needed for this location.
Use updated flood modelling to identify safe emergency access and egress routes.
Liaise with external stakeholders, to discuss the potential flood risk.
Use the updated risk assessment to identify mitigation goals (Stream 3 funding from NDMP can be applied for
to undertake this). Identify objectives and strategies to meet these goals, including the identification of specific
mitigation projects.
A review of mitigation options should also consider the options for providing warning systems to alert residents
to potential upcoming flooding and provide information on evacuation routes.
Provide mapping to the public identifying evacuation routes, with the potential to provide this a “live” system
with real-time updates on road conditions and flooding levels.
Undertake a Return on Investment (ROI) analysis for proposed mitigation measures to identify preferred
option/s.
Undertake a public consultation on the proposed mitigation option/s.
Identify required geotechnical investigation to evaluate the soils conditions in the area and the potential impact
of this on flooding and proposed mitigation options.
Review potential funding sources (including Stream 4 NDMP) to implement preferred mitigation option/s.
Salmon and White Rivers Flood Risk Assessment | 2221-49200-00 Page 13
Prepared for Strathcona Regional District | Mr. Shaun Koopman, Protective Services CoordinatorUNCLASSIFIED
National Disaster Mitigation Program (NDMP)
Risk Assessment Information Template
Risk Event Details
Start and End Date Provide the start and end dates of the selected event, based on Start Date: 01/01/1975 End Date: 01/01/2018
historical data.
The risk event is not based on any one historical flood event. Instead it is a combination of
Provide details about the risk, including: anecdotal information, photos, etc. from past flooding events which have been combined
• Speed of onset and duration of event; to form the basis of the risk event for this assessment. Flooding includes events in 1975,
Severity of the Risk Event • Level and type of damaged caused; 1990, 2008, 2011, 2014 and 2018, as well as flooding that is experienced annually.
• Insurable and non-insurable losses; and Review of historical records indicate that flooding was experienced in the Sayward area
• Other details, as appropriate. back to 1867.
Further analysis is required to determine the exact causes of the flooding that is
experienced. The risk event tends to be due to heavy local rainfall, potentially in
combination with a freshet event. This would lead to a rapid onset of increased water
levels and velocities in the rivers. The risk event would result in local transportation and
access disruptions, which is the main concern for the local community, with previous
evacuation issues having been experienced and residents requiring evacuation by
helicopter from roof tops.
In addition to evacuation concerns, residents have reported that they have experienced
damage to property, particularly of driveways and in basements and crawl spaces and
loss of materials that are washed away during flood events.
The previous flooding that has been experienced has also resulted in mobilization of
contaminants, with residents reporting that they witnessed oil and sewage in flood waters.
Major disruption has been experienced to the road network. There are only 2 main roads
that connect Sayward to the surrounding area and flooding has been experienced on both
Provide details on how the defined geographic area continued its at different times. Some areas of the community have been completely cut off with
Response During the Risk Event essential operations while responding to the event. residents needing air evacuation from roof tops. Local road closures have been needed
and traffic detours put in place.
Residents have reported that bridges were inaccessible and some community members
were evacuated as there was concern that other routes would become inaccessible.
In some cases, roads have been inaccessible for up to three days and telephone
connections have been disrupted.
Page 1 of 20National Disaster Mitigation Program UNCLASSIFIED
Risk Assessment Information Template
Risk Definition Assigned
Rating risk rating
5 > 15% of total local population
Percentage 4 10 - 14.9% of total local population
of 3 5 - 9.9% of total local population 5
displaced
individuals 2 2 - 4.9% of total local population
1 0 - 1.9% of total local population
Displacement
5 > 26 weeks (6 months)
4 4 weeks - 26 weeks (6 months)
Duration of 3 1 week - 4 weeks 4
displacement
2 72 hours - 168 hours (1 week)
1 Less than 72 hours
There are only 2 road options into the town of Sayward and given the risk of inaccessibility of these potential routes, the affect of flooding would extend to the majority of the
Supplemental information local population. Depths up to 5ft of flooding have previously been experienced and hence recovery time is likely to extend into months, although this is mostly related to
(optional) infrastructure flooding. A long recovery period is expected because permanent, long-term repairs to roads and bridges generally takes months.
B) Environmental impacts
> 75% of flora or fauna impacted or 1 or more ecosystems significantly impaired; Air quality has significantly deteriorated; Water quality is
5 significantly lower than normal or water level is > 3 meters above highest natural level; Soil quality or quantity is significantly lower (i.e.,
significant soil loss, evidence of lethal soil contamination) than normal; > 15% of local area is affected
40 - 74.9% of flora or fauna impacted or 1 or more ecosystems considerably impaired; Air quality has considerably deteriorated; Water
4 quality is considerably lower than normal or water level is 2 - 2.9 meters above highest natural level; Soil quality or quantity is moderately 4
lower than normal; 10 - 14.9% of local area is affected
10 - 39.9% of flora or fauna impacted or 1 1 or more ecosystems moderately impaired; Air quality has moderately deteriorated; Water quality is
3 moderately lower than normal or water level is 1 - 2 meters above highest natural level; Soil quality is moderately lower than normal; 6 - 9.9 % of
area affected
Page 12 of 20National Disaster Mitigation Program UNCLASSIFIED
Risk Assessment Information Template
< 10 % of flora or fauna impacted or little or no impact to any ecosystems; Little to no impact to air quality and/or soil quality or quantity;
2 Water quality is slightly lower than normal, or water level is less than 0.9 meters above highest natural level and increased for less than 24
hours; 3 ‐ 5.9 % of local area is affected
1 Little to no impact to flora or fauna, any ecosystems, air quality, water quality or quantity, or to soil quality or quantity; 0 ‐ 2.9 % of local
area is affected
The local conservation area is at risk, During times of previous flooding, members of the local community has experienced oil and sewage present in floodwaters. There are
log dumps, sewage systems, the Town's sewage lagoon, a gas station, and many other potential sources of contamination present within the floodplain extents. Based on
anecdotal evidence of historical flood events, there have not been any catastrophic environmental impacts due to this type of flood event. However, the potential is present
Supplemental information and past performance is no indication of future outcomes, especially as infrastructure ages/deteriorates and development continues.
(optional)
C) Local economic impacts
Risk Definition Assigned
Rating risk rating
5 > 15 % of local economy impacted
4 10 ‐ 14.9 % of local economy impacted
3 6 ‐ 9.9 % of local economy impacted 5
2 3 ‐ 5.9 % of local economy impacted
1 0 ‐ 2.9 % of local economy impacted
Disruption to roads is likely to cause large-scale disruption that would affect not only local businesses, but also local residents. Anecdotal evidence indicates that local
residents have experienced significant economic damages in previous events. A long recovery period is expected because permanent, long-term repairs to roads and bridges
generally takes months.
Supplemental information
(optional)
Page 13 of 20National Disaster Mitigation Program UNCLASSIFIED
Risk Assessment Information Template
D) Local infrastructure impacts
Risk Definition Assigned
Rating risk rating
5 Local activity stopped for more than 72 hours; > 20% of local population affected; lost access to local area and/or delivery of crucial
service or product; or having an international level impact
4 Local activity stopped for 48 - 71 hours; 10 - 19.9% of local population affected; significantly reduced access to local area and/or delivery
of crucial service or product; or having a national level impact
Transportation 3 Local activity stopped for 25 - 47 hours; 5 - 9.9% of local population affected; moderately reduced access to local area and/or delivery of crucial 5
service or product; or having a provincial/territorial level impact
2 Local activity stopped for 13 - 24 hours; 2 - 4.9% of local population affected; minor reduction in access to local area and/or delivery of crucial
service or product; or having a regional level impact
1 Local activity stopped for 0 - 12 hours; 0 - 1.9% of local population affected; little to no reduction in access to local area and/or delivery of
crucial service or product
Infrastructure, particularly road access is considered to be the greatest risk to the local community. Roads have previously been totally cut off with residents requiring
emergency evacuation by helicopter. The town of Sayward has only 2 access roads to the link it to the local area, both of these routes have experienced flooding previously.
In addition, bridges have been identified as having flooded, with some structural damage experienced. Lack of access and egress into and out of the town impacts the entire
Supplemental information community, this has therefore been given the highest risk rating possible.
(optional)
5 Duration of impacts > 72 hours; > 20% of local population without service or product; or having an international level impact
4 Duration of impact 48 - 71 hours; 10 - 19.9% of local population without service or product; or having a national impact
Energy and Utilities 3 Duration of impact 25 - 47 hours; 5 - 9.9% of local population without service or product; or having a provincial/territorial level impact 2
2 Duration of impact 13 - 24 hours; 2 - 4.9% of local population without service or product; or having a regional level impact
1 Local activity stopped for 0 - 12 hours; 0 - 1.9% of local population affected; little to no reduction in access to local area and/or delivery of
crucial service or product
Page 14 of 20You can also read