Sapporo Group Business Results Presentation for the Nine Months Ended September 30, 2017 - November 2, 2017
←
→
Page content transcription
If your browser does not render page correctly, please read the page content below
Sapporo Group Business Results Presentation
for the Nine Months Ended September 30, 2017

                                                                 November 2, 2017

                                   URL http://www.sapporoholdings.jp/english

                                          Copyright, 2017 SAPPORO HOLDINGS LTD. All rights reserved.   1/43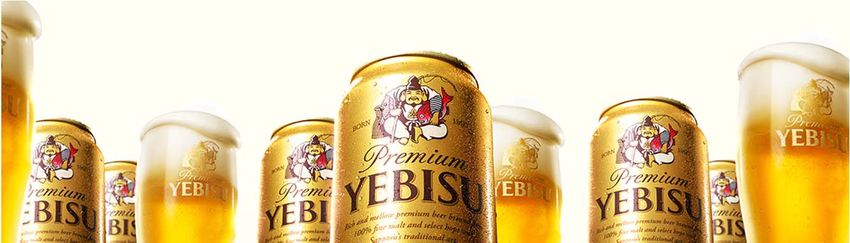
Contents

1. 2017 3Q Results            P3~21

Appendix:Collection of Data by business   P22~42

                                              Copyright, 2017 SAPPORO HOLDINGS LTD. All rights reserved.   2/43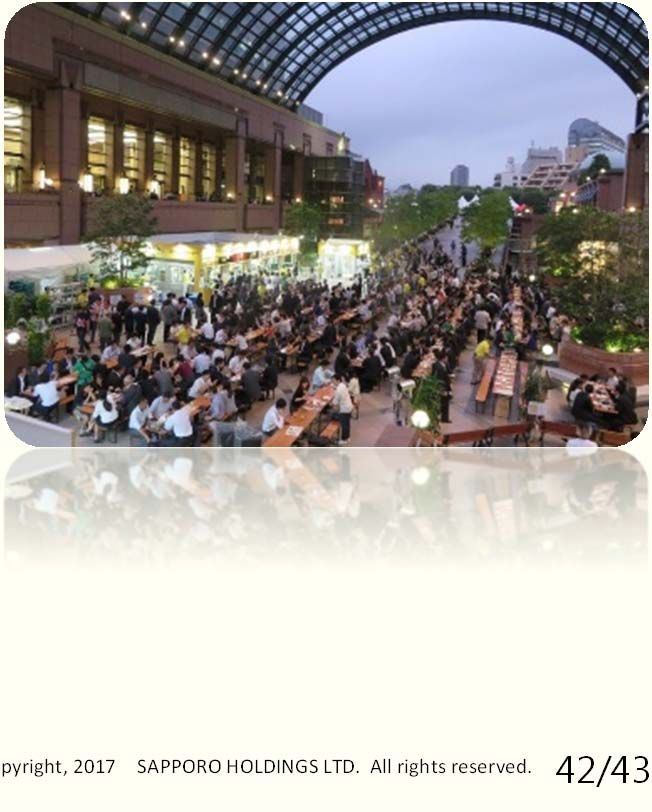
(billions of yen)

                                                2016 3Q       2017 3Q
                                                                                        YoY changes
                                                                                        (amount, %)
                Net sales (incl. liquor tax)         392.2      400.8                         8.5               2.2%

                 Net sales (excl. liquor tax)        307.7         315.9                        8.2             2.7%

                 Overseas net sales to total
                 (excl. liquor tax)               21.0%         21.3%                        0.3%                       -

                Operating income                      12.8        10.7                   (2.1)             (16.7)%
Third Quarter   Operating income before
     2017       goodwill amortization                 15.8          13.6                     (2.1)         (13.8)%

  Highlight     Ordinary income                       11.5          10.2                     (1.3)         (11.4)%
                Profit attributable to owners
                of parent                               5.2         5.4                       0.1               2.9%

                Balance of Net debt                  215.1         225.4                    10.2                4.8%

                D/Eratio        ※Net            1.4 times     1.3 times                    (0.1)                        -

                EBITDA                              32.3          31.0                        1.2            (3.8)%

                                                                      Copyright, 2017 SAPPORO HOLDINGS LTD. All rights reserved.   3/43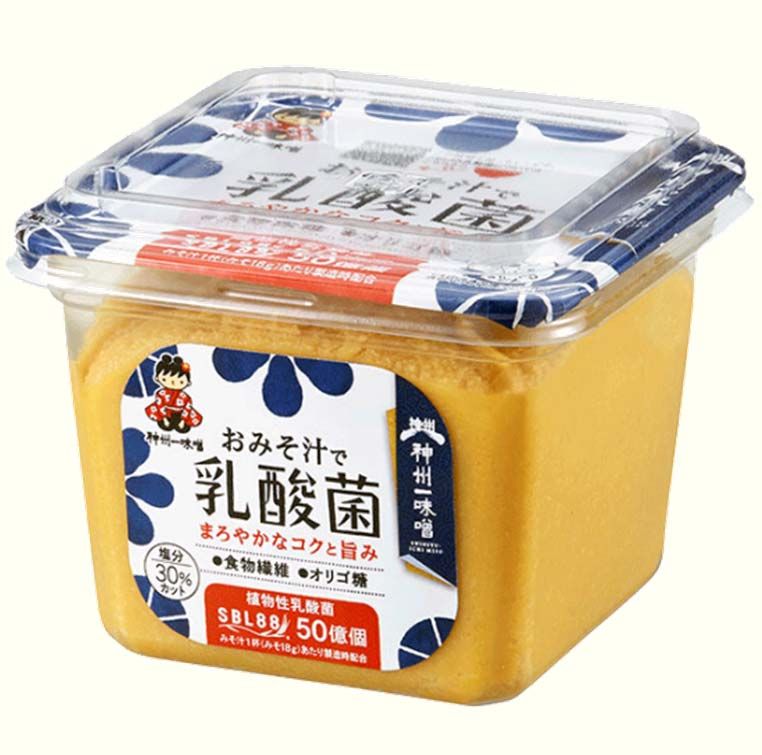
Third-Quarter 2017 Group Results Overview
(billions of yen)
Net sales
YoY Change
Businesses on which we’ve been focusing such as beer,
North American alcoholic beverages, lemon-based
products and soups continue to produce results. Real
estate is also maintaining steady earnings.
Third Quarter On the other hand, both sales and profits at SSC in the
Operating income North American soft drinks business and Singaporean
2017 Highlight YoY Change
soft drinks business have been declining
Also, given the impact of unseasonal weather in
summer, results of some businesses fell short of the
plan, but we will continue to aim to achieve the targets
and give priority to what each business should be
Profit attributable to preparing in the first fiscal year of the Medium-Term
owners of parent YoY Change Management Plan, and to necessary investments and
reinforcement of the group’s management platform.
*SSC: Silver Springs Citrus Copyright, 2017 SAPPORO HOLDINGS LTD. All rights reserved. 4/43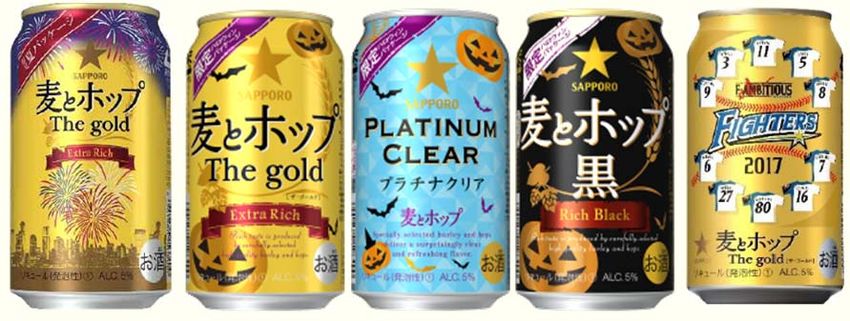
(billions of yen)

                                                                            YoY changes
                                      2016.3Q    2017.3Q
                                                                            (amount, %)
               Consolidated
               Net sales                392.2                                                  2.2%
                 Japanese Alcoholic
                 Beverages              200.0                                             (0.2)%

                 International           48.0                                                   6.3%
Net Sales by
 Segment         Food & Soft Drinks     101.5                                              (0.1)%

                 Restaurants             21.0                                                   5.2%

                 Real Estate             16.7                                                   7.3%
                 Other                     4.7                                              77.9%
                                                           Copyright, 2017 SAPPORO HOLDINGS LTD. All rights reserved.   5/43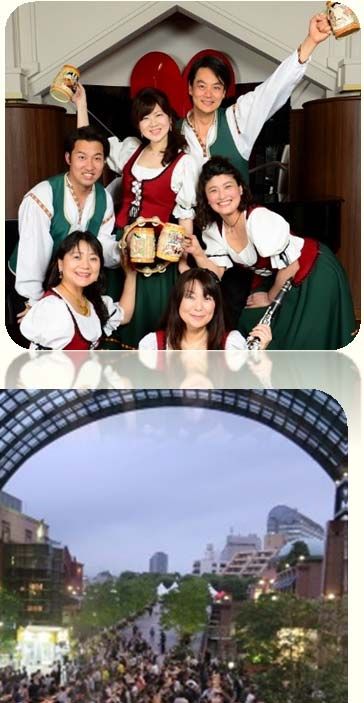
・Sales increase in beer in Japan, diversification and North American
                   alcoholic beverages contributed
                  ・Net increase in Ginza Place (from last September) and new consolidated business*
                                      Japanese Alcoholic                             Food & Soft
                                          Beverages                International       Drinks         Restaurants            Real Estate

                                                                                                                                                                       2017
                                                                                                                                                                        3Q
                  (billions of yen)

 Main Factors
Contributing to                         Diversification:    2.3

   Changes                              Subsidiaries, etc.: -1.3

 in Net Sales     2016
                   3Q
                                                                                   Overseas: -0.4
                                                                                   Café, etc.: +0.3

                                                                                                                                                       = Increase

                                                                                                                                                       = Decrease

                         *Marushinkawamura, Shinsyu-ichi Miso                                            Copyright, 2017 SAPPORO HOLDINGS LTD. All rights reserved.   6/43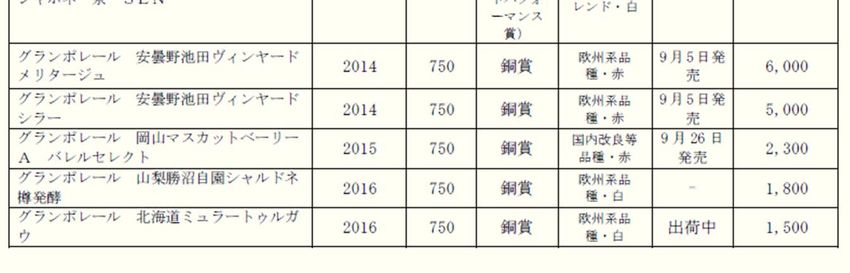
(billions of yen)

                                                2016 3Q         2017 3Q                       YoY changes

                   Consolidated
                   operating income                 12.8
                        Japanese Alcoholic
                        Beverages                     6.3
                        International                 0.7
                        Food & Soft Drinks            0.6
                        Restaurants                   0.5
Operating Income        Real Estate                   8.0
  by Segment
                        Other                        (0.1)
                        General corporate and
                        intercompany                 (3.4)
                        eliminations
                    Amortization of goodwill          2.9                                                   (0.0)
                          International                   1.2                                                  (0.0)
                        Food & Soft Drinks                1.6                                                  (0.0)
                   Operating income before
                   goodwill amortization            15.8                                                    (2.1)
                                                                      Copyright, 2017 SAPPORO HOLDINGS LTD. All rights reserved.   7/43
・Decline in profit widens at happoshu, new genre and overseas soft drinks
                  ・Operating income declined due to temporary M&A cost in addition to
                   investment in management platform
                                      Japanese Alcoholic                                                 Food & Soft                            Real
                                          Beverages                     International                      Drinks         Restaurants          Estate

                  (billions of yen)

                  2016
                   3Q
                                                                    Volume increase: +0.0
                                                                    Product mix, COGS: -0.2

 Main Factors
Contributing to
   Changes
 in Operating                                    Sales

    Income                                       promotion: -0.7
                                                 Facilities: +0.1
                                                                                               Volume, product mix:
                                                                                               +0.9
                                                 Personnel, etc.:                              Production cost: +0.4                                                                 2017
                                                 -0.4                                                                                                                                 3Q
                                                                    Anchor acquisition cost:
                                                 Other: -0.2        -0.4

                                                                                                                                                                     = Increase

                                                                                                                                                                     = Decrease

                                                                                                                       Copyright, 2017 SAPPORO HOLDINGS LTD. All rights reserved.   8/43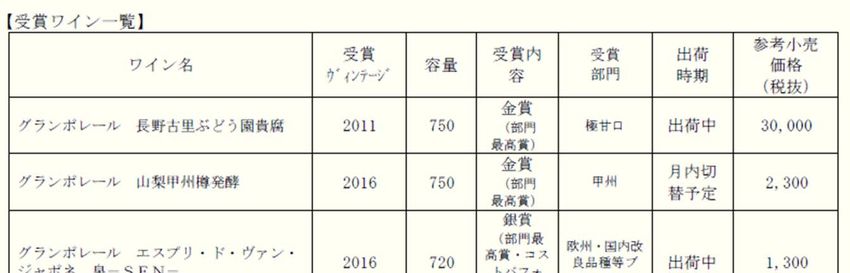
Overview of Each Business

                            Copyright, 2017 SAPPORO HOLDINGS LTD. All rights reserved.   9/43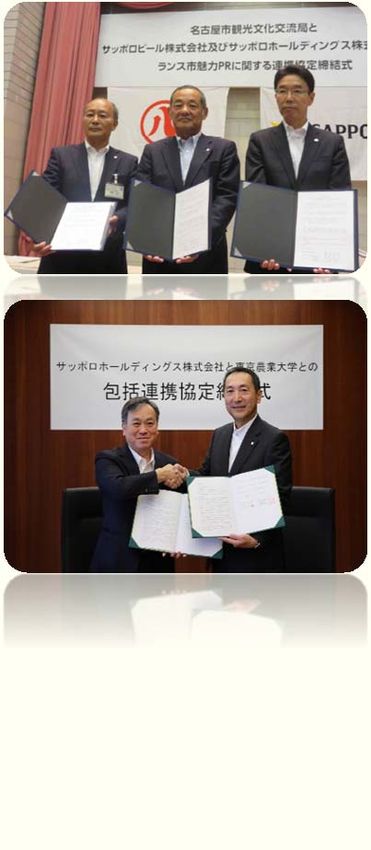
・Beer and diversification have been strong amid declining
total demand due to unseasonal weather and store price rise
・Promoting change in sales composition
Japanese Alcoholic
Beer continued to be firm
Beverages Positive
(Black Label sales volume % y-o-y, Yebisu % y-o-y, beer total % y-o-y)
(billions of yen)
YoY
Sales
change
Product mix improvement progressed
(Beer’s component ratio among beer and beer-type beverages increased from 60% in FY2016 3Q ⇒
% in FY2017 3Q
Sales of Wine, Spirits, Japanese liquors and RTD continue to be
RTD, wine,
strong
Happoshu,
Beer Japanese liquor,
new genre
etc. (Sales of wine business % y-o-y, those of spirits business % y-o-y)
Operating YoY
income Change
Sales during the peak season was significantly affected by
unseasonal weather and increase in store price
Fixed cost,
(Jan-June beer and beer-type beverages % y-o-y → slowed to % y-o-y in July-September)
Beer sales Happoshu, Product mix,
new genre nonalcoholic sales
volume Wine, spirits
sales volume beer, RTD, promotion
increase
production cost, cost
etc.
Sales decline in happoshu, new genre
(Reference) *Estimates
(Mugi to Hop brand % y-o-y, Goku Zero brand % y-o-y)
Beer down 2%
Total : Happoshu down 4% Negative
demand *See Appendix in slides 23 to 29.
New genre down 1% Copyright, 2017 SAPPORO HOLDINGS LTD. All rights reserved. 10/43・North American alcoholic beverages, CPF are strong;
Work on issues regarding Vietnam, SSC
International Positive Despite stagnation in the market, both Sleeman and Sapporo USA
(billions of yen) showed growth trend
YoY (Sales volume at Sleeman y-o-y, Sapporo brand at Sapporo USA %)
Sales
change
CPF continued to be strong with Side Kicks (sherbet) also
contributing
North
American North American
alcoholic soft drinks
Vietnam Exports, other Exports to South Korea and Taiwan grew significantly with sales
beverages
nearly doubling y-o-y
Operating YoY While sales declined in Vietnam, we prioritized and pursued structural
income change
reform such as review of sales promotion investment and production
transfer
To implement measures for Tet (lunar New Year) selling season
Volume change,
product mix,
production cost,
Fixed cost, etc. in
North America, Vietnam
Sales of SSC stagnated and its production efficiency worsened amid
etc. in North
America, etc.
etc.
adverse environment reflecting decline in demand for orange juice in
(Reference) *Estimates the U.S. and high COGS.
Canadian beer
Total : down about 2%
→To work on issues as it advanced preparation for integration with
Negative *See Appendix in slides 30 and 32.
demand U.S. beer CPF * CPF: Country Pure Foods
down about 2% Copyright, 2017 SAPPORO HOLDINGS LTD. All rights reserved. 11/43
SSC: Silver Springs Citrus・While sales of Japanese mainstay brands increased,
overseas risks were exposed
Food & Soft
Lemon-based products led the performance; tea drinks with rare
Drinks Positive ingredients also maintained strong sales
(billions of yen)
(Lemon-based soft drinks sales volume % y-o-y, lemon-based food products %, tea drinks %)
YoY
Sales change
Soups steadily increased sales and their profitability also improved
thanks to measures ensuring appropriate selling price in 2016
(Soups sales volume % y-o-y)
Japanese Overseas
food & soft
drinks
food & soft
drinks, café
Cost improvement of aseptic bottling lines generated billion yen
Operating YoY
income change
Sales of coffee drinks continued to decline y-o-y as canned coffee
market shrinks
Sales
increase, Business performance in Singapore continued to be slow
product mix,
etc. at
Japanese
Sales promotion Other fixed Overseas, café
cost costs, etc. , etc. Export sales slowed due to sugar tax in some countries
food & soft
dinks Overseas performance is weighing on overall revenue;
(Reference)*Estimates
Domestic soft drinks trying to take quick action
up
Total Lemon-based products
: Negative *Total demand data:
Source *See Appendix in slides 33 to 37.
demand up – Inryou-souken and Intage SRI Lemon-based products market (Sapporo’s definition)
Instant soups up Total for SM CVS formats in the instant soup market:
Jan-Sep 2017 y-o-y comparison of cumulative sales amount
Copyright, 2017 SAPPORO HOLDINGS LTD. All rights reserved. 12/43・Sales expanded but personnel cost weighed on earnings
Existing store sales of parent Sapporo Lion were strong despite
unseasonal weather in summer
Restaurants Positive (Comparable-store sales y-o-y)
(billions of yen) Marushinkawamura contributed to sales.
Aburiya format has been strong
YoY (As consolidation started in June 2016, Jan-May sales were net increase)
Sales change
Yebisu Bar Hiroshima, Shin Yokohama outlets opened in 1Q are
thriving, contributing to earnings
→ Contribution to Yebisu brand
COGS ratio in control with menu measures despite foodstuff price
Lion, etc. Marushinkawamura increase
Operating YoY
income change
Personnel costs of part-timers have increased
Situation in Singapore continues to be difficult
Existing restaurants,
new openings,
refurbishment, etc.
Negative *See Appendix in slide 39.
Copyright, 2017 SAPPORO HOLDINGS LTD. All rights reserved. 13/43・Stable operation of mainstay properties;
Progress in line with plan
Real Estate Positive Yebisu Garden Place (YGP) maintained stable occupancy rate
(Jan-Sep office occupancy rate %)
(billions of yen)
YoY
GINZA PLACE contributed to earnings (started operation in
Sales
change September 2016)
(Jan-Sep occupancy rate %)
Sapporo Factory and other properties in Sapporo also have been
Yebisu Garden
Ginza Place, etc.
strong
Place
Operating YoY
income change
Nothing to mention in particular
Yebisu Garden
Ginza Place, etc.
Place
Negative *See Appendix in slide 40.
Copyright, 2017 SAPPORO HOLDINGS LTD. All rights reserved. 14/43・Difference in consolidated period of 2 group companies
Impact of exchange rates negligible
(- = negligible)
(YoY)
Impact on
Impact on
Business segment Details operating
sales
income
Marushinkawamura Inc.: consolidation began Approx.
Restaurants in June 2016
-
¥0.8 billion
Approx.
Special Factors Other
Shinsyu-ichi Miso Co., Ltd.: consolidation began in
October 2016 ¥4.0 billion
-
in the Business
Results
(- = negligible)
Impact on
FY2016 3Q FY2017 3Q Impact on
operating
sales
income
US$ ¥108.59 ¥111.89
Japanese
EUR ¥121.10 ¥124.58 Alcoholic - -
Beverages
CAN$ ¥82.09 ¥85.66 -
International ¥1.7 billion
SG$ ¥79.15 ¥80.53 Food & Soft - -
Drinks
Copyright, 2017 SAPPORO HOLDINGS LTD. All rights reserved. 15/43Promoted asset efficiency
(billions of yen) 2016 3Q 2017 3Q Change Factors contributing changes
Operating income 12.8 10.7 (2.1) -
Financial account balance (0.7) (0.5) 0.2 -
Other non-operating
income/expenses (0.6) 0.0 0.6 -
Changes in Ordinary income 11.5 10.2 (1.3) -
Extraordinary Gains on sales of property,
0.0 0.2 0.2 -
plant and equipment
Gains and Other extraordinary gains 0.0 0.7 0.7
Sale of shares held in cross-
shareholdings
Losses Loss on sale/disposal of
property, plant and equipment (1.2) (0.7) 0.5 -
Impairment loss (0.5) (0.3) 0.2 -
Other extraordinary losses (0.3) (0.3) 0.0 -
Profit before income taxes 9.6 9.9 0.3 -
Corporate tax, loss attributable
to non-controlling interests (4.3) (4.6) (0.2) -
Profit attributable to
owners of parent 5.2 5.4 0.1 -
Copyright, 2017 SAPPORO HOLDINGS LTD. All rights reserved. 16/431.5 billion yen decline y-o-y in total assets
Cash and cash Total assets
equivalents (billions of yen)
10.5 13.0
10.5
Trade receivables 12.1 12.4 13.2 9.4
Current
96.8 81.7
64.3 74.8 68.4 78.9 assets
→Impact of seasonal factors, etc. 71.2
37.9 42.8
41.2 41.1 40.6 40.7 42.0
18.7
Inventory 17.0 16.7 15.5
18.7 19.5 19.0
Changes in
Balance Sheets Current assets, etc.
346.2 356.0 352.2 356.2
344.2 346.4 352.7 Fixed
assets
Fixed assets
Goodwill
29.2 28.8 27.6 27.4 26.2 25.3 32.2
→Acquisition of Anchor (7.8 billion yen)
*Its goodwill is tentative amount 79.8
79.3 76.5 77.4 78.7 73.6 77.9
Investments, etc.
2016 1Q 2016 2Q 2016 3Q End of 2017 1Q 2017 2Q 2017 3Q
FY2016
Copyright, 2017 SAPPORO HOLDINGS LTD. All rights reserved. 17/43Total liabilities down by 7.0 billion yen,
total net assets down by 5.5 billion yen
Total liabilities,
total net assets
Accounts payable
(billions of yen)
Short-term bank liabilities 38.5 37.3
36.2
→Increase in short-term borrowings 34.6 37.8 38.8 35.8
73.4 88.8
Deposits received 66.2 78.8 Current
94.8 8.2 79.0
101.4 7.1 liabilities
7.5 8.4
8.8
8.5 91.9
Current liabilities, etc. 10.2 82.2 84.0 88.5
Changes in 71.8 80.9
74.0
Balance Sheets Long-term bank liabilities
→Decrease in long-term borrowings 164.7 152.8 149.7
162.2 154.2 Long-term
138.2 143.9
(billions of yen) Net defined benefit liability liabilities
Balance of net debt 8.9 8.2
6.8 8.6 8.3
7.2 6.9
(comparison with Long-term liabilities, etc. 74.1 70.4 71.6 72.9
71.2 70.4 72.5
end of FY2016)
(comparison with
2016 3Q) Shareholders' equity
140.1 137.4 142.6 Net assets
128.6 131.0 135.8 134.9
Accumulated other
20.4 15.0 14.7 20.5 19.1 22.8 24.1
comprehensive income 5.5 5.1 5.1 5.6 5.5 5.1
D/Eratio 5.2
Non-controlling interests 2016 1Q 2016 2Q 2016 3Q End of 2017 1Q 2017 2Q 2017 3Q
FY2016
*Net Copyright, 2017 SAPPORO HOLDINGS LTD. All rights reserved. 18/43Cash basis investment totaled 29.3 billion yen
(billions of yen)
45.0
① about ¥ billion in
consolidated total
40.0 Cash flow from investment
(tangibles, intangibles)
activities:
35.0 - “Alcoholic Beverages,” “Food” and “Soft Drinks” –related:
billion yen
about ¥7.2 billion
5.8 planned in four years
(Nasu Brewery one-way bottle-related work, etc.)
30.0 (35.1 billion yen planned
in 2017 full-year) - Real Estate-related: about ¥2.3 billion
(Boosting value of YGP, etc.)
Financial Status 25.0
- SGM Group infrastructure streamlining, etc.: about ¥1.5 billion
*SGM: Sapporo Group Management Ltd.
② about ¥ billion in consolidated total
20.0 40.2
③ about ¥ billion in
consolidated total
15.0 29.5 31.0 29.3 (Long-term prepaid expense, subsidiaries’ shares, investment
securities, etc.)
10.0
-Long-term prepaid expense (Japanese Alcoholic
Beverages/Food & Soft Drinks) about ¥2.7 billion
5.0 -Acquisition of Anchor: about ¥11.5 billion
①+②+③
0.0 (cash basis, including current capital expenditure and lease fees)
2014 2015 2016 2017 2018 2019 2020
(full year) (full year) (full year) (3Q) about ¥ billion
Copyright, 2017 SAPPORO HOLDINGS LTD. All rights reserved. 19/43Promote initiatives for transformation of
the Group management platform
- Established Delicious Taste Technology Research Center
in first quarter
R&D - Pursue measures for creating values in food
- Started health survey research related to lemon in
Osakikamijima-cho in Hiroshima Prefecture
- Started trial run of new system for work style improvement
Transformation Personnel, - Promoted hiring and nurturing of diverse human resources
of the Group human including global human resources
- Drafting of the Health Creation Declaration
management resources
- Concrete measures for reviewing the strategic cross-
platform shareholding formulated in the first quarter
- Started implementation according to the contents of the
Finance drawn up measures from the second quarter
- Started selling part of the cross-shareholding in 3Q
(proceedings from the sale: ¥0.7 billion was recorded)
- Promote utilization of AI (artificial intelligence) technology
*Utilization in handling of internal inquiries
Others *Utilization in grape cultivation at own winery
*Utilization in document-based selection in new graduate hiring process
Copyright, 2017 SAPPORO HOLDINGS LTD. All rights reserved. 20/43Personnel,
human
resources Sapporo Group Health Creation Declaration
-Strengthening initiatives to maintain and enhance the health of all group employees-
[Sapporo Group Health Creation Declaration]
1. People are the bearers of a business
You can take on challenges in a new field and cross the finishing line with a cheerful
and positive attitude only because you are healthy both physically and mentally.
The business grows because its employees are healthy and this in turn leads to the
companyʼs growth.
2. Sapporo Groupʼs business and health are directly related
The business of “Alcoholic Beverages,” “Food” and “Soft Drinks” contributes to
Transformation customersʼ physical and mental health and happiness.
We believe that employees, who create and offer the products, being physically and
of the Group mentally healthy is a proof that our products and services can offer happiness to our
customers.
management 3. Being an attractive place of work leads to sustainability as a company
platform Employees spend lots of time at the workplace. A workplace that works proactively to
enhance and maintain employeesʼ health will be attractive to existing and future
employees and this leads to sustainability as a company.
We hereby make the Health Creation Declaration based on the conviction that the
physical and mental health of the Groupʼs human resources leads to creation of
happiness for our employees, their family and the company.
[Key initiatives]
Allocate public health nurses to each area to enhance healthcare structure
Further enhance measures to promote and support employees taking medical checkup so as to achieve 100% rate in employees
aged 40 years and above taking medical checkup for lifestyle-related diseases and those who were identified as requiring
emergency treatment in regular health checkups are seeing doctors
Introduce healthcare app for employees, promote health enhancement events utilizing group products such as Pokka Lemon 100
Utilize various health-related data
21/43
Copyright, 2017 SAPPORO HOLDINGS LTD. All rights reserved.Appendix
Copyright, 2017 SAPPORO HOLDINGS LTD. All rights reserved. 22/43Major sales & sales volume
Appendix -
Copyright, 2017 SAPPORO HOLDINGS LTD. All rights reserved. 23/43【Beer】
(sales volume) <Y-o-y change in sales volume of
3 core brands>
Jan-Sep up % y-o-y (total demand down 2%) 115
Black Label Brand total up % y-o-y 110
(Sales of the canned version:up % y-o-y) 105
Yebisu Brand total up % y-o-y 100
95
【Happoshu+new genre】
(sales volume) Jan Feb Mar Apr May Jun Jul Aug Sep
Appendix Jan- Sep down %
Total beer demand Sapporo total
Japanese Alcoholic Black label Yebisu
(total demand down 2%)
Beverages
Mugi to Hop Brand total down % y-o-y
115
Goku Zero Brand total down % y-o-y
110
105
【Wine , Spirits and other】(sales value)
100
Wine:up % y-o-y
95
RTD : up % y-o-y 90
Jan Feb Mar Apr May Jun Jul Aug Sep
Spirits:up % y-o-y Total new genre demand Mugi to Hop
Japanese liquor:up % y-o-y
Copyright, 2017 SAPPORO HOLDINGS LTD. All rights reserved. 24/43(10,000 cases)
<3 core brand Jan- Sep Sales volume change>
1,400
1,200 <Beer lineup (Jan – Sep breakdown>
13%
1,000
Appendix
Japanese Alcoholic 800
Beverages
600
56%
400
30%
200
Black label Yebisu Other
0
2011 2012 2013 2014 2015 2016 2017
Black label brand total Yebisu brand total Mugi to Hop brand total
Copyright, 2017 SAPPORO HOLDINGS LTD. All rights reserved. 25/4310 (billions of yen)
<Jan- Sep Net Sales> (billions of yen)
※incl. liquor tax 5.3 5.1 5.4 5.4
200.0 4.1 4.5 4.9
5
180.0
160.0 3.3 3.3 3.4 3.9 3.7 3.5 3.5
140.0 54.5 54.8 60.0 48.8 44.3 0
56.0 52.5
120.0 2011 2012 2013 2014 2015 2016 2017
100.0 Japanese wine Imported wine
80.0 6
60.0 113.2 110.7 112.8 112.0 111.7 117.8 121.0 4
40.0
4.9 5.5
20.0 2 3.4 4.2 4.2 4.2
0.0 1.1
Appendix 2011 2012 2013 2014 2015 2016 2017
0
2011 2012 2013 2014 2015 2016 2017
Japanese Alcoholic Beer Happoshu, New genre Spirits
Beverages 15
<Jan- Sep sales breakdown by category> 10
6% 4% 5
6.3 7.8
9.3 10.4 10.3 11.3 11.8
Beer
0
7% 2011 2012 2013 2014 2015 2016 2017
Happoshu, New genre
Japanese liquor
199.7 Wine, Spirits
6
4
billions of yen
Japanese liquor
2
5.3
3.3 3.3 3.8
1.6 2.5 2.1
22% RTD, Non alcoholic 0
61% beer 2011 2012 2013 2014 2015 2016 2017
RTD
Copyright, 2017 SAPPORO HOLDINGS LTD. All rights reserved. 26/43<Jul- Sep Major new products>
YEBISU Meister YEBISU#127
Kohaku YEBISU YEBISU Special edition
Improved (Special edition)
Appendix
Japanese Alcoholic
Beverages
Black label Black label
Special edition Special edition YEBISU Hanamiyabi Special edition
Mugi to Hop brand Mugi to Hop Special edition
(Limited amount) Copyright, 2017 SAPPORO HOLDINGS LTD. All rights reserved. 27/43<Jul- Sep Major new products>
Appendix
Copyright, 2017 SAPPORO HOLDINGS LTD. All rights reserved. 28/43Grande Polaire Wins Award
Grande Polaire Nagano Furusato Vineyard, Kifu 2011 and Grande Polaire Yamanashi
Koshu Barrel Fermentation, 2016 both won Gold and top honors in their
respective categories at the Japan Wine Competition 2017
http://www.sapporobeer.jp/news_release/0000021689/index.html
Appendix
Copyright, 2017 SAPPORO HOLDINGS LTD. All rights reserved. 29/43【SLEEMAN】 【U.S. soft drinks business】
Jan-Sep unchanged y-o-y *sales volume Jan- Sep up % y-o-y
(total demand down 2%) *sales revenue
<U.S. soft drinks business Net Sales in Local Currency
(Jan-Sep)>
* before elimination of inter- company transactions
【Sapporo U.S.A.】 25
Jan- Sep up % y-o-y *sales volume 20
19.2 19.2
(total demand down 2%)
15
【Vietnam】
10
Appendix 5
International Jan- Sep down % y-o-y *sales volume
0
2016 2017
<Y-o-y change in domestic sales volume
in Vietnam Silver Springs Citrus (US$ millions)
140% Country Pure Foods (US$ millions)
120%
100%
80%
60%
40%
20%
0%
16.1Q 16.2Q 16.3Q 16.4Q 17.1Q 17.2Q 17.3Q
Copyright, 2017 SAPPORO HOLDINGS LTD. All rights reserved. 30/43<SLEEMAN:Net Sales in Local Currency (Jan-Sep) Sapporo brand sales volume
*before elimination of inter- company transactions breakdown by geographic area
300
9%
250
6%
200 35%
2.82 4.62
20%
150 million
261 265 275 million
235 246 248 cases
100 198 205 cases
165 183
2012
50 3Q 74%
56%
2017
0
3Q
2008 2009 2010 2011 2012 2013 2014 2015 2016 2017 North America:Canada, U.S.
Asia:Vietnam, Singapore, South Korea, etc.
SLEEMAN(Can$ millions)
Oceania, etc.:Australia, Europe, etc.
Appendix
International <Sapporo U.S.A.:Net Sales in Local Currency (Jan- Sep) <Trend of overseas sales volume of
*before elimination of inter- company transactions Sapporo brand products (Jan- Sep)>
50 1200 (10,000 cases)
45
40 1000
35 800
30
25 600
43 44 45 47 963 965
20 39 41 43 892 912 946 938 957
36 37 400 833
15 33
10 200 365 394 417 462
282 337
5 184 201
0
0 2010 2011 2012 2013 2014 2015 2016 2017
2008 2009 2010 2011 2012 2013 2014 2015 2016 2017
Sapporo brand SLEEMAN
USA(US$ millions) Copyright, 2017 SAPPORO HOLDINGS LTD. All rights reserved. 31/43Yebisu Beer launched in South Korea
Launched Yebisu Beer in South Korea on September 7 (Thursday)
Imported beer market is growing in South Korea and Japanese beer is growing popular
The volume of our sales to South Korea has more than doubled compared with 2013
Introduced Yebisu Beer with the aim of creating a super premium beer market
We will promote sales in cooperation with M’s Beverage*, a local agent
*A liquor distribution company that handles Sapporo products in South Korea established in June 2011 with Maeil Dairies Co., Ltd., a major
Korean dairy manufacturer in business alliance with Sapporo
Appendix
[Profile]
・Product name: Yebisu Beer
・Package: (new launch) 350ml and 500ml cans (full-scale launch) 10L and 20L kegs
・Sales plan: 30,000 cases in 2017; 100,000 cases in 2018 (large bottle count)
・Manufacturing plant: Kyushu Hita plant
http://www.sapporoholdings.jp/news_release/0000020400/pdf/20170907YebisuBeerKorea.pdf
Copyright, 2017 SAPPORO HOLDINGS LTD. All rights reserved. 32/43【Lemon-based drinks】 【Lemon-based food products】
Jan- Sep up % y-o-y
Jan-Sep up % y-o-y
【Unsweetened tea drinks】 【Soups】
Jan- Sep up % y-o-y Jan- Sep up % y-o-y
【Soy milk, chilled products】
【Coffee drinks】
Jan –Sep Net Sales approx. billion
Jan- Sep down % y-o-y
Appendix <Japanese soft drinks <Japanese soft drinks
POKKA SAPPORO Food & Beverage
Food & Soft Drinks Sales composition by genre
Sales composition by sales channel (Jan- Sep)>
(Jan- Sep)> Coffee drinks
Vending 18% 22%
machines Lemon‐based
drinks
Tea drinks
46%
33.93million 5% 33.93million Carbonated
cases cases Water
15% Other
54%
25% 15%
※Vending machines (end of Sep.)
own brand machines : about 86,000
+ Multi-brand machines Copyright, 2017 SAPPORO HOLDINGS LTD. All rights reserved. 33/43<Food & Soft Drinks segment Net sales> <Food & Soft Drinks segment
(billions of yen) (Jan- Sep) Net sales break down by geographic area>
120 ※April 2011 Consolidation of
POKKA CORPORATION
100
85%
80
60
101.5 101.4
93.4 95.9 97.6 99.3
40 74.7 15%
Appendix
20 39.7
28.6 23.5 25.4
Food & Soft Drinks 0 Japan Overseas
2007 2008 2009 2010 2011 2012 2013 2014 2015 2016 2017
<Japanese soft drinks <Overseas soft drinks
POKKA SAPPORO Food & Beverage POKKA Corporation (Singapore)
Sales composition (Jan- Sep)> Sales composition (Jan- Sep)>
2%
22%
157
¥65.4 SG$ million
billion 42%
58%
76%
Within Singapore Export
Soft drinks Food Soy milk Copyright, 2017 SAPPORO HOLDINGS LTD. All rights reserved. 34/43【Pokka Create CO., Ltd.】
Jan- Sep Net sales billion
up % y-o-y
<New & refurbish outlets >
105
Appendix 51 East Japan
Food & Soft Drinks 193 Central Japan
West Japan
37
104
193 Directory operated
89 FC
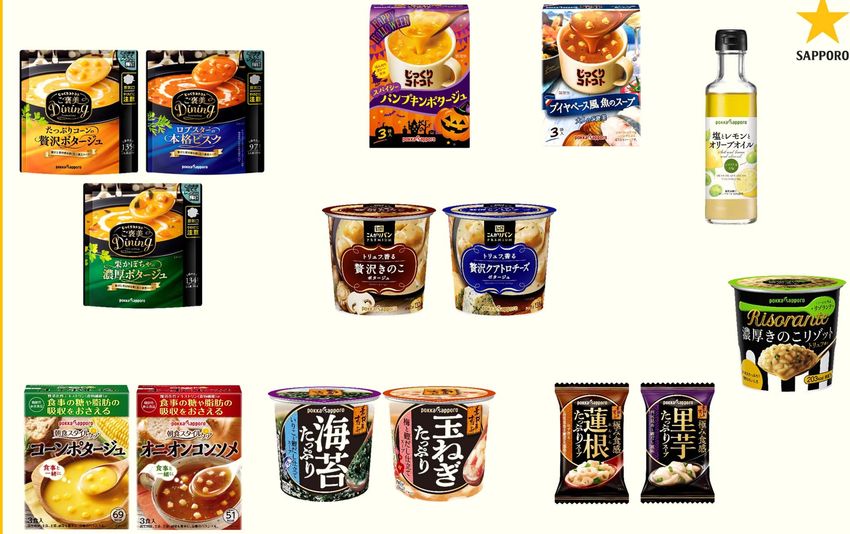
Copyright, 2017 SAPPORO HOLDINGS LTD. All rights reserved. 35/43<Jul-Sep Major New products > Soft drinks
Kireto Lemon Moisture
参考資料 Improved
Appendix Unsweetened tea drink series
Soy milk series
Gabunomi series
Copyright, 2017 SAPPORO HOLDINGS LTD. All rights reserved. 36/43<Jul-Sep Major New products > Foods
Jikkurikotokoto Soup series
参考資料
Appendix
Copyright, 2017 SAPPORO HOLDINGS LTD. All rights reserved. 37/43Launch of miso leveraging group synergy
Shinsyu-ichi Miso Co., Ltd. launched miso
containing lactic acid bacterium (September 1)
Blended plant-based lactic acid bacterium SBL88,
found after years of research by Sapporo Breweries
Appendix
Copyright, 2017 SAPPORO HOLDINGS LTD. All rights reserved. 38/43(billions
of yen) Trends of net sales and number of <Sapporo Lion outlets >
Sapporo Lion Outlets As of Sep 30, 2017
25.0 220
20.0 200
195 194
186 188 9 8
15.0 177 173
180 14 Tokyo Metroporitan
168
160
5 Kanto(excl.Tokyo)
10.0 19.3 19.6 19.0 18.9 18.7 19.0 Hokkaido
17.9
173
140
Tohoku
5.0 120 Nagoya
0.0 100 26 Kansai
Appendix 2011 2012 2013 2014 2015 2016 2017 89 Other
Restaurants Net Sales Number of outlets
22
<Restaurants segment total number of outlets><Major rental properties & occupancy rates:(Averages for 2017 3Q ) <Information about
Real Estate for lease>
Occupancy (billions of yen)
Site area Floor area 450.0
rate No. of floors
(㎡) (㎡)
(%) 400.0
40 floors above 350.0
Yebisu Garden Place(1) 56,943 298,007 98 ground, 5 below 300.0
12 floors above
Ebisu First Square 2,596 16,012 100 250.0
ground, 1 below
200.0 389.1
7 floors above 357.4
Ebisu Square 1,561 8,644 100 150.0
ground, 1 below
11 floors above 100.0 197.7 201.8
Ginza Place 645 7,350 99 ground, 2 below 50.0
13 floors above
Appendix
Strata Ginza(2) 1,117 11,411 100 0.0
ground, 1 below
As of December As of December
Real Estate *1: The number of floors is for the office block only. Occupancy rates are for office areas only.
*2: Figures are for entire property. Sapporo owns 922m2 of the site (sectional ownership) and 89.72% of the building
(joint management)
31, 2015 31, 2016
Balance sheet value Fair value
(billions of yen) (billions of yen)
<EBITDA>
2016 3Q 2017 3Q Change 2016 3Q 2017 3Q Change
<Operating income>
Yebisu Garden Place, etc. 6.1 6.1 0.0 Yebisu Garden Place, etc. 8.3 8.3 0.0
Hokkaido 0.8 1.1 0.2 Hokkaido 1.2 1.4 0.2
Other area & other Other area & other
1.5 2.3 0.7 operations 2.0 3.0 1.0
operations
General corporate (0.5) (0.7) (0.2) General corporate (0.5) (0.7) (0.2)
Total 8.0 8.8 0.7 Total 11.1 12.1 1.0
EBITDA= Operating income + depreciation and amortization)
Copyright, 2017 SAPPORO HOLDINGS LTD. All rights reserved. 40/43Various Initiatives by the Sapporo Group
Nagoya City Bureau of Tourism, Culture & Exchange, Sapporo Breweries Ltd.
and Sapporo Holdings Limited sign a partnership agreement for promoting
Reims, France (photo)
-To implement collaborative projects including community-linked cooperation starting at Shibuya,
next-generation human resources development and new value creation
http://www.sapporoholdings.jp/news_release/0000020381/pdf/20170704nagoya.pdf
Tokyo University of Agriculture and Sapporo Holdings Limited sign a
comprehensive partnership agreement
http://www.sapporoholdings.jp/news_release/0000020393/pdf/20170803toukyounoudai.pdf
Appendix
Aeon Global SCM and Sapporo Group start joint operation utilizing
RORO (roll-on/roll-off) ship (cargo ship)
http://www.sapporoholdings.jp/news_release/0000020389/pdf/20170721AEONSAPPOROHP.pdf
Copyright, 2017 SAPPORO HOLDINGS LTD. All rights reserved. 41/43Various Initiatives by the Sapporo Group
The 9th Yebisu Beer Festival
-Theme: The beer festival in the city for adults-
http://www.sapporoholdings.jp/news_release/0000020387/pdf/2017matsuri.pdf
Spending part of sales at Yebisu Beer Festival for kids’ baseball
teams in Kesennuma City
Donated 250 sets of batting center tickets for the members of the kids’ baseball
team in Kesennuma City, who are facing difficulties in finding places to practice
due to the impact of Great East Japan Earthquake.
Appendix
Donated total of ¥3 million to support the victims of the
heavy rains in Kyushu region: ¥2 million to Hita City, Oita
Prefecture, and ¥1 million to Asakura City, Fukuoka Prefecture
http://www.sapporoholdings.jp/news_release/0000020386/index.html
Delivered relief supplies to Hita City, Oita Prefecture,
which suffered damage due to the heavy rain
http://www.sapporoholdings.jp/news_release/0000020383/index.html
Sapporo Group will continue to work on the three key themes of disaster
restoration assistance -- promotion of local produce consumption,
information dissemination and nurturing of the next generation.
Copyright, 2017 SAPPORO HOLDINGS LTD. All rights reserved. 42/43As an intrinsic part of people's lives, Sapporo will contribute to
the evolution of creative, enriching and rewarding lifestyles.
The earnings forecasts and forward‐looking statements appearing in this document were prepared by the
SAPPORO Group based on currently available information and its best assessment of potential risks and
uncertainties. Actual outcomes may differ materially from forecasts due to changes in various underlying
factors.
Copyright, 2017 SAPPORO HOLDINGS LTD. All rights reserved. 43/43You can also read