Scavenging by fishers in relation to season and other scavengers
←
→
Page content transcription
If your browser does not render page correctly, please read the page content below
Received: 26 August 2020         Revised: 27 October 2020      Accepted: 20 November 2020
DOI: 10.1111/1440-1703.12198

NOTES AND COMMENTS

Scavenging by fishers in relation to season and other
scavengers

Maximilian L. Allen1                            | L. Mark Elbroch2                       | Heiko U. Wittmer3

1
Illinois Natural History Survey,
University of Illinois, Champaign, Illinois
                                                        Abstract
2
    Panthera, New York, New York                        Carrion is an energy-rich resource that benefits many organisms, but scaveng-
3
School of Biological Sciences, Victoria                 ing involves both profits and risks. Fishers (Pekania pennanti) are forest-
University of Wellington, Wellington,                   specialists that scavenge large carcasses but quantitative assessments of their
New Zealand
                                                        scavenging are lacking. We quantified three characteristics of scavenging
Correspondence                                          behavior by fishers: (a) whether fishers visited a carcass; (b) the time to first
Maximilian L. Allen, Illinois Natural                   visitation of a carcass by fishers; and (c) how long fishers fed at a carcass. We
History Survey, University of Illinois, 1816
S. Oak Street, Champaign, IL 61820.                     then evaluated the importance of habitat characteristics, cues from other scav-
Email: maxallen@illinois.edu                            enger species, and season on the scavenging behaviors of fishers. Fishers scav-
                                                        enged 25 of the 89 deer carcasses we monitored, and visited carcasses more
Funding information
Victoria University of Wellington;                      frequently in winter (n = 22, 34%) than in summer (n = 3, 12%). Time to the
University of Illinois; California                      first fisher visit to a carcass averaged 4.7 (±1.1 SE) days. On average fishers
Department of Fish and Wildlife
                                                        made 26 (±9 SE) repeat visits to each carcass they found and fed for 118.1 min
                                                        (±42.3 SE) over an average of 6 days; season also influenced their feeding
                                                        times (120.3 ± 46.0 SE min in winter versus 63.7 ± 44.7 SE min in summer).
                                                        Fishers had a crepuscular activity pattern while scavenging, but initial visits
                                                        peaked mid-day in addition to a peak near sunset. Our results suggested that
                                                        fishers may use cues from other scavengers to detect carrion, but that habitat
                                                        characteristics did not affect exploitation of carrion more than other variables.
                                                        These results highlight the potential importance of carrion for the foraging
                                                        ecology of fishers, particularly during times of resource scarcity. Further
                                                        research based on identifiable individuals is needed to quantify fitness conse-
                                                        quences of scavenging for fishers, including possible negative effects of
                                                        intraguild predation at carrion.

                                                        KEYWORDS
                                                        carrion, detection, fisher, Pekania pennanti, scavenging

1 | INTRODUCTION                                                                         O'Malley, Elbroch, Lendrum, & Quigley, 2018; Prugh &
                                                                                         Sivy, 2020), but visiting carcasses also poses risks, espe-
Carrion, especially large carcasses, is a nutritious and                                 cially for smaller vertebrate scavengers that may be
inexpensive resource that benefits many organisms                                        injured or killed by larger scavengers or the carnivores
(Inagaki et al., 2020; Sebastián-González et al., 2020).                                 that killed the prey. These risks can be species-specific,
Carrion may be more important for animals experiencing                                   and how individuals of a species respond to risk can
resource scarcity (Barrio, Hik, Bueno, & Cahill, 2013;                                   determine how frequently they scavenge and how much

Ecological Research. 2021;1–7.                              wileyonlinelibrary.com/journal/ere                     © 2021 The Ecological Society of Japan   1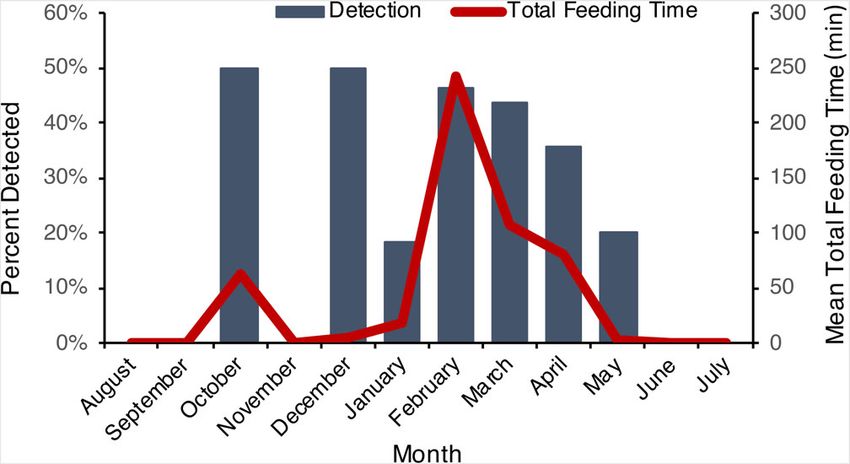
2 ALLEN ET AL.
nutrition they gain from carrion (Allen, Elbroch, California. We analyzed four primary variables:
Wilmers, & Wittmer, 2015; Sivy, Pozzanghera, Grace, & (a) whether fishers detected each carcass we placed in
Prugh, 2014). different habitats; (b) how long the first fisher took to
Fishers (Pekania pennanti) are semi-arboreal mus- detect a carcass; (c) the total duration fishers fed at each
telids that are of conservation concern in the Pacific US carcass; and (d) the temporal patterns of fishers scaveng-
states of Washington (listed as “endangered” by the ing, comparing the time of day when fishers initially vis-
Washington Fish and Wildlife Commission), Oregon ited carcasses to the time of day for subsequent visits. We
(listed as “sensitive in the critical category” by the Ore- then evaluated the importance of habitat characteristics
gon Fish and Wildlife Office), and California (listed as (Elbroch, Lendrum, Allen, & Wittmer, 2015), presence of
“endangered” in the Southern Sierra Nevada by the other scavengers (Sebastián-González et al., 2020), and
U.S. Fish and Wildlife Service). They are forest-specialists season (O'Malley et al., 2018) on the scavenging behav-
of northern habitats in North America (Powell, 1993) iors of fishers.
extending into mid-elevations in the southern Sierra
Nevada in California (Green, Purcell, Thompson, Kelt, &
Wittmer, 2018; Powell, 1993). Fishers are generalist carni- 2 | MATERIALS AND METHODS
vores that prey mostly on lagomorphs and tree squirrels,
as well as porcupines (Erethizon dorsatum) and other 2.1 | Study area
small prey. They are also one of many mesocarnivores
that scavenge from large animal carcasses (e.g., ungulates We conducted our study across approximately 1,000 km2
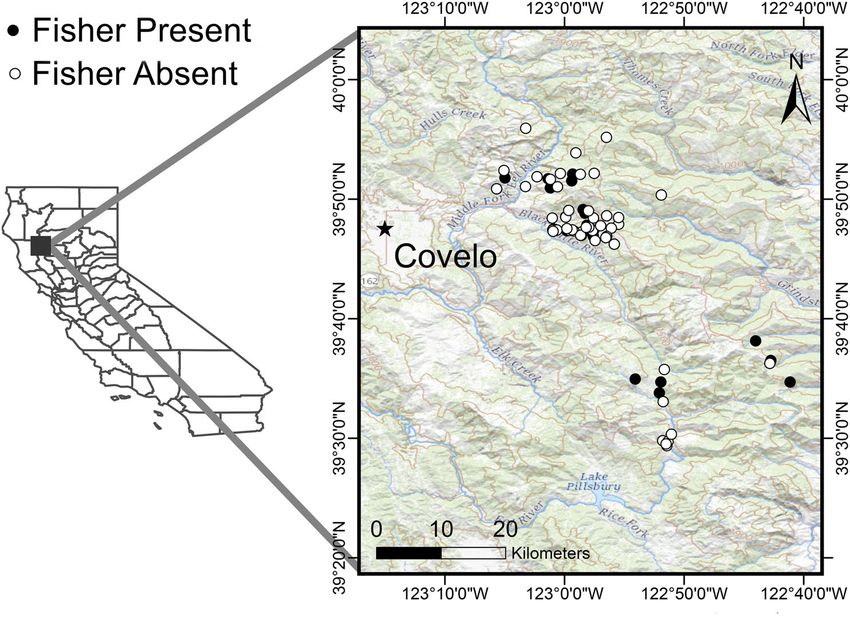
and bears; Hüner & Peter, 2013; Powell, 1993). Scaveng- of the Mendocino National Forest, California (Figure 1),
ing may be an important nutritional component of fisher ranging in elevation from approximately 400 to 2,450 m.
diet, as they often stay near carcasses for multiple days The area is primarily forested (main forest habitats
(Powell, 1993) and female fishers sometimes choose den include mixed hardwood conifer, Klamath mixed conifer,
sites near large carcasses (Powell & Zielinski, 1994). Douglas fir, montane hardwood, and ponderosa pine
Nonetheless, qualitative and quantitative descriptions of stands) with intermixed scrub and annual grasslands,
their scavenging behaviors, including habitat specific that vary based on elevation. Mean daily temperatures
detection probabilities, feeding behavior, and seasonal ranged from −1 C to 24 C with mean annual precipita-
importance, are lacking. tion averaging 132 cm (Allen, Elbroch, Casady, &
Here, we report on the scavenging behaviors of fish- Wittmer, 2015). Precipitation primarily fell during the
ers at the southern limit of their range in coastal wet winter season (November to May), with only trace
F I G U R E 1 The location of deer
carcasses scavenged by fishers
during our study, conducted in the
Mendocino National Forest and
surrounding lands in northern
California [Color figure can be
viewed at wileyonlinelibrary.com]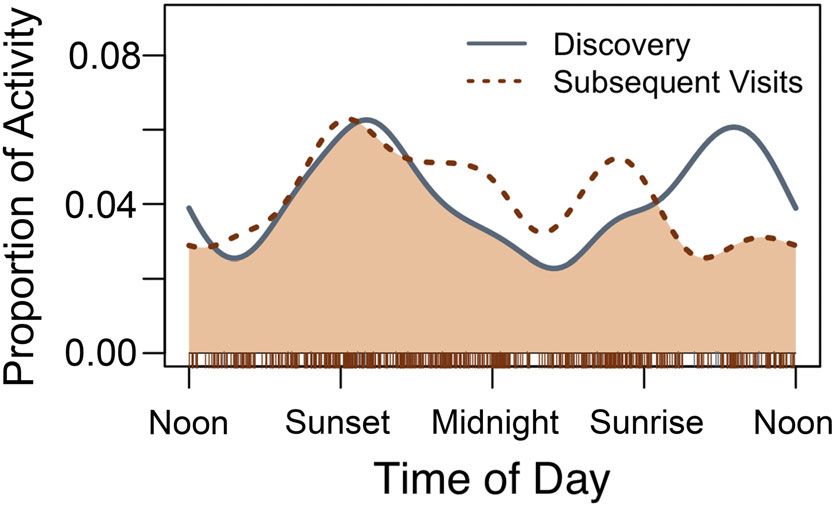
ALLEN ET AL.                                                                                                              3

precipitation in the dry summer season (June to                 Weather Station; http://www.ncdc.noaa.gov/cdo-web/
October). Black-tailed deer (Odocoileus hemionus                ), using the temperature on the day, we placed the car-
columbianus) were the most common ungulates in the              cass as the covariate. We also included other scavenger
study area, along with low densities of other ungulates:        species that were present at ≥25% of the carcasses
wild pigs (Sus scrofa), tule elk (Cervus canadensis             where fishers scavenged as covariates that might affect
nannodes), and domestic cattle (Bos taurus) (Allen,             scavenging behavior of fishers (nblack bear = 12,
Elbroch, Casady, & Wittmer, 2015). Common scavengers            ncoyote = 12, ngray fox = 12, nbobcat = 6).
documented at mountain lion (Puma concolor) kills in
the study area included American black bears (Ursus
americanus), coyotes (Canis latrans), bobcats (Lynx             2.3 | Statistical analyses
rufus), gray foxes (Urocyon cinereoargenteus), and turkey
vultures (Cathartes aura; Allen, Elbroch, Wilmers, &            We used program R version 3.6.2 (R Core Team, 2019)
Wittmer, 2015). Known predators of fishers found in the         for all of our statistical analyses. We tested a series of
study area included mountain lion, bobcat, coyote and           covariates using generalized linear models for three
domestic dogs (Canis lupus familiaris; Gabriel                  dependent variables: (a) whether fishers detected a car-
et al., 2015).                                                  cass using a binomial link; (b) how long it took fishers to
                                                                detect carcasses using a gamma link; and (c) the total
                                                                feeding time of fishers using a Gaussian link. We were
2.2 | Field methods                                             unable to conclusively determine the identity or sex of
                                                                fishers, and so we assessed visitation rates at the species
We deployed video camera traps with infrared flash              level. We used z-scores to standardize all continuous
(Cuddeback IR, De Pere, WI) at 100 black-tailed deer car-       covariates prior to analyses, and then estimated effect
casses to document scavenger activity and feeding behav-        sizes directly from estimated standardized model coeffi-
ior from December 2009–October 2012. We collected               cients (Fieberg & Johnson, 2015). We used an AIC frame-
fresh carcasses of black-tailed deer killed by vehicle colli-   work, using a balanced model design where we analyzed
sions on highways in Mendocino, Lake, Glenn, Sonoma,            each variable and combinations of each pair of variables
and Marin Counties. All carcasses were in good condition        (Symonds & Moussalli, 2011). We selected our top models
with clear, unclouded eyes, no discoloration in the             based on the AICc values, considering models with
abdominal region, and no obvious wounds. Because we             Δi < 2 to be our top models (Burnham &
removed heads, entrails, and lungs prior to transporting        Anderson, 2002). We selected the top variables using
carcasses, as required by the California Department of          their model averaged weight and compared their effects
Fish and Wildlife to limit disease transmission among           based on their standardized coefficients (Symonds &
deer populations, small scavengers did not depend on            Moussalli, 2011).
large scavengers to open carcasses for them. We anchored            We used kernel density estimation to determine activ-
each carcass in place with a cable attached to a tree. We       ity patterns and quantify overlap between when fishers
placed a camera trap nearby and programed it to record          initially discovered carcasses versus all subsequent visits
the maximum amount of activity (30 s of video with a            (Ridout & Linkie, 2009). We used the time each visit
pause of 60 s before the next trigger). We excluded data        started as our time values in the analyses and changed
from camera traps where the camera trap or carcass were         the time of each event to radians that corresponded to
displaced by black bears or the camera otherwise                sun time. We then used the overlap package (Meredith &
malfunctioned (n = 11).                                         Ridout, 2017) to fit the data to a circular kernel density
    We placed carcasses in a stratified manner to sam-          and estimated the activity among time periods from the
ple diverse microhabitat covariates and to ensure that          distribution of the kernel density using Δ1 (based on our
sampling was representative of the local, vertebrate,           sample sizes). We used the overlapEst function to esti-
scavenger guild. We focused on placing at least 10 car-         mate the degree of overlap in activity between when fish-
casses in each of the main forested habitats found in           ers initially discovered carcasses versus all subsequent
the study area with a mix of elevation and canopy               visits.
cover. At each site, we documented elevation using a
handheld GPS, measured the slope of the immediate
area using a clinometer, and measured the canopy                3 | RESULTS
cover directly above the carcass using a spherical con-
vex densitometer. We obtained the temperature from              Fishers scavenged 25 of the 89 deer carcasses we moni-
weather station data (NOAA-Mendocino Pass, CA                   tored (28%) and on average made 26 (±8.97 SE) visits to
4 ALLEN ET AL.
each carcass. Fishers visited carcasses significantly more
often in winter (34%) than summer (12%; z = 2.11,
p = .03; Figure 2). Considering data from all 89 carcasses,
fishers were the fifth most frequent scavenger we
detected after black bears (n = 49), gray foxes (n = 38),
turkey vultures (n = 30), and coyotes (n = 29). We
obtained six top models for detection (Table 1, Table S1),
with the top two models being the number of scavengers
+ temperature (w = 0.18) and the number of scavengers
+ season (w = 0.14). The top variable across all models
P
was number of scavengers ( w = 0.87, β = 0.49), which
F I G U R E 2 The monthly values for deer carcasses detected by was nearly four times more likely to appear in a top
fishers and the mean total feeding time by fishers at carcasses model for fishers detection of carcasses than the next best
[Color figure can be viewed at wileyonlinelibrary.com] variable (temperature; Table 2).
T A B L E 1 Top models for fishers detection, time to detect carcasses, and total feeding time at carcasses. We report the variables along
with their AICc, difference in AICc from the top model (Δi), AICc weight (w), and coefficients with standard error (β ± SE)
(a) Detection
Variable AIC ΔAIC w β ± SE
Number of scavengers + temperature 97.05 0.00 0.18 0.46 ± 0.16, −0.08 ± 0.05
Number of scavengers + season 97.52 0.47 0.14 0.45 ± 0.16, 1.08 ± 0.70
Number of scavengers + bear 97.53 0.48 0.14 0.53 ± 0.16, −0.86 ± 0.53
Number of scavengers + canopy cover 97.70 0.64 0.13 0.46 ± 0.16, 2.35 ± 2.17
Number of scavengers + elevation 97.77 0.72 0.12 0.51 ± 0.16, 0.01 ± 0.01
Number of scavengers 98.12 1.06 0.10 0.49 ± 0.15
(b) Detection time
Variable AIC ΔAIC w β ± SE
Coyote 133.17 0.00 0.10 2.94 ± 1.93
Null 133.50 0.34 0.08 -
Season + coyote 134.21 1.05 0.06 −3.21 ± 3.63, 3.43 ± 1.86
Number of scavengers 134.30 1.13 0.06 0.79 ± 0.64
Slope 134.62 1.46 0.05 0.22 ± 0.17
Coyote + gray fox 134.70 1.53 0.05 2.87 ± 1.68, 1.69 ± 1.49
Gray fox 135.06 1.90 0.04 1.80 ± 2.02
(c) Total feeding time
Variable AIC ΔAIC w β ± SE
Null 340.35 0.00 0.07 —
Slope 341.25 0.90 0.05 6.62 ± 5.22
Gray fox 341.57 1.22 0.04 92.59 ± 81.11
Black bear 341.65 1.29 0.04 −90.70 ± 81.76
Coyote 341.81 1.46 0.04 84.42 ± 81.50
Bobcat 341.85 1.50 0.03 −96.96 ± 95.42
Temperature 341.88 1.53 0.03 −9.97 ± 9.98
Canopy cover 342.00 1.64 0.03 393.60 ± 416.51
Gray fox + slope 342.03 1.68 0.03 110.56 ± 79.96, 7.70 ± 5.17
Coyote + gray fox 342.13 1.78 0.03 120.09 ± 82.57, 126.46 ± 82.56
Elevation 342.32 1.97 0.03 0.23 ± 0.30ALLEN ET AL. 5
T A B L E 2 Model-averaged weights (^ w) with coefficient (β) and standard error (SE) for each covariate for our three dependent variables,
with the top three variables shown in bold
Detection Detection time Total feeding time
Variable ^
w β ± SE ^
w β ± SE ^
w β ± SE
Black bear 0.01 −0.56 ± 0.48 0.11 −1.47 ± 1.97 0.15 −90.70 ± 81.76
Bobcat 0.01 0.42 ± 0.57 0.11 −0.19 ± 2.48 0.17 −96.96 ± 95.42
Canopy cover 0.17 2.92 ± 2.12 0.07 1.73 ± 10.15 0.10 393.60 ± 416.51
Coyote 0.02 0.94 ± 0.49 0.31 2.94 ± 1.93 0.16 84.42 ± 81.50
Elevation 0.17 0.00 ± 0.00 0.12 0.01 ± 0.01 0.14 0.23 ± 0.30
Gray fox 0.01 0.30 ± 0.47 0.15 1.80 ± 2.02 0.19 92.59 ± 81.11
Number of scavengers 0.87 0.49 ± 0.15 0.12 0.79 ± 0.64 0.07 −8.86 ± 27.77
Season 0.19 1.35 ± 0.67 0.16 −1.85 ± 4.48 0.07 56.65 ± 127.64
Slope 0.07 0.01 ± 0.03 0.14 0.22 ± 0.17 0.21 6.62 ± 5.22
Temperature 0.23 −0.09 ± 0.04 0.13 −0.13 ± 0.24 0.15 −9.97 ± 9.98
but these variables did not perform better than the null
model when modeled individually.
Fishers scavenged throughout the day and night
(Figure 3). The time of day when fishers initially discov-
ered carcasses overlapped strongly with all subsequent
visits (Δ1 = 0.86), but initial visits had a peak mid-day
along with near sunset while subsequent visits had a cre-
puscular pattern.
F I G U R E 3 Fishers were active at all times of day while 4 | DISCUSSION
scavenging, with peaks in the early evening and morning. The time
of day for fishers when initially discovering carcasses had a strong
Our results highlight the importance of scavenging in the
overlap with all subsequent visits (Dhat1 = 0.88), with the main
foraging ecology of fishers, particularly during times of
difference being a peak in mid-day similar to the peak in the early
evening [Color figure can be viewed at wileyonlinelibrary.com] resource scarcity and high energetic demands (i.e., Stress
Gradient Hypothesis; Barrio et al., 2013). Fishers in our
study scavenged from nearly as many carcasses (28%) as
Fishers on average took 4.7 (±1.1 SE) days to detect did turkey vultures (34%), which are key obligate scaven-
carcasses. The top models for detection time were equivo- gers in scavenger communities worldwide (Sebastián-
cal and included the null model (Table 1). The top vari- González et al., 2020). Large carcasses can provide
able explaining detection time across all models was the substantial food with no handling costs compared to the
P
presence of coyotes ( w = 0.31, β = 2.9, Table 2). small- and medium-sized prey fishers usually kill and con-
Fishers on average fed for 118.1 min (±42.3 SE) at sume (LaPoint, Belant, & Kays, 2015). Fishers visited car-
each carcass they found and spent an average of 5.7 min casses more frequently (34% of carcasses) and fed for twice
(±0.9 SE) during each visit. None of the covariates that as long in winter than in summer, as do other mes-
we tested to explain variation in total feeding time ocarnivores (e.g., red fox, Vulpes vulpes; Selva, Jedrzejewska,
improved model fit over the null model (Table 1). There Jedrzejewski, & Wajrak, 2005; O'Malley et al., 2018). Fishers
was no relationship between the time to detect a carcass exhibit delayed implantation, rapid fetal growth in the final
and total feeding time (R2 = −0.04, p = .97), but fishers month of pregnancy, and give birth in late winter (mean
scavenged for longer in winter (120.3 ± 46.0 SE min) date of parturition across their range is 25 March; Green
than in summer (63.7 ± 44.7 SE min; Figure 2). Top et al., 2018). Therefore scavenging may be more important
P
model averaged variables included slope ( w = 0.21, when fishers are energetically stressed.
P
β = 6.6), presence of gray foxes ( w = 0.19, β = 92.6), Despite monitoring a large number of carcasses, our
P
and presence of bobcats ( w = 0.17, β = −97.0) (Table 2), study was limited by small effective sample sizes for6 ALLEN ET AL.
fishers (n = 25). Nevertheless, we found that the number Wellington generously provided funding for the project.
of species that scavenged carcasses was the most impor- We thank Jason Fisher, Roger Powell, and Tsewang
tant variable explaining whether fishers also visited car- Namgail for comments on earlier drafts that substantially
casses. We interpret this result to mean that fishers use improved the manuscript.
cues from other scavengers to locate carcasses, similar to
conclusions about how scavengers detect carrion more ORCID
broadly drawn in other studies (Sebastián-González Maximilian L. Allen https://orcid.org/0000-0001-8976-
et al., 2016; Wilmers, Stahler, Crabtree, Smith, & 889X
Getz, 2003). However, the resulting overlap with other,
often dominant, scavengers at carcasses may also have RE FER EN CES
negative fitness consequences for fishers (i.e., the Fatal Allen, M. L., Elbroch, L. M., Wilmers, C. C., & Wittmer, H. U.
Attraction Hypothesis; Prugh & Sivy, 2020; Sivy, (2015). The comparative effects of large carnivores on the
Pozzanghera, Grace, & Prugh, 2017). For example, acquisition of carrion by scavengers. The American Naturalist,
pumas, bobcats, and coyotes kill fishers (Gabriel 185, 822–833.
Allen, M. L., Elbroch, L. M., Casady, D. S., & Wittmer, H. U. (2015).
et al., 2015) and fishers in our study system were some-
The feeding and spatial ecology of mountain lions (Puma con-
times killed by pumas while scavenging from deer killed
color) in Mendocino National Forest, California. California Fish
by these apex predators (Allen, Elbroch, Casady, & and Game, 101, 51–65.
Wittmer, 2015; Allen, Elbroch, Wilmers, & Allen, M. L., Evans, B. E., & Gunther, M. S. (2015). A potential
Wittmer, 2015). The mix of positive and negative interac- range expansion of the coastal fisher (Pekania pennanti) popu-
tions at carcasses may be indicative of the complexity of lation in California. California Fish and Game, 101, 280–285.
interspecific interactions that can occur within vertebrate Barrio, I. C., Hik, D. S., Bueno, C. G., & Cahill, J. F. (2013). Exten-
scavenging communities (Peers et al., 2020; Prugh & ding the stress-gradient hypothesis–is competition among ani-
mals less common in harsh environments? Oikos, 122, 516–523.
Sivy, 2020; Sebastián-González et al., 2020).
Burnham, K., & Anderson, D. (2002). Model selection and multi-
The Mendocino National Forest is generally thought model inference (2nd ed.). New York: Springer.
to be the southernmost extent of the distribution of fish- Elbroch, L. M., Lendrum, P. E., Allen, M. L., & Wittmer, H. U.
ers in coastal areas (but see Allen, Evans, & (2015). Nowhere to hide: Pumas, black bears, and competition
Gunther, 2015), but little is known about this population. refuges. Behavioral Ecology, 26, 247–254.
Our results show that fishers in this region regularly Fieberg, J., & Johnson, D. H. (2015). MMI: Multimodel inference or
scavenge carcasses, especially in winter, but there is models with management implications? Journal of Wildlife
Management, 79, 708–718.
much we still do not know about the scavenging behavior
Gabriel, M. W., Woods, L. W., Wengert, G. M., Stephenson, N.,
of fishers. For example, our analyses aimed at under-
Higley, J. M., Thompson, C., … Sacks, B. N. (2015). Patterns of natu-
standing both carcass detection and feeding times were ral and human-caused mortality factors of a rare forest carnivore, the
inconclusive. We were also unable to conclusively deter- fisher (Pekania pennanti) in California. PLoS One, 10, e0140640.
mine the sex of fishers scavenging carcasses. Due to their Green, R. E., Purcell, K. L., Thompson, C. M., Kelt, D. A., &
sexual dimorphism, sex influences energetic demands Wittmer, H. U. (2018). Reproductive parameters of the fisher
and likely influences predation risk and thus potentially (Pekania pennanti) in the southern Sierra Nevada, California.
their use of carrion. To clearly understand sex-specific Journal of Mammalogy, 99, 537–553.
Hüner, E. A., & Peter, J. F. (2013). In situ caching of a large mam-
positive and negative fitness consequences associated
mal carcass by a fisher, Martes pennanti. Canadian Field-Natu-
with the use of carrion, future research will likely require
ralist, 126, 234–237.
identifiable fishers marked with telemetry equipment. Inagaki, A., Allen, M. L., Maruyama, T., Yamazaki, K., Tochigi, K.,
Given the conservation status of many western fisher Naganuma, T., & Koike, S. (2020). Vertebrate scavenger guild
populations, and the impact of large carnivores on car- composition and utilization of carrion in an east Asian temper-
rion distributions and abundance, we encourage further ate forest. Ecology and Evolution, 10, 1223–1232.
work to better understand whether carrion resources LaPoint, S. D., Belant, J. L., & Kays, R. W. (2015). Mesopredator
increase intraguild predation on fishers or whether domi- release facilitates range expansion in fisher. Animal Conserva-
tion, 18, 50–61.
nant competitors like pumas are in fact facilitating fisher
Meredith, M., & Ridout, M. (2017). Overview of the overlap pack-
populations in need (Prugh & Sivy, 2020). age. R project. http://cran.radicaldevelop.com/web/packages/
overlap/vignettes/overlap.pdf.
ACK NO WLE DGE MEN TS O'Malley, C., Elbroch, L. M., Lendrum, P. E., & Quigley, H. (2018).
The California Department of Fish and Wildlife, the Cali- Motion-triggered video cameras reveal spatial and temporal
fornia Deer Association, the Illinois Natural History Sur- patterns of red fox foraging on carrion provided by mountain
vey, the University of Illinois, and Victoria University of lions. PeerJ, 6, e5324.ALLEN ET AL. 7
Peers, M. J., Konkolics, S. M., Lamb, C. T., Majchrzak, Y. N., Selva, N., Jedrzejewska, B., Jedrzejewski, W., & Wajrak, A. (2005).
Menzies, A. K., Studd, E. K. … Boutin, S. (2020). Prey availabil- Factors affecting carcass use by a guild of scavengers in
ity and ambient temperature influence carrion persistence in European temperate woodland. Canadian Journal of Zoology,
the boreal forest. Journal of Animal Ecology, 89, 2156–2167. 83, 1590–1601.
Powell, R. A. (1993). The fisher: Life history, ecology, and behaviour Sivy, K. J., Pozzanghera, C. B., Grace, J. B., & Prugh, L. R. (2017).
(Second ed.). Minneapolis, Minn: University of Minnesota Press Fatal attraction? Intraguild facilitation and suppression among
237 pages. predators. The American Naturalist, 190, 663–679.
Powell, R. A., & Zielinski, W. J. (1994) Fisher. In L. F. Ruggiero, Symonds, M. R., & Moussalli, A. (2011). A brief guide to model
K. B. Aubry, S. W. Buskirk, L. J. Lyon, & W. J. Zielinski, Tech. selection, multimodel inference and model averaging in behav-
(Eds.), The scientific basis for conserving forest carnivores: Ameri- ioural ecology using Akaike's information criterion. Behav-
can marten, fisher, lynx, and wolverine in the western United ioural Ecology and Sociobiology, 65, 13–21.
States. Gen. Tech. Rep. RM-254. (pp. 38–73). Fort Collins, CO: Wilmers, C. C., Stahler, D. R., Crabtree, R. L., Smith, D. W., &
US Department of Agriculture, Forest Service, Rocky Mountain Getz, W. M. (2003). Resource dispersion and consumer
Forest and Range Experiment Station. dominance: Scavenging at wolf- and hunter-killed car-
Prugh, L. R., & Sivy, K. J. (2020). Enemies with benefits: Integrating casses in Greater Yellowstone, USA. Ecology Letters, 6,
positive and negative interactions among terrestrial carnivores. 996–1003.
Ecology Letters, 23, 902–918. Sivy, K. J., Pozzanghera, C. B., Grace, J. B., & Prugh, L. R. (2017).
R Core Team. (2019). R: A language and environment for statistical Fatal attraction? Intraguild facilitation and suppression among
computing. Vienna, Austria: R Foundation for Statistical predators. The American Naturalist, 190(5), 663–679.
Computing.
Ridout, M. S., & Linkie, M. (2009). Estimating overlap of daily activ-
ity patterns from camera trap data. Journal of Agricultural, Bio- SU PP O R TI N G I N F O RMA TI O N
logical, and Environmental Statistics, 14, 322–337. Additional supporting information may be found online
Sebastián-González, E., Moleón, M., Gibert, J. P., Botella, F., in the Supporting Information section at the end of this
Mateo-Tomás, P., Olea, P. P., … Sánchez-Zapata, J. (2016). article.
Nested species-rich networks of scavenging vertebrates support
high levels of interspecific competition. Ecology, 97, 95–105.
Sebastián-González, E., Morales-Reyes, Z., Botella, F., Naves- How to cite this article: Allen ML, Elbroch LM,
Alegre, L., Pérez-García, J. M., Mateo-Tomás, P., … Sánchez- Wittmer HU. Scavenging by fishers in relation to
Zapata, J. A. (2020). Network structure of vertebrate scavenger season and other scavengers. Ecological Research.
assemblages at the global scale: Drivers and ecosystem func-
2021;1–7. https://doi.org/10.1111/1440-1703.12198
tioning implications. Ecography, 43, 1143–1155.You can also read