SCIENCE, TECHNOLOGY AND SKILLS - OPEN KNOWLEDGE REPOSITORY

Page created by Angel Johnston
 
CONTINUE READING
SCIENCE, TECHNOLOGY AND SKILLS - OPEN KNOWLEDGE REPOSITORY
report
                                                   October 2007

      Science, Technology
           and Skills

      Philip Pardey, Jennifer James, Julian Alston,
    Stanley Wood, Bonwoo Koo, Eran Binenbaum,
          Terrance Hurley, and Paul Glewwe
                           with
Jorge Mayer, Richard Jones, Hugo De Groote, Fred Kanampiu,
    John McDermott, Christine Jost, and Jeffrey Mariner
SCIENCE, TECHNOLOGY AND SKILLS - OPEN KNOWLEDGE REPOSITORY
OCTOBER 2007

                SCIENCE, TECHNOLOGY AND SKILLS

                 Philip Pardey, Jennifer James, Julian Alston,
               Stanley Wood, Bonwoo Koo, Eran Binenbaum,
                     Terrance Hurley, and Paul Glewwe
                                                  with
        JORGE MAYER, RICHARD JONES, HUGO DE GROOTE, FRED KANAMPIU,
            JOHN MCDERMOTT, CHRISTINE JOST, AND JEFFREY MARINER

                                                                                                            S C I E N C E, T E C H N O LO G Y A N D S K I L L S

This report was commissioned by the CGIAR Science Council and prepared as a Background Paper for the
2008 World Development Report of the World Bank. The contents are the sole responsibility of the authors,
and the views expressed do not necessarily represent those of the Science Council or the World Bank. We
gratefully acknowledge Nienke Beintema, Connie Chan-Kang, Ulrike Wood-Sichra, Kate Sebastian, Sue
Pohlod, Steven Dehmer, Peter Button, and Jason Beddow for their assistance in preparing this report. We
also thank Clive James and Su Ching for providing data and Beatriz Avalos Sartorio, Derek Byerlee and two
anonymous reviewers for helpful comments on prior versions of this report. The CGIAR Science Council
was the principal source of funding for this work, with additional support from the HarvestChoice Project
(www.HarvestChoice.org) funded by the Bill and Melinda Gates Foundation and the International Science
and Technology Practice and Policy (InSTePP) center at the University of Minnesota.

© 2007 International Science and Technology Practice and Policy (InSTePP) center                            3
SCIENCE, TECHNOLOGY AND SKILLS - OPEN KNOWLEDGE REPOSITORY
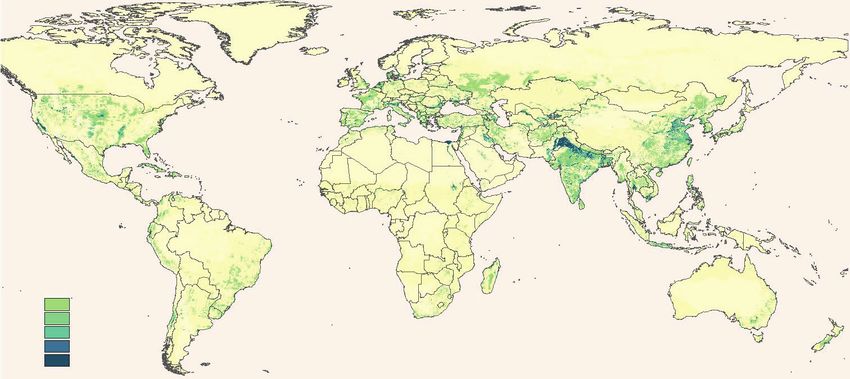
ABOUT TH E A U TH O RS
                                                      Julian Alston is a professor in the Department of Agricultural and Resource Economics, University of
                                                      California, Davis.

                                                      Eran Binenbaum is a lecturer in the Department of Economics, University of Adelaide, Australia.

                                                      Hugo De Groote is a senior scientist at the International Maize and Wheat Improvement Center (CIMMYT)
                                                      based in Nairobi, Kenya.

                                                      Paul Glewwe is a professor in the Department of Applied Economics, University of Minnesota.

                                                      Terrance Hurley is an associate professor in the Department of Applied Economics, University of
                                                      Minnesota.

                                                      Jennifer James is is an associate professor in the Department of Agribusiness at California Polytechnic
                                                      State University, San Luis Obispo.

                                                      Richard Jones is assistant director of the International Center for Research in the Semi-Arid Tropics (ICRISAT)
                                                      based in Nairobi, Kenya.

                                                      Christine Jost is an epidemiologist at the International Livestock Research Institute (ILRI), Nairobi, Kenya
                                                      and Addis Ababa, Ethiopia.

                                                      Fred Kanampiu is a senior scientist at the International Maize and Wheat Improvement Center (CIMMYT)
                                                      based in Nairobi, Kenya.

                                                      Bonwoo Koo is an assistant professor, University of Waterloo, Canada.

                                                      Jeffrey Mariner is team leader of Animal Health & Food Safety for Trade at the International Livestock
                                                      Research Institute (ILRI), Nairobi, Kenya and Addis Ababa, Ethiopia.

                                                      Jorge Mayer is Golden Rice Project Manager, Campus Technologies Freiburg, Germany.

                                                      John McDermott is deputy director of the International Livestock Research Institute (ILRI), Nairobi, Kenya
                                                      and Addis Ababa, Ethiopia.

                                                      Philip Pardey is a professor in the Department of Applied Economics and director of the Center for
                                                      International Science and Technology Practice and Policy (InSTePP), University of Minnesota.
S C I E N C E, T E C H N O LO G Y A N D S K I L L S

                                                      Stanley Wood is a senior research fellow at the International Food Policy Research Institute,
                                                      Washington, D.C.

  4
CONTENTS

1. Introduction                                                9

  1.1 Global Agricultural Productivity                        10

  1.2 Crop Yield Variability                                  14

2. The Changing Context for Agricultural R&D                  16

  2.1 Economic Realities of Agricultural R&D                  16
  2.2 Changing Incentives to Innovate                         18

  2.3 Collective Action in R&D                                26

  2.4 Financing Agricultural Research                         35

3. State of Sciences for Agriculture                          46

4. Technological Distance, Spillovers, and Knowledge Stocks   60

5. Risk and Regulation of Science and Technology              67

  5.1 Agricultural and Technological Risk                     67

  5.2 Regulating Technologies                                 72

6. The Role of Skills and Education in Agriculture            77

7. Implications                                               81

References                                                    85
                                                                   S C I E N C E, T E C H N O LO G Y A N D S K I L L S

                                                                   5
ACRONYMS A N D A B BR E VIA T IO NS
                                                      AATF        African Agricultural Technology Foundation
                                                      ABSP        Agricultural Biotechnology Support Project
                                                      AGERI       Agricultural Genetic Engineering Research Institute (an Egyptian public research institute)
                                                      ASARECA     Association for Strengthening Agricultural Research in Eastern and Central Africa
                                                      BIOS        Biological Innovation for Open Society
                                                      CGIAR       Consultative Group on International Agricultural Research
                                                      CI Seeds    (now AstraZeneca, a U.S. firm)
                                                      CIAT        Centro Internacional de Agricultura Tropical (International Center for Tropical Agriculture)
                                                      CIMMYT      Centro Internacional de Mejoramiento de Maíz y Trigo (International Maize and Wheat
                                                                  Improvement Center)
                                                      CLADES      Latin American Consortium on Ecology and Sustainable Development
                                                      CLAYUCA     Latin American Consortium for Cassava Research and Development
                                                      CPVO        Community Plant Variety Office
                                                      CRIFC       Central Research Institute for Field Crops (an Indonesian public research institute)
                                                      EPA         U.S. Environmental Protection Agency
                                                      FAO         Food and Agriculture Organization of the United Nations
                                                      FDA         U.S. Food and Drug Administration
                                                      FLAR        Fondo Latinoamericano para Arroz de Riego (Latin American Fund for Irrigated Rice
                                                                  Research)
                                                      FONTAGRO Fondo Regional De Tecnología Agropecuaria (Regional Fund for Agricultural Technology for
                                                               Latin America and the Caribbean)
                                                      FSU         Former Soviet Union
                                                      GEM         Germplasm Enhancement of Maize Project
                                                      GMGC        Global Musa Genomics Consortium
                                                      IABSP       Instituto de Análise Bioenergética de São Paulo
                                                      ICRISAT     International Crops Research Institute for the Semi-Arid Tropics
                                                      IITA        International Institute of Tropical Agriculture
                                                      INGER       International Network for the Genetic Evaluation of Rice
                                                      INIBAP      International Network for the Improvement of Banana and Plantain
S C I E N C E, T E C H N O LO G Y A N D S K I L L S

                                                      INIBAP      International Network for the Improvement of Banana and Plantain
                                                      IPGRI       Bioversity (formerly International Plant Genetic Resources Institute)
                                                      IRFGC       International Rice Functional Genomics Consortium
                                                      IRGSP       International Rice Genome Sequencing Project
                                                      IRRI        International Rice Research Institute
                                                      ISGC        International Sheep Genomics Consortium
                                                      IWGSC       International Wheat Genome Sequencing Consortium
                                                      LAMP        Latin American Maize Project

  6                                                   MGC         Consortium for Maize Genomics
NARS    National Agricultural Research System
NBFGC   National Bovine Functional Genomics Consortium
NSF     U.S. National Science Foundation
ONSA    Organization for Nucleotide Sequencing and Analysis
PGSC    Potato Genome Sequencing Consortium
PIPRA   Public-Sector Intellectual Property Resource for Agriculture
PPIC    Potash and Phosphorous Institute of Canada
RBGC    Rice Blast Genome Consortium
SGSC    Swine Genome Sequencing Consortium
UPOV    International Convention for the Protection of New Varieties of Plants
USAID   United States Agency for International Development
USDA    United States Department of Agriculture
UW      University of Wageningen
WANA    West Asia and North Africa
WARDA   Africa Rice Center (formerly West Africa Rice Development Association)

                                                                                 S C I E N C E, T E C H N O LO G Y A N D S K I L L S

                                                                                 7
8
    S C I E N C E, T E C H N O LO G Y A N D S K I L L S
1. INTRODUCTION                                                    spatial extent of particular crops that get moved
                                                                   around both between countries as well as among
The invention of agriculture that occurred around                  regions and agroecologies within countries. Figure
10,000 years ago heralded a shift from nomadic                     1 shows the changing spatial extent of land in
hunting and gathering to more managed forms of                     agriculture, beginning in 1700 when agriculture
food, feed and fibre production. The domestication                 occupied just 9 percent of the world’s land area.
of crops initially involved the saving of seed from                We see the spread of agriculture to the New
one season for planting in subsequent years. Later,                Worlds and an expansion of land in Africa, Latin
farmers purposefully selected crop varieties and                   America and parts of South-East Asia. By 1992,
so in practice began matching and, by repeated                     agriculture was being practiced on 40 percent of
selection over many years, adapting crop genetics                  the world’s land area. Sizable additional land areas
to the environment in which the crop was grown.                    have agroecological attributes that make them
From its inception, enhancing G x E (i.e., gene by                 amenable to agriculture, but urban, infrastructural,
environment) interactions was an intrinsic, if not                 economic and environmental factors circumscribe
defining, feature of agriculture.                                  this potential.1

However, just as the G-part of agriculture changed                 Despite this long sweep of agriculture, scientifically
over time because of human activity, so too did                    bred crop varieties (and livestock breeds) and their
the E-element. Farmers first began altering their                  associated agricultural management practices
local environments by clearing and levelling                       have a history of barely one hundred years. At
fields, weeding, and engaging in various forms of
irrigation. Then, as people began to migrate they
                                                                       1 Contrary to popular belief there remains significant room to
carried their crops with them, found new ones                      expand agricultural areas, at least from a biological perspective.
along the way, and, eventually, sent expeditions                   Using only agroecological attributes to determine the suitability
                                                                   of land for agriculture, Bruinsma (2003) estimated that at the turn
abroad scouring the world for new cropping                         of the 21st century only 34 percent of the potential agricultural
material. Viewed from this historical perspective,                 area in the developing world was being farmed (with much of the
                                                                   additional areas located in sub-Saharan Africa, Latin America and,
the geographical footprint of agriculture has been                 to a lesser extent, South Asia). About 44 percent of the potential
ever changing; even more so when looking at the                    agricultural land in the developed countries was being farmed in
                                                                   1997-99.

  Figure 1: Land in Agriculture, 1700-1992

                                                                                                                                         S C I E N C E, T E C H N O LO G Y A N D S K I L L S

  Source: Ramankutty, Foley and Olejnickzak (2002).
  Notes: Agricultural area estimates developed using the methodology described in Ramankutty and Foley (1999).

                                                                                                                                         9
the beginning of the 20th century a number of                          agricultural R&D has been done—has also been a
                                                      important things changed. For example, the laws                        feature of agricultural progress the world over. Big
                                                      of heredity were rediscovered and there were                           changes are afoot, especially in the past 25 years,
                                                      substantive improvements in our understanding                          in the ways in which many (rich) countries fund
                                                      of the role soil fertility plays in plant growth.                      and organise their public agricultural R&D, the
                                                      There also emerged an appreciation of how to                           incentives affecting private R&D, the orientation of
                                                      better manage agricultural production systems                          rich-country research, and the intellectual property
                                                      and deal with crop and livestock diseases as the                       and regulatory restrictions that affect the sharing
                                                      bacteriology, virology and related microbiological                     and use of the results of research. Taken together,
                                                      sciences began to develop. Introducing the                             these changes raise serious, and yet unresolved,
                                                      results of scientific research into agriculture                        questions about the prospects for sustaining
                                                      accelerated the growth in agricultural productivity                    productivity growth over the next 25 years and
                                                      and production in significant parts of the world,                      beyond.
                                                      particularly beginning in the mid-1900s.

                                                      These improvements in agricultural productivity                        1.1 GLOBAL AGRICULTURAL
                                                      have alleviated much poverty and starvation and                        PRODUCTIVITY
                                                      fuelled economic progress. However, as this report
                                                      will show, comparatively little agricultural R&D
                                                                                                                             Crop Yields
                                                      and “technology tailoring” has been done for the
                                                      conditions confronting African agriculture.2 Thus                      For thousands of years, farmers eked out yield
                                                      it should not be surprising that comparatively                         gains by collecting and selecting the best
                                                      little progress has been made on the agricultural                      and most productive seeds and by improving
                                                      productivity front in this part of the world.                          cultivation and organic fertilization techniques.
                                                      Innovation in African agriculture and other                            The rate of increase in yields was small, and so
                                                      regions of the developing world will be critical to                    expansion of cultivated areas accounted for most
                                                      solving the scourge of hunger and lifting the lot                      of the increases in total production. A century ago,
                                                      of the billions of the world’s people who rely on                      Gregor Mendel’s research describing the pattern of
                                                      agriculture for a living, and all the world’s poor                     genetic inheritance, first published by the Austrian
                                                      who rely on agriculture for their sustenance.3 How                     botanist and monk in 1865, was rediscovered and
                                                      does this all square with the recent and pervasive                     reconfirmed. Thus the modern era of scientific
                                                      declines in the growth of spending for agricultural                    breeding began.
                                                      R&D that this report will reveal?
                                                                                                                             Starting in the late 19th century, average yields of
                                                      Relying on home-grown technologies is one source                       major crops in North America, Europe, and Japan
                                                      of growth in agriculture. Tapping technologies                         began to increase at rates well beyond historical
                                                      developed in other places—especially in the                            precedent. For example, beginning with an average
                                                      rich countries where the preponderance of the                          wheat yield of 15 bushels per acre in 1866 (the
                                                                                                                             earliest year for which reliable data are available), it
S C I E N C E, T E C H N O LO G Y A N D S K I L L S

                                                         2 See DeVries and Toenniessen (2001) for much more                  took 103 years, until 1969, for U.S. yields to double
                                                      elaboration on this point.                                             (Figure 2). Yield growth accelerated in the second
                                                          3 Cassman and Wood (2006, p. 781) observed that “Cultivated        half of the 20th century; it took only 48 years from
                                                      systems play a vital role in global economic wellbeing, especially
                                                      in poorer countries. In 2000, agriculture (including forestry and
                                                                                                                             1957 for U.S. wheat yields to double and reach the
                                                      fishing) represented 24 percent of total GDP [Gross Domestic           42 bushels per acre reaped in 2005. Similar yield
                                                      Product] on average in countries with per capita incomes less the
                                                      $765 (the World Bank 2003 threshold designating low-income
                                                                                                                             accelerations occurred in many other crops in the
                                                      countries). About 2.6 billion people depend on agriculture for their   United States.
                                                      livelihoods, either as actively engaged workers or as dependents
                                                      (FAOSTAT 2004). In 2000, just over half (52 percent) of the world’s
                                                      population were living in rural areas and, of these, about 2.5         It would be a mistake to interpret the
                                                      billion people were estimated to be living in agriculturally based     comparatively slow growth in average U.S. wheat
                                                      households (World Bank 2003). The global agricultural labor force
                                                      includes approximately 1.3 billion people, about a fourth (22          yields during the 19th century as an indication
                                                      percent) of the world’s population and half (46 percent) of the        that productivity growth was largely absent and
10                                                    total labor force (Deen 2000).”
Figure 2: Wheat Yields, 1800-2004

                             9

                             8

                             7
  Yield (Tons per Hectare)

                             6

                             5

                             4

                             3

                             2

                             1

                             0

                                                                                               02
                                 00

                                      70

                                              76

                                             82

                                                     88

                                                          94

                                                               00

                                                                    06

                                                                         12

                                                                               18

                                                                                       24

                                                                                      30

                                                                                               36

                                                                                               42

                                                                                               48

                                                                                               54

                                                                                               60

                                                                                               66

                                                                                               72

                                                                                               78

                                                                                               84

                                                                                               90

                                                                                              96
                                                                                            20
                                 18

                                      18

                                           18

                                           18

                                                     18

                                                          18

                                                               19

                                                                    19

                                                                         19

                                                                              19

                                                                                    19

                                                                                    19

                                                                                            19

                                                                                            19

                                                                                            19

                                                                                            19

                                                                                            19

                                                                                            19

                                                                                            19

                                                                                            19

                                                                                            19

                                                                                            19

                                                                                            19
                                                UK         France             US         India        Argentina      China        Canada

  Source: Developed by Pardey using data from numerous sources.

that few mechanical, biological (e.g., new crop                                             lower absent changes in the biological basis of U.S.
varieties) and crop management innovations                                                  wheat production.
were forthcoming. In the early 1800s, U.S. wheat
production was confined almost exclusively to                                               Many crops in many developed countries saw a
the eastern part of the country; mainly Ohio and                                            sharp up-turn in their average yield performance
upstate New York. By 1909, areas west of the                                                in the middle of the 20th century as an increasing
Appalachian Mountains accounted for 92 percent                                              number of genetically improved varieties, targeted
of U.S. wheat production compared with less                                                 to particular agroecological zones, became
than one half of output in 1839 (Olmstead and                                               available. Beginning in the 1950s and continuing
Rhode 2002). Similar spatial and temporal effects                                           at an accelerated pace in the 1960s and 1970s,
have been evident elsewhere in the world, and so                                            improved varieties also became available to
reported changes in average crop yields may be a                                            many more farmers in developing countries from
misleading indicator of the rate and extent of the                                          international and national agricultural research
                                                                                            centers, and average yields took off in many, but by
                                                                                                                                                   S C I E N C E, T E C H N O LO G Y A N D S K I L L S

technical changes in agriculture; be these changes
attributable to the innovative efforts of farmers                                           no means all, of those countries as well.
or more formal forms of R&D. Massive changes in
varietal use facilitated this spatial relocation of U.S.                                    A key to these widespread yield gains was the
wheat production into new locations—specifically                                            rapid spread of modern (often short-statured,
the Northern Prairies and the Great Plains—and                                              so-called semi-dwarf ) rice and wheat varieties
new agroecologies, where the varieties suitable for                                         throughout the developing world; initially
locations on the eastern seaboard faltered or failed.                                       through the adoption of cultivars developed in
Moreover, staving off the effects of ever-evolving                                          international research centers over wide areas with
pests and diseases through the use of resistant                                             favorable environments, and then via adaptation
varieties and management practices means that                                               of this germplasm to local ecologies and consumer
reported average yields would have been much                                                preferences. Asia was quickest to embrace these
                                                                                                                                                   11
new varieties, while varietal change lagged in sub-                                     been deregistered or have become progressively
                                                      Saharan Africa, partly because of the great diversity                                   ineffective, but the cost of registering new
                                                      in agroecologies (Figure 3).                                                            agricultural chemicals has grown so much that
                                                                                                                                              many companies are abandoning the development
                                                      Globally, average yields have climbed steadily for all                                  of pesticides for crops that are relatively minor in a
                                                      major cereals, at least since the 1960s. Since 1961,                                    global setting but, perhaps, are still important for
                                                      around 78 percent of the increase in production                                         some farmers in some countries (Kalaitzandoakes,
                                                      has come from increases in yields, except in Africa                                     Alston and Bradford 2007; Service 2007). A part
                                                      where about 60 percent of the gains have come                                           of the response has been increased efforts in
                                                      from expanding the area of cultivation.4 Achieving                                      integrated pest management, breeding, and
                                                      future yield increases is one thing, maintaining                                        biotechnology, to develop genetic resistance or
                                                      past yields is another. Indeed “maintenance                                             environmentally friendly pest-control systems.
                                                      research,” research directed at maintaining yields
                                                      and profitability in the face of pressures that
                                                      would lead them to fall otherwise, is a major                                           Partial Productivity Trends
                                                      component of agricultural R&D (perhaps especially
                                                                                                                                              In Figure 4, the graphical technique of Hayami
                                                      in relation to crop and livestock disease prevention
                                                                                                                                              and Ruttan (1985) is used to plot logged ratios
                                                      and eradication programs). Such maintenance
                                                                                                                                              of agricultural output per hectare and output
                                                      research has become more important in recent
                                                                                                                                              per worker for nine regions of the world as well
                                                      years as a result of environmental and health-
                                                                                                                                              as the Former Soviet Union and Japan (together
                                                      related laws and regulations. Some pesticides have
                                                                                                                                              representing 231 countries) for each of the years
                                                                                                                                              1961 to 2003.
                                                         4 Pardey and Wood’s calculations based on growth
                                                      decomposition of the production identity (yield x harvested area
                                                      = output) and using FAO data.

                                                         Figure 3: Uptake of Modern Crop Varieties by Decade and by Region

                                                                                100                                                                                  100
                                                         Percent Area Planted

                                                                                                                                              Percent Area Planted
                                                          to Modern Varieties

                                                                                                                                               to Modern Varieties

                                                                                 80                                                                                   80

                                                                                 60                                                                                   60

                                                                                 40                                                                                   40

                                                                                 20                                                                                   20

                                                                                  0                                                                                    0
                                                                                      1960s       1970s         1980s       1990s                                          1960s     1970s          1980s   1990s
                                                                                                    Latin America                                                                            Asia

                                                                                100                                                                                  100
                                                         Percent Area Planted

                                                                                                                                              Percent Area Planted
                                                          to Modern Varieties

                                                                                                                                               to Modern Varieties

                                                                                 80                                                                                   80
S C I E N C E, T E C H N O LO G Y A N D S K I L L S

                                                                                 60                                                                                   60

                                                                                 40                                                                                   40

                                                                                 20                                                                                   20

                                                                                  0                                                                                    0
                                                                                      1960s       1970s         1980s       1990s                                          1960s     1970s          1980s   1990s
                                                                                              Middle East – North Africa                                                            Sub-Saharan Africa

                                                                                                      Protein       Root            Other                 Maize              Rice      Wheat
                                                                                                      Crops         Crops           Cereals

                                                         Source: Evenson and Gollin (2003).

12
Figure 4: Agricultural land and labor productivity, 1961-2003
  Agricultural Output per Hectare (1999-2001 International Dollars - logscale)

                                                                                         All trajectories start in 1961 on left/bottom and end in 2003 on right/top, unless indicated.

                                                                                                                                             0.37 ha/worker            1 ha/worker          2.7 ha/worker       7.3 ha/worker
                                                                                                                                                                                                                                    20 ha/worker
                                                                                 3,000

                                                                                                                            Japan                                                                                                   55 ha/worker
                                                                                                                                                                                              Western
                                                                                                                                                                                              Europe
                                                                                 1,100                                                                                        EE:1990

                                                                                                                                            Eastern
                                                                                                                                            Europe
                                                                                                                                                                                                                                    150 ha/worker
                                                                                                                                                               EE:1994                                       North
                                                                                  400                                                                                                                       America
                                                                                                                                                                                 FSU:1990
                                                                                                                  Asia
                                                                                                                & Pacific                   2003
                                                                                                                                  1987                                      Former                                                  400 ha/worker
                                                                                            China                                                                         Soviet Union
                                                                                  150                               Middle East
                                                                                                                   & North Africa                                  FSU:1998

                                                                                                             2003                         1995     Latin America
                                                                                                                                                    & Caribbean
                                                                                                                                                                                                                                    1091 ha/worker
                                                                                                                                    1961
                                                                                   55
                                                                                                      1984                                                                                           Australia
                                                                                                                                                                                                  & New Zealand
                                                                                                               Sub-Saharan
                                                                                                    1961      Africa (incl. SA)

                                                                                   20
                                                                                          150                400                  1,100                3,000                  8,100            22,000             60,000

                                                                                                           Agricultural Output per Worker (1999-2001 International Dollars - logscale)

                                                                                                    China                                              Latin America & Caribbean                    Middle East & North Africa
                                                                                                    Asia & Pacific                                     Former Soviet Union                          Eastern Europe
                                                                                                    Australia & NewZealand                             Japan                                        Sub-Saharan Africa (incl. SA)
                                                                                                    Western Europe                                     North America

  Source: Developed by Pardey and Wood using data from FAO (2006).
  Notes: Workers are economically active in agriculture. Land is the sum of area harvested and permanently pastured. Output is
  value of agricultural production formed by weighting a time series of commodity quantities for each country by a 1999-2001
  average of commodity-specific international prices. All productivity trajectories start in 1961 on left/bottom and end in 2003 on
  right/top, unless indicated. Diagonal lines indicate constant factor (land to labor) ratios.

All of the productivity paths move in a                                                                                                                                       these diagonal lines (e.g., Japan in more recent
northeasterly direction starting in 1961 and                                                                                                                                  decades), it indicates an increase in the number
ending in 2003, indicating increasing productivity.                                                                                                                           of agricultural hectares per agricultural worker
A longer productivity locus means a greater                                                                                                                                   in that country as we move from left to right: in
percentage change in productivity. China, and the                                                                                                                             Japan’s case from 0.59 hectares per worker in 1961
                                                                                                                                                                                                                                                     S C I E N C E, T E C H N O LO G Y A N D S K I L L S

Asia & Pacific region experienced the fastest rate of                                                                                                                         to 1.57 in 2003. Land-labor ratios in Australia and
growth of land productivity (respectively, 3.4 and                                                                                                                            New Zealand have changed little, whereas they
2.8 percent per year), the Former Soviet Union the                                                                                                                            have risen by some 73 percent in North America.
slowest (0.08 percent). With a rapid exodus of labor                                                                                                                          They also rose, albeit very slowly, for the Latin
from agriculture, Japan’s labor productivity grew                                                                                                                             America and Caribbean region, consistent with the
the fastest (5.15 percent per year) and sub-Saharan                                                                                                                           region’s labor productivity growing slightly faster
Africa (including South Africa) the slowest (0.35                                                                                                                             than its land productivity. Sub-Saharan Africa has
percent).                                                                                                                                                                     become much more labor intensive so land-labor
                                                                                                                                                                              ratios have declined. In 1961 the region had 10.5
The diagonal lines in Figure 4 indicate constant                                                                                                                              hectares per agricultural worker, but by 2003 the
factor (specifically, land to labor) ratios. When
a region’s productivity locus is flatter than                                                                                                                                                                                                        13
land-labor ratio had nearly halved to 5.4 hectares                      One of the most common risk-management
                                                      per worker.5                                                            strategies in drought-prone areas is varying
                                                                                                                              planting dates with variation in the timing of the
                                                                                                                              opening rains. Another is investment in irrigation
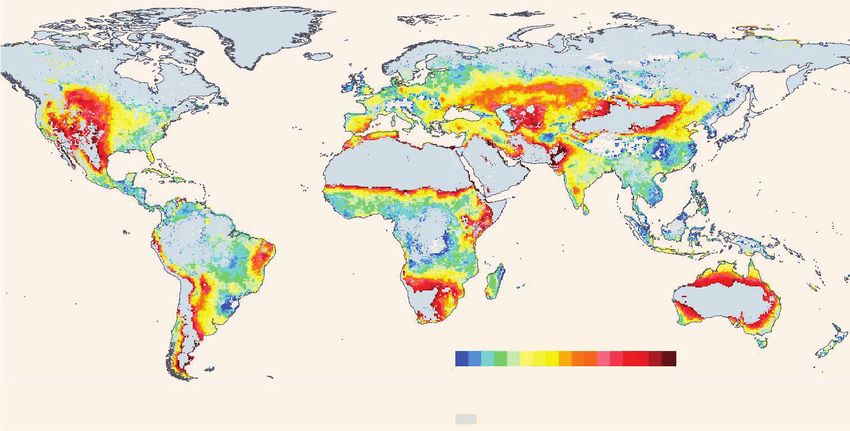
                                                      1.2 CROP YIELD VARIABILITY                                              capacity (Figure 6). Irrigation provides the double
                                                                                                                              benefits of both increasing and stabilizing yields,
                                                      While raising average crop yields is an essential
                                                                                                                              thereby providing greater incentives for farmers
                                                      element in improving land and labor productivity,
                                                                                                                              to invest in complementary inputs. However, not
                                                      reducing year-to-year yield variability is also
                                                                                                                              all governments nor all farmers have the means
                                                      critically important, especially for smallholder
                                                                                                                              to invest, and not all locations are amenable
                                                      agriculture. The more uncertain is the likely
                                                                                                                              to irrigation. Areas of high moisture variability
                                                      harvest outcome the more cautious subsistence
                                                                                                                              (depicted in Figure 5) that are not matched by
                                                      farmers may be in the selection of crops, seeds
                                                                                                                              mitigating investments in irrigation capacity
                                                      and management practices to be sure they can
                                                                                                                              (depicted in Figure 6, for example the Sahel) might
                                                      meet minimum food subsistence. This means,
                                                                                                                              be considered prime target areas for other forms of
                                                      for example, persevering with tried and tested
                                                                                                                              mitigating technologies, such as the introduction
                                                      landraces (i.e., farmer-bred crop varieties) and
                                                                                                                              of crops and crop varieties with greater drought
                                                      traditional varieties whose average yields are low
                                                                                                                              tolerance.
                                                      but more assured, even when rains are erratic. The
                                                      greater the chance that crops will fail because of
                                                                                                                              The countries of the Former Soviet Union (FSU)
                                                      uncontrolled weather or other effects, the less likely
                                                                                                                              and West Asia and North Africa (WANA) contain the
                                                      it is that farmers will purchase and use improved
                                                                                                                              greatest share—more than 40 percent—of their
                                                      seeds or other inputs such as fertilizers. The poorer
                                                                                                                              cultivated land in drier areas (length of growing
                                                      the household, the more extreme this type of
                                                                                                                              periods less than 120 days per year). High-income
                                                      risk-averse behavior may be. Such conditions
                                                                                                                              regions such as Australia and North America also
                                                      limit incentives for smallholder adoption of new
                                                                                                                              have a high share of low rainfall croplands (36
                                                      technologies—whose higher attainable yields
                                                                                                                              percent and 27 percent respectively). These data
                                                      often depend on more stable (and typically more
                                                                                                                              indicate that about a quarter of the cropland in
                                                      favorable) production environments.
                                                                                                                              South Asia (and a fifth of sub-Saharan Africa’s
                                                                                                                              cropland) is located in low rainfall areas.6 The year-
                                                      Crop yields are highly susceptible to a number
                                                                                                                              to-year variability of moisture availability follows
                                                      of factors farmers cannot control, including 1)
                                                                                                                              broadly similar patterns. Australia, the FSU and
                                                      weather patterns and unexpected or extreme
                                                                                                                              North America have around 60 percent, 45 percent
                                                      weather events, 2) the incidence and severity of
                                                                                                                              and 37 percent respectively of their cropland in
                                                      pest and disease outbreaks and weed infestations,
                                                                                                                              higher variability areas (i.e., where the coefficient
                                                      3) costly and erratic access to labor and purchased
                                                                                                                              of variability of moisture availability exceeds 20
                                                      inputs because of inadequate transport,
                                                                                                                              percent). Only some 24 percent and 15 percent
                                                      communication and physical infrastructure, for
                                                      instance, and 4) variability in seed quality. Weather-
                                                      related production risks include those of unreliable                        6 Substantial and systemic weaknesses in the satellite-based
S C I E N C E, T E C H N O LO G Y A N D S K I L L S

                                                                                                                              estimates of cropland in sub-Saharan Africa, however, indicate
                                                      rainfall, unexpected frosts, high winds, hail, and                      large degrees of uncertainty in these area estimates (Wood et
                                                      flooding. Among these, drought is perhaps the                           al. 2000). A simple pixel-to-pixel comparison of “cropland” and
                                                                                                                              “cropland mosaic” classes for two independent satellite-based,
                                                      most ubiquitous source of yield variability in                          global estimates of land cover for 2000 illustrate the problem.
                                                      developing-country agriculture. Figure 5 depicts                        Only 60 percent of the pixels considered to be cropland in one
                                                                                                                              dataset (MODIS) were recognized as cropland in the other (GLC-
                                                      the spatial pattern of variability over time in the                     2000). In the case of cropland mosaics—the predominant type of
                                                      length of the annual growing period as a measure                        land cover in smallholder subsistence farming in the tropics and
                                                                                                                              sub-tropics—the degree of spatial coincidence between the two
                                                      of the susceptibility of each location to drought.                      datasets falls to only 13 percent (Giri, Zhu and Reed 2005). The
                                                                                                                              degree of spatial disparity between these datasets is even more
                                                                                                                              pronounced in sub-Saharan Africa where, in total, GLC-2000
                                                                                                                              detects some 9.8 percent and 7.1 percent respectively of cropland
                                                         5 These substantive differences in productivity paths and            and cropland mosaic as a share of total land area. The MODIS
                                                      factor use ratios highlight the need to tailor and adapt agricultural   data, however, based on similar resolution observations for the
                                                      technologies to local production realities, a theme to which we         same year only detects 1.9 percent and 0.8 percent respectively of
14                                                    return below in the context of R&D spillovers.                          cropland and cropland mosaic in the region (IFPRI 2006).
Figure 5: Variability in Moisture Availability for Rainfed Cultivated Land, 1960-1990

                                                                                    Length of Growing
                                                                                     Period Variability
                                                                                   (coefficient of variation)

                                                                        0      .05 .1        .2 .3 .4 .6 .8 1
                                                                  no variability                                high variability
                                                                              outside the extent of agricultural areas

Source: Adapted from Wood, Sebastian and Scherr (2000).
Note: The length of growing period (LGP) is the number of days per year in which moisture and temperature conditions will
support plant growth. It is used here as an indicator of moisture availability for rainfed production. The map shows year-to-
year variability in LGP calculated over a 30 year period (1960-90). This index serves as a measure of farmers’ likely exposure to
climatological risk. Areas with higher variability are expected to experience greater impacts from changes in climate.

Figure 6: Area Equipped for Irrigation, circa 2000

    Area Equipped
     for Irrigation
        (percent)
            1 – 20
                                                                                                                                    S C I E N C E, T E C H N O LO G Y A N D S K I L L S

           20 – 40
           40 – 60
           60 – 80
           80 – 100

Source: Adapted from Siebert, Döll, Feick and Hoogeveen. (2006).
Note: This map identifies ‘the percent area equipped for irrigation around the turn of the 21th century based on statistical and
spatial data at a resolution of 5 minutes (10x10 km).’ These data have been calibrated at the country level to FAO irrigated area
statistics and help improve our knowledge of the location and extent of irrigated areas (for further information see http://www.
fao.org/ag/agl/aglw/aquastat/irrigationmap/index10.stm).

                                                                                                                                    15
respectively of cropland in WANA and Sub-Saharan          Evidence on Returns to Agricultural R&D
                                                      Africa exhibit these more variable growing seasons.
                                                      The major difference between regions, however, is         Market failure leads to private-sector under-
                                                      the extent to which irrigation investments have           investment in agricultural R&D, a phenomenon
                                                      been made. In WANA, irrigated area represents             that can account for the major result from the
                                                      around 37 percent of total harvested area                 empirical literature across different commodities
                                                      (although a much higher percentage of physical            and different countries, that agricultural R&D has
                                                      cropland must be irrigated since multiple harvests        been, on average, a highly profitable investment
                                                      are made annually from some cropland areas). In           from society’s point of view.
                                                      North America, irrigated area represents around 17
                                                      percent of the total harvested area, while in Sub-        Alston et al. (2000) reviewed the published
                                                      Saharan Africa it is just 4 percent (Wood et al. 2000).   evidence on rates of return to agricultural R&D. A
                                                      Sub-Saharan African farmers, therefore, are more          total of 287 benefit-cost studies of agricultural R&D
                                                      vulnerable to drought than their counterparts in          (including extension) were compiled and these
                                                      other parts of the world, even though the areas           studies provide 1,789 separate estimates of rates
                                                      of agriculture that are susceptible to drought are        of return. This includes some extreme values which
                                                      smaller than other regions of the world.                  are implausible. When the lowest and highest 5
                                                                                                                percent were set aside, the estimated annual rates
                                                      The discussion leads to two key implications for          of return averaged 58 percent for research only, and
                                                      research strategy. First, crop technology packages        44 percent for research and extension combined.
                                                      targeted to the poor in areas prone to yield              But these averages conceal a lot, and reveal little
                                                      variability must be designed to help mitigate             meaningful information from a large and diverse
                                                      rather than exacerbate such variability if they are       body of literature that provides rate-of-return
                                                      to find acceptance. Second, it is important to take       estimates that are often not directly comparable.
                                                      account of post and prospective infrastructural
                                                      investments such as irrigation and roads, as well
                                                                                                                Policies to Address Underinvestment
                                                      as agro-ecological factors, when considering the
                                                      suitability of technologies targeted to specific agro-    in Agricultural R&D
                                                      ecological and production system complexes.
                                                                                                                Evidence of high rates of return to agricultural
                                                                                                                R&D suggests that research has been under-
                                                      2. THE CHANGING CONTEXT                                   funded, and that current government intervention
                                                      FOR AGRICULTURAL R&D                                      has been inadequate. However, this does not
                                                                                                                necessarily imply that the amount of government
                                                                                                                spending should increase. Changes in government
                                                      2.1 ECONOMIC REALITIES OF                                 intervention to address the market failure can
                                                      AGRICULTURAL R&D                                          take many forms. Some commentators focus
                                                                                                                on increased funding of R&D from general
                                                      Market failure in agricultural R&D arises primarily       government revenues, but this is only a part of the
                                                      from incomplete or ineffective property rights            picture. Government can also act to change the
S C I E N C E, T E C H N O LO G Y A N D S K I L L S

                                                      over inventions, which mean that inventors are            incentives for others to increase their investments
                                                      unable to fully appropriate the returns to their          in private or public R&D (as well as what research is
                                                      research investments. Market failures in research         done, by whom, and how effectively).
                                                      can happen at the level of farms or firms within a
                                                      state or country, among states within a country,          A premise that government intervention is
                                                      or among countries—in any context where the               inadequate implies simply that the nature of the
                                                      distribution of benefits from adopting the results        intervention ought to change so as to stimulate
                                                      does not closely match the distribution of the costs      either more private investment or more public
                                                      incurred in doing the research.                           investment. Policy options available to the
                                                                                                                government for stimulating private funding
                                                                                                                or performance of agricultural R&D include:
16                                                                                                              improving intellectual property protection;
changing institutional arrangements to facilitate       Second, the types of technologies suited to much
collective action by producers, such as establishing    of less-developed country agriculture have hitherto
levy arrangements; and encouraging individual or        been of the sort for which appropriability problems
collective action through the provision of subsidies    are more pronounced—types of technology that
(or tax concessions) or grants in conjunction           have been comparatively neglected by the private
with levies. In addition to efficiency gains from       sector even in the richest countries. In particular,
increasing the total R&D investment, governments        until recently, private research has tended to
can also intervene with a view to improving the         emphasize mechanical and chemical technologies,
efficiency with which resources are used within the     which are comparatively well protected by patents,
R&D system.                                             trade secrecy and other intellectual property rights;
                                                        and the private sector has generally neglected
Changes over time in economic circumstances             varietal technologies except where the returns are
imply changes in R&D institutions. Some research        appropriable, such as for hybrid seed (see Knudson
activities that were once clearly perceived as the      and Ruttan 1988). In less-developed countries
province of the government have become part             the emphasis in innovation has often been on
of the private domain. Examples include much            self-pollinating crop varieties and disembodied
applied work into the production and evaluation         farm management practices, which are the least
of agricultural chemicals and new plant varieties.      appropriable of all. The recent innovations in rich-
                                                        country institutions mean that private firms are
                                                        now finding it more profitable to invest in plant
Distinctive Features of Less-
                                                        varieties, and the same may be true in some less-
Developed Countries                                     developed countries, but not all countries have
                                                        made comparable institutional changes. Only
These general notions about market failure and
                                                        when we achieve a reasonable rate of inventor
options for government action apply generally,
                                                        appropriability of the returns to the technologies
but with different specific implications as cases
                                                        that are applicable in less-developed countries,
change. In particular, for a number of reasons,
                                                        combined with an economic infrastructure that
we can predict that the phenomenon of private-
                                                        facilitates adoption of those technologies, can we
sector neglect and national under-investment in
                                                        expect a significant private-sector role to emerge.
agricultural R&D is likely to be more pronounced in
less-developed countries than in developed ones,
                                                        A third factor is that in many less-developed
and this prediction is borne out by the facts. Why is
                                                        countries, prices have been distorted by policies
this so, and what does it imply?
                                                        in ways that meant incentives and opportunities
                                                        for farmers to adopt new technologies were
First, less-developed countries are commonly
                                                        diminished (see Schultz 1978, Alston and Pardey
characterized as having a comparatively high
                                                        1993, and Sunding and Zilberman 2002).
incidence of incomplete markets, resulting from
high transaction costs and inadequate property
                                                        Fourth,     government        revenues      may     be
rights, which in turn may be attributable to
                                                        comparatively expensive, or have a comparatively
inadequate infrastructure and defective institutions,
                                                        high opportunity cost in less-developed countries.
                                                                                                                  S C I E N C E, T E C H N O LO G Y A N D S K I L L S

among other things. To the extent that they exist,
                                                        This can be so because it is comparatively expensive
information problems, high costs of transport and
                                                        to raise government revenues through general
communication, ill-functioning credit markets, and
                                                        taxation measures. And it can be seen to be so when
the like, combined with less-educated farmers,
                                                        we consider that many less-developed countries
are likely to make it harder to capitalize on new
                                                        are characterized by under-investment in a host
inventions. In rich countries, we might discount
                                                        of other public goods, such as transportation and
the issues of risk and capital costs as factors that
                                                        communications infrastructure, schools, hospitals,
discourage investment in invention, but in less-
                                                        and the like, as well as agricultural science (Runge
developed countries these factors might take on a
                                                        et al. 2003). These other activities, like agricultural
different meaning, especially if capital markets do
                                                        science, might also have high social rates of return.
not function well—for whatever reason.
                                                                                                                  17
Fifth, there are political factors to consider. In       R&D. Both inadvertent technology spillovers and
                                                      rich countries, agriculture is a small share of          international initiatives such as the Consultative
                                                      the economy, and any individual citizen bears a          Group on Agricultural Research (CGIAR) and
                                                      negligible burden from financing a comparatively         bilateral agricultural R&D development aid might
                                                      high rate of public investment in agricultural R&D.      have crowded out some national investments in
                                                      The factors that account for high rates of general       agricultural R&D in less-developed countries.
                                                      support for agriculture in the industrialized
                                                      countries can also help account for their                An important consideration is economies of size,
                                                      comparatively high public agricultural research          scale, and scope in research, which influence the
                                                      intensities. In many less-developed countries,           optimal size and portfolio of a given research
                                                      where agriculture represents a much greater share        institution. In some cases the “optimal” institution
                                                      of the total economic activity, and where per capita     may efficiently provide research for a state or
                                                      incomes are much lower, a meaningful investment          region within a nation, but for some kinds of
                                                      in public agricultural research might have a much        research the efficient scale of institutions may be
                                                      more appreciable impact on individual citizens—          too great for an individual nation (see, for example,
                                                      and the problem is that this burden is felt now,         Byerlee and Traxler 2001). Many nations may be
                                                      while the payoff it promises may take a long time        too small to achieve an efficient scale in much if
                                                      to come, and will be much less visible when it           any of the relevant elements of their agricultural
                                                      does.                                                    R&D interests, except perhaps in certain types of
                                                                                                               adaptive research. Table 1, for example, shows that
                                                      Finally, even among the rich countries of the            40 percent of the agricultural research agencies in
                                                      world, most have not had very substantial private        sub-Saharan Africa employed fewer than five full-
                                                      or public agricultural science industries; so why        time-equivalent researchers in 2000; 93 percent of
                                                      should we expect the poorest countries of the            the region’s agricultural R&D agencies employed
                                                      world to be more like the richest of the rich in         fewer than 50 researchers.
                                                      this regard? The lion’s share of the investment in
                                                      agricultural science has been undertaken by a small      A particular problem for global efficiency in
                                                      number of countries, and these have also been the        agricultural science, and for many smaller
                                                      countries that have undertaken the lion’s share          countries, is that we do not have effective
                                                      of scientific research, more generally (see Pardey       institutions for financing and organizing research
                                                      et al. 2006). Typically, these have been the larger,     on a multinational basis for those instances where
                                                      economic power-houses, especially the United             the research is applicable across multiple countries
                                                      States. Differences in per capita income, the total      and where individual countries are too small to
                                                      size of the economy, and comparative advantage           achieve efficient scale.7 R&D clusters or other forms
                                                      in science (reflecting not just wealth but also the      of collective action in R&D could be developed as
                                                      nature of the society), may all be factors that have     a means of achieving an efficient scale of research
                                                      determined the international distribution of the         operation and the application of the results of
                                                      burden of agricultural R&D investments.                  research, but against that must be offset the added
                                                                                                               costs of collaboration across research agencies,
                                                                                                               perhaps operating in different countries (see
S C I E N C E, T E C H N O LO G Y A N D S K I L L S

                                                      Economies of Size, Scale, and                            section 2.3 below and Pardey, Wood and Hertford
                                                      Scope in Agricultural R&D                                2007).

                                                      It might not make much economic sense for small,
                                                      poor, agrarian nations to spend their comparatively      2.2 CHANGING INCENTIVES
                                                      scarce intellectual and other capital resources in       TO INNOVATE
                                                      agricultural science, on their own behalf, in a world
                                                      in which other countries can do it so much more          The output of innovation activities can often be
                                                      effectively, and are doing so. And, in the past it has   easily copied and then used by others who had no
                                                      been an effective strategy for many nations to free-
                                                      ride on the efforts of a few others in agricultural         7 Jin, Rozelle, Alston and Huang (2005) provide evidence on
18                                                                                                             scale and scope effects of R&D in China.
Table 1: Size Distribution of Agricultural Research Agencies in Sub-Saharan Africa, 2000

  Number of fte researchers                Government        Higher education             Nonprofit        Private   Total
                                       Principal    Other
                                                                   (number of agencies)
  Less than 5                                7          34             103                      7             24     175
  5–9                                        7          27              42                      4              5      85
  10 – 19                                   15          14              32                      5              –      66
  20 – 49                                   29          16              23                      3              –      71
  50 – 99                                   11           3                –                     1              –      15
  100 – 200                                 10           –                –                     –              –      10
  Greater than 200                           5           –                –                     –              –       5

  Total                                     84          94              200                    20             29     427

  Source: Beintema and Stads (2004).

role in its production in ways that do not diminish          sui generis system specifically geared to protect
the availability of the innovation to other users.           plant varieties, though the scope of protection is
These characteristics of non-excludability and               much weaker than that of patents (Table 2).8
non-rivalry help enhance the social value of an
innovation by increasing the speed and reducing              The incentive effects of patents have long been
the cost of diffusion to potential users and                 recognized, as have the costs of restricting the use
reducing the price of the products of innovation             of the patented product or process for the duration
to consumers, if the innovation has already been             of the patent monopoly. In spite of generally
made. However, lack of excludability often means             wide support—at least among private innovators
there is insufficient incentive for the private sector       and policy makers—for government-sanctioned
to produce the innovation in the first place. Absent         systems of intellectual property rights as part of
some form of public intervention, it is often argued,        a modern system of innovation and economic
the extent of innovation is limited because the              development, a substantial minority holds a
appropriable returns to innovators are far less than         different view (see, for example, Boldrin and Levine
the social benefits.                                         2002).

Intellectual property rights (IPR) such as patents,          Mechanisms such as research contracts and prizes
trademarks, plant breeders’ rights and copyrights            may also be effective in generating new innovations
are among the more prominent public policy                   in certain circumstances (Wright et al. 2007). One
responses intended to stimulate the creation and             way to avoid monopoly pricing, which distorts the
dissemination of inventions. The scope, economic             innovative incentive, is for governments to collect
costs and administrative processes of these types of         research funds using an efficient tax system then
IPR vary, such that policy choices concerning which          distribute them to researchers through an efficient
                                                                                                                                 S C I E N C E, T E C H N O LO G Y A N D S K I L L S

IPR to offer and practical decisions about which IPR         system of research contracts and make the final
to seek are governed by the nature of innovations.           research output freely available. Alternatively,
The patent system, which provides the innovator              a government may award a prize to the first to
a monopoly right for a limited period in return              invent and pass the innovation immediately into
for the disclosure of the innovation, has attracted          the public domain. While these types of innovation
much attention, partly because of its economic
and political implications. In recent years, many
                                                                8 Sui generis in Latin means “of its own kind,” and in TRIPS—
countries have strengthened their patent systems             the multilateral Trade-Related Aspects of Intellectual Property
as part of domestic initiatives to upgrade their             Rights agreement among the members of the World Trade
                                                             Organization (WTO) developed during the 1986-1994 Uruguay
national innovation systems (Mowery 1998), or                Round negotiations of the General Agreement on Tariffs and
to comply with post-TRIPS bilateral or multilateral          Trade (GATT)—the phrase is used to indicate a flexibility whereby
                                                             WTO member countries can individually design a system of plant
agreements. Plant breeders’ rights are a form of a           variety protection tailored to their country circumstances.         19
Table 2: Illustrative Sui Generis Legislation

                                                                               Name of System               Key Features
                                                        UPOV Convention        Plant Breeders’ Rights       • confers right to exclude others from
                                                                                                                • producing, reproducing, or propagating
                                                                                                                • selling, offering for sale or other marketing
                                                                                                                • exporting or importing; and
                                                                                                                • stocking the variety for any of the above
                                                                                                            • rights extend to ‘essentially derived varieties’a
                                                                                                            • breeder’s exemption from infringement (optional in 1991 Act)
                                                                                                            • farmer’s privilege to save seed (optional in 1991 Act)
                                                        United States          Plant Variety Protection     • covers sexually reproduced plants, including first generation hybrids and
                                                                                                              tuber propagated plant varieties
                                                                                                            • rights same as 1991 UPOV Convention
                                                                                                            • limited farmer’s exemption: seed may be saved for replanting only on farmer’s
                                                                                                              own land, but if not used, saved seed may be sold
                                                                                                            • breeder’s exemption available
                                                                               Plant Patents                •   only covers asexually reproduced plant varieties
                                                                                                            •   plants may be newly found or cultivated
                                                                                                            •   protection is for a single plant or genome
                                                                                                            •   no experimental use or breeders’ exceptions to infringement
                                                                               Utility Patents              • patentable subject matter includes plant varieties, parts of plants, genetically
                                                                                                              engineered organisms, processes of transforming cells and expressing
                                                                                                              proteins, gene or methodology
                                                                                                            • can have multiple claims for different aspects of inventions
                                                                                                            • no breeder’s or farmer’s exemptions, but has a very narrow experimental
                                                                                                              exemption
                                                                                                            • more expensive to seek and sustain, but has stronger and broader protection
                                                        European Union         CPVRb                        • rights same as 1991 UPOV Convention
                                                                                                            • farmer’s privilege only for a limited number of fodder plants, cereals, potatoes,
                                                                                                              and oil and fiber plants and only available to farmers with small holdings
                                                                                                            • breeder’s exemption available
                                                                                                            • protection is alternative to that given individually by member countries
                                                        India                  PPVFRc                       • protectable plant varieties include
                                                                                                                • new varieties
                                                                                                                • extant varieties
                                                                                                                • essentially derived varieties
                                                                                                                • farmers’ varieties
                                                                                                            • farmers may save, use, sow, re-sow, exchange, share or sell her farm produce
                                                                                                            • exemptions for research
                                                                                                            • compulsory licensing provided for

                                                        Source: Compiled by Koo and Pardey based on the respective legislation obtained from various on-line sources.
                                                        a
                                                          Plants that require the protected variety for their production
                                                        b
                                                          Community Plant Variety Right
                                                        c
                                                          Protection of Plant Varieties and Farmers’ Rights Act

                                                      processes avoid monopoly pricing behavior and                            the reputational effects of involvement in open
S C I E N C E, T E C H N O LO G Y A N D S K I L L S

                                                      thereby increase consumer benefits, the problem                          source (Lerner and Tirole 2002), the efficiency of
                                                      remains of setting the right prize or contract                           a decentralized approach to debugging a system
                                                      support according to the value of the innovation.                        with millions of potential configurations (Bessen
                                                                                                                               2004), the intrinsic motivation of delight in
                                                      More recently, “open source” approaches to                               solving an intellectual challenge, and the reward
                                                      developing software products using, for example,                         of recognition by one’s peers. Some people argue
                                                      Apache and Linux have attracted much attention                           that this approach offers a way of reconciling the
                                                      as a collaborative approach to innovation                                public interest in minimizing restrictions on access
                                                      development (Benkler 2004). Explanations for the                         to new technologies (Lerner and Tirole 2005),
                                                      incentive to reveal one’s innovations in an open                         and thus similar innovation systems have been
                                                      source context include the “career concerns” of                          suggested in other areas of industry. The recent
20                                                    participants who expect to gain indirectly from                          Biological Innovation for Open Society (BIOS)
initiative arising out of CAMBIA is an attempt to                   for example) was clear and the information gaps
initiate open-source development of key enabling                    between those funding and those doing the
technologies for agricultural biotechnology using                   research were limited, block funding or contract
licensing strategies inspired by the open source                    research (supplemented by “prizes,” including
movement in software (Nature 2004). In addition,                    professional recognition, academic tenure
the Public-Sector Intellectual Property Resource                    and salary enhancements) called forth much
for Agriculture (PIPRA) initiative is an attempt                    innovative effort that yielded high rates of return
by public and nonprofit researchers to provide                      overall compared with many other forms of public
mutually consenting parties with reciprocal access                  investments.
to their proprietary technologies, while also
making such technologies available to developing-                   Another aspect of the patent system that is
country researchers in ways that do not relinquish                  especially pertinent to agriculture involves the
licensing options and potential royalty revenues                    dynamic distortion of incentives arising from
from private-sector entities in developed countries                 the cumulative nature of many innovation
(Graff et al. 2003; Atkinson et al. 2003; and Delmer                processes in agriculture (for example, most
et al. 2003).                                                       crop breeding research, wherein each round of
                                                                    varietal improvement draws directly on the many
                                                                    rounds of R&D that preceded it). A special case of
Patents—Their Pros and Cons                                         cumulative innovation involves the development
                                                                    of research tools—that is, products or processes
The specific characteristics of information goods
                                                                    whose value stems solely from their input to
are such that a first-best solution is unattainable.
                                                                    follow-on innovations (Koo and Wright 2005). One
Patents are a second-best solution in that their
                                                                    prominent example in agriculture is the suite of
positive effects on incentives to innovate are
                                                                    inventions that make possible agrobacterium-
balanced against the negative monopoly effects
                                                                    mediated transformations of plants (Roa-Rodriquez
that come with the market provision of patented
                                                                    et al. 2003). When innovation is cumulative, a
innovations. Alternative incentive mechanisms,
                                                                    strong patent on an initial innovation might
such as research contracts and prizes, avoid the
                                                                    stimulate the earlier-than-otherwise development
costs of patent monopolies. However, as Wright
                                                                    of the innovation but reduce the incentive for
(1983) showed, the superiority of one mechanism
                                                                    subsequent innovations, while a weak patent may
over another depends on the relevant information
                                                                    not even induce the initial innovation thereby
held by each party. If innovators hold superior
                                                                    undercutting subsequent innovations. This
information about the cost of research or the value
                                                                    intertemporal, dynamic distortion of incentives
of the (pending) innovation, then patents can be
                                                                    can be more serious than the static inefficiency
a superior incentive mechanism to contracts or
                                                                    of the monopoly loss because the entire research
prizes.9
                                                                    sequence can easily be blocked if incentives at any
                                                                    stage are inappropriate.
These insights explain the success of an innovation
system that has given rise to a high rate of technical
                                                                    In agricultural biotechnology, concerns have also
change in agriculture over the past century, long
                                                                    been expressed about research hold-ups arising
                                                                                                                                       S C I E N C E, T E C H N O LO G Y A N D S K I L L S

before intellectual property rights became a
                                                                    from independent claims on multiple, mutually
significant force in the agricultural biosciences.
                                                                    blocking inputs. A frequently cited example is
When the overall objective (more food at lower
                                                                    the intellectual property landscape surrounding
prices or improved nutrition and public health,
                                                                    the development of Golden Rice technology,
                                                                    as described in Kryder et al. (2000).10 Relatedly,
   9 Kremer (1998) proposed buying out patents as a means of
retaining the incentive to innovate advantages of a patent system
while avoiding the monopoly price distortions that go with such a      10 Binenbaum et al. (2003) questioned the veracity of these
system. Masters (2003 and 2005) has advocated a system of prizes    claims in most developing-country contexts. For the specific
calculated as a percentage of the surplus generated in African      case of Golden Rice, the technology timeline described in
agriculture to partially compensate innovations targeted to this    Box 1 of this report makes readily apparent that factors other
sector. Shavell and Ypersele (2001) showed that a reward system     than constraints on access to intellectual property have been
(such as a prize) when combined with a patent system can be         important determinants of the length of time required to develop
superior to the patent system alone.                                and commercialize this new technology.                             21
Box 1: Golden Rice

                                                      by Jorge Mayer, Golden Rice Project Manager, Campus Technologies Freiburg

                                                      Worldwide, more than 10 million children die every year from malnutrition. Simple measures, like
                                                      breastfeeding, vitamin A and zinc supplementation could reduce the death toll by 25 percent (Black
                                                      et al. 2003). The main energy nutrition sources in developing countries are starchy crops low in
                                                      provitamin A and other micronutrients. Some 127 million preschool children or about one-quarter
                                                      of all preschool children in high-risk regions of the developing world are vitamin A deficient. Vitamin
                                                      A deficiency, alone or combined with other nutrient deficiencies, can lead to night blindness and
                                                      ultimately irreversible eye damage, growth retardation, damage of mucous membrane tracts,
                                                      and reproductive disorders, and increased risk of severe morbidity and mortality from common
                                                      childhood infections such as diarrheal diseases and measles (Sommer et al. 1983).

                                                      Conventional intervention strategies, like industrial fortification of foodstuffs and supplementation
                                                      with vitamin capsules, have achieved notable improvement in a number of countries, yet overall
                                                      coverage generally reaches only 55 percent of children under the age of five, while older children and
                                                      lactating women are not targeted at all (UNICEF 2003). While urban dwellers have access to fortified
                                                      foodstuffs, e.g., provitamin A-enriched oil or butter, the rural poor depend on supplementation
                                                      programs. These interventions are limited by cumbersome logistics and costs that for a country as
                                                      small as Nepal or Ghana amount to about $2 million annually (MOST, USAID 2004). Children receive
                                                      two annual megadoses of vitamin A at best, and their vitamin blood levels will be depleted before
                                                      receiving the next dose.

                                                      Biofortified crop plants that produce or accumulate the desired nutrients can deliver micronutrients
                                                      in a sustainable way. Biofortification can be achieved by conventional breeding, unless the desired
                                                      trait is not available in existing, sexually compatible germplasm, as is the case in rice. This is where
                                                      genetic engineering comes into play. Once a desirable trait has been introduced into a variety,
                                                      it can be easily transferred to any locally adapted variety by conventional breeding, as is being
                                                      done at present with Golden Rice. Even though the feasibility of provitamin-A-biofortified rice was
                                                      demonstrated in 1999 (Ye et al. 2000), delivery of this technology to the target population will
                                                      not be achieved before 2012, to a great extent because of regulatory hurdles (Al-Babili and Beyer
                                                      2005).1 The Golden Rice Humanitarian Board is working with national and international institutions
                                                      towards deployment of this technology to smallholders in affected regions.

                                                      Technology Timeline

                                                      1992 Golden Rice project initiated by Ingo Potrykus (Swiss Federal Institute of Technology Zurich)
                                                           and Peter Beyer (Univ of Freiburg) with support from the Rockefeller Foundation [(Gura
                                                           1999)] (Potrykus 2001).

                                                      1999 Breakthrough proof-of-concept Golden Rice at 1.6 μg/g beta-carotene. Two genes, one
                                                           from daffodil and one from the soil bacterium Erwinia uredovora, were introduced into the
S C I E N C E, T E C H N O LO G Y A N D S K I L L S

                                                           japonica variety TP309.

                                                      2000 Publication in Science by Ye et al. and extensive publicity (for example, July 31 cover story of
                                                           Time magazine). Also, beginning of campaigns by opponents of the technology.

                                                      2001 Humanitarian License Agreement with Syngenta.2

                                                              Establishment of Golden Rice Network; most partners in SE Asia.

                                                        1 See, for example, Kalaitzandonakes et al. (2007) and Manlo and Ramon (2007).
                                                        2 For details see www.goldenrice.org.
                                                                                                                                                 continued   u
22
You can also read