SDG 6.3.1
Safely treated domestic wastewater

        21 September, 2021
←
→
Page content transcription
If your browser does not render page correctly, please read the page content below
SDG 6.3.1
Safely treated domestic wastewater
21 September, 2021
Methodology

                           Disaggregate wastewater   Determine proportion of       Calculate total
Estimate total household
                                generated into           wastewater safely     proportion and volume
 wastewater generated
                             wastewater streams       treated in each stream       safely treated

                                                                                                       2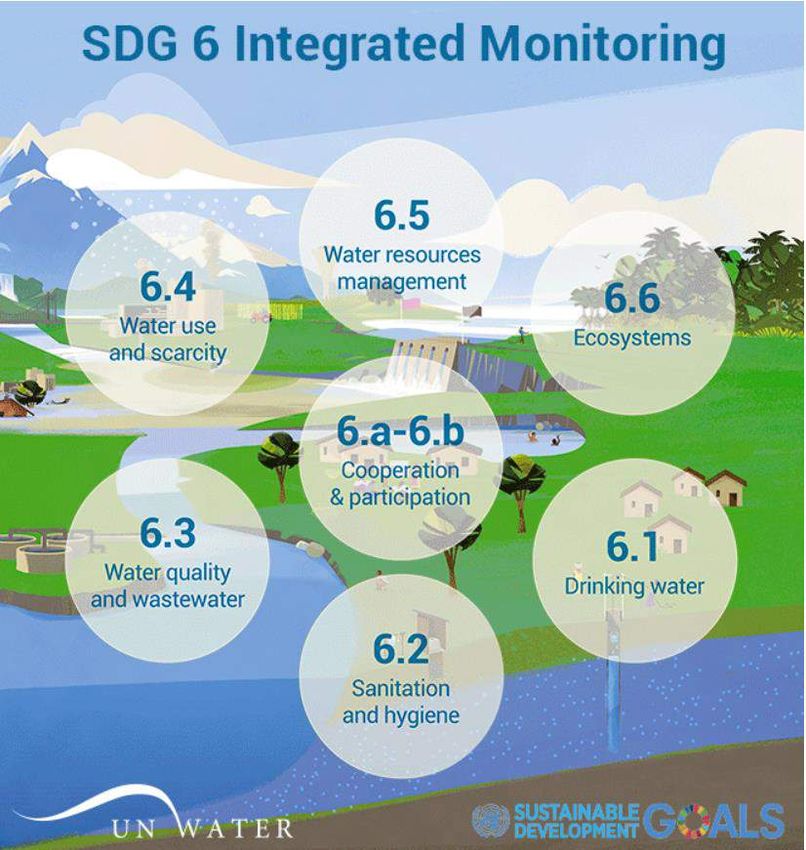
Methodology

                            Disaggregate wastewater         Determine proportion of       Calculate total
Estimate total household
                                 generated into                 wastewater safely     proportion and volume
 wastewater generated
                              wastewater streams             treated in each stream       safely treated

               Either:
               1. Directly reported by official national statistics; or
               2. Estimated internally based on:
                          - total population
                          - domestic water use (litres / capita / day)
                          - ratio of water use to wastewater produced

                                                                                                              3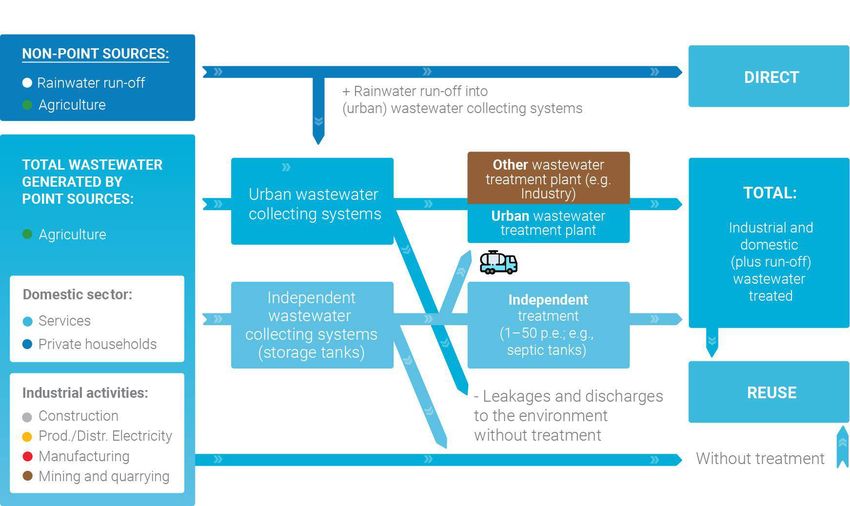
Methodology

                            Disaggregate wastewater        Determine proportion of         Calculate total
Estimate total household
                                 generated into                wastewater safely       proportion and volume
 wastewater generated
                              wastewater streams            treated in each stream         safely treated

               Volumes generated by households with:
               - Connections to sewers (Stream 1)
               - Connections to septic tanks (Stream 2)
               - Connections to all other types of sanitation (Stream 3)

               Based on data on the breakdown of household sanitation services by the Joint
               Monitoring Programme for Water, Sanitation, and Hygiene (JMP)

                                                                                                               4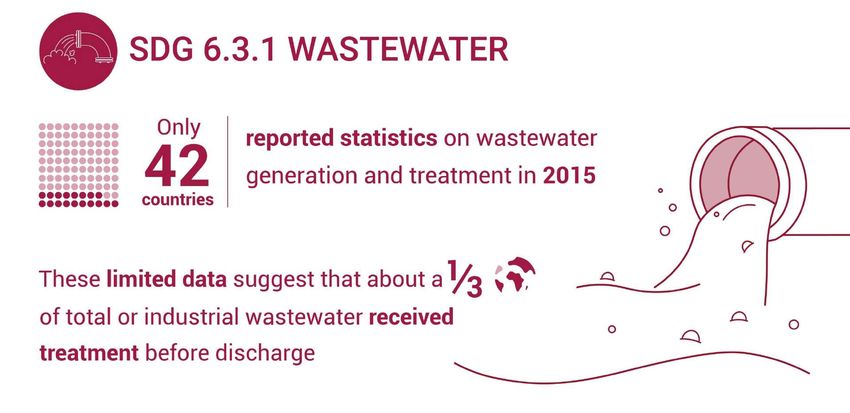
Methodology

                           Disaggregate wastewater      Determine proportion of           Calculate total
Estimate total household
                                generated into              wastewater safely         proportion and volume
 wastewater generated
                             wastewater streams          treated in each stream           safely treated

               Based on proportions:
               - Contained within storage/conveyance facilities (i.e. septic tanks)
               - Collected at wastewater treatment systems (WWTPs or septic tanks)
               - Safely treated at wastewater treatment systems

               Wastewater volumes produced by households without sewer or septic tank
               connections were classified as not safely treated

                                                                                                              5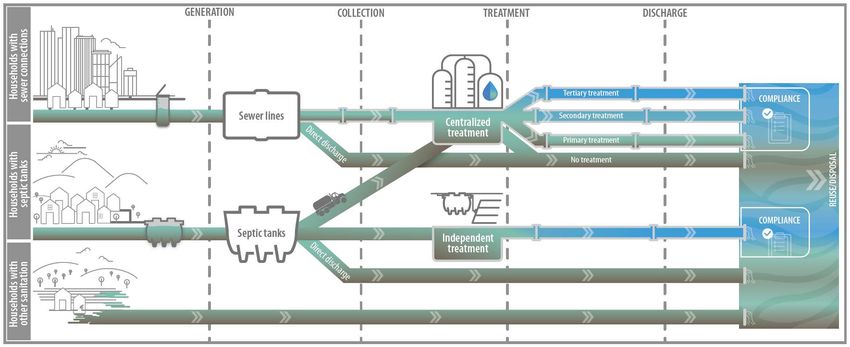
Example – Household Wastewater
    Management Chain: Global estimates
1

2

3

                                         6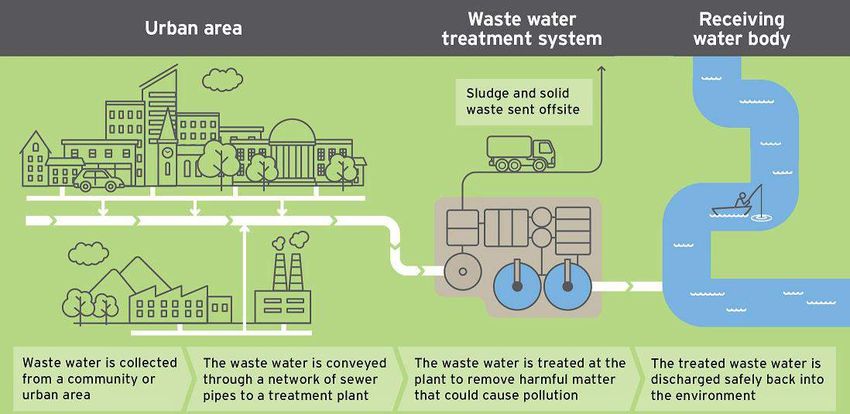
Methodology

                             Disaggregate wastewater         Determine proportion of         Calculate total
Estimate total household
                                  generated into                 wastewater safely       proportion and volume
 wastewater generated
                               wastewater streams             treated in each stream         safely treated

               Calculations for each wastewater stream:
               [Volume Safely Treated ] = [ Volume Generated ] x [ Proportion Safely Treated ]

               ∑ Volume Safely Treated (Sewers + Septic Tanks)

               [ Total proportion safely treated ] = [ Total volume safely treated ] /
                                                         [ Total volume generated ]

                                                                                                                 7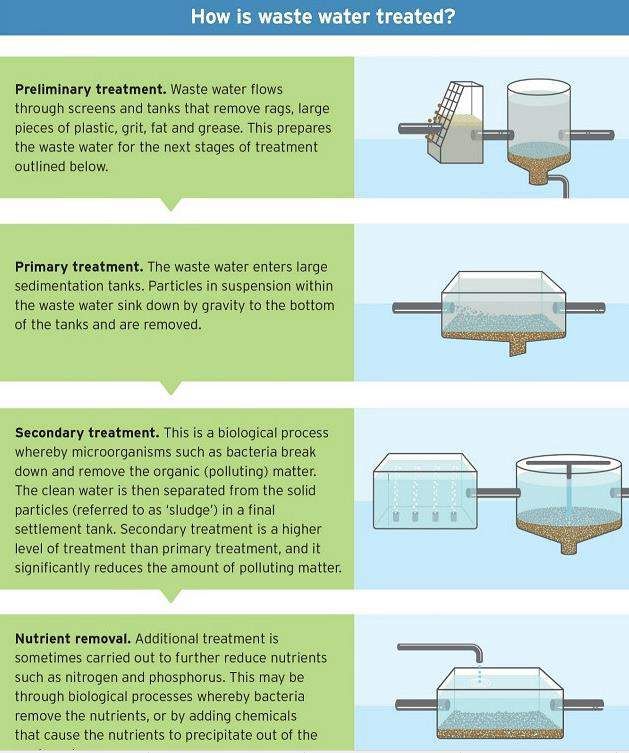
Results – Household wastewater generation

                               Estimates derived for
                               all 234 SDG countries
                                   and territories

                                                       8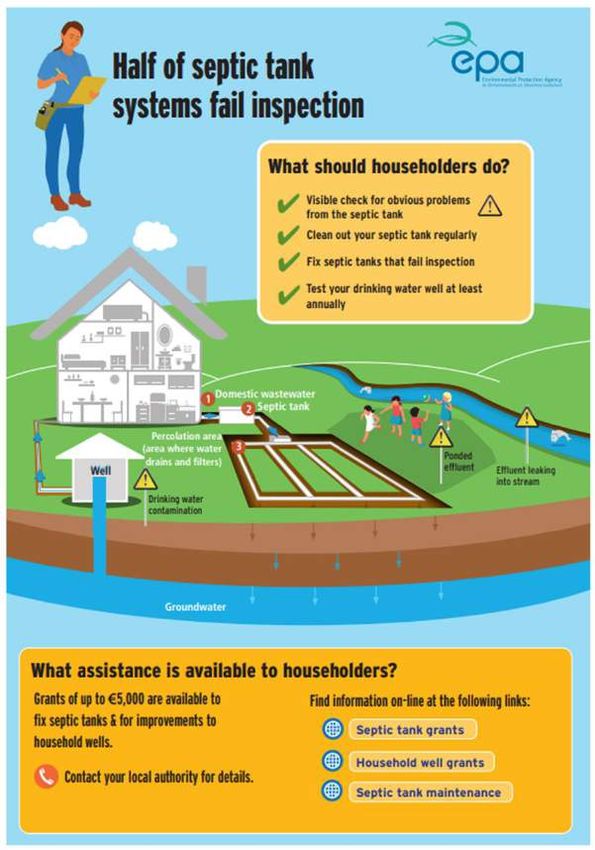
Results – Household wastewater treatment
                            Estimates derived for:

                            • 128 of 234 SDG countries
                              and territories (55%)
                            • 80% of households
                              wastewater flows
                            • 84% of the global
                              population

                                                         9
Results – Household wastewater treatment
                                        Not collected

Sewer                                   Collected and not
                                        safely treated

                                        Collected and safely
Septic                                  treated off-site

 tank                                   Collected and safely
                                        treated on-site

                                                            10
See SDG6 website for additional resources
– 6.3.1 indicator report – 234 country files
– Methodological Note • Country-specific data
• Further explanation of • Assumptions used in place of
calculations, terminology, missing data
definitions, rules and exceptions • Raw calculations
• Data summaries and breakdowns
11Thank you!
12A better quality of life for all in an urbanizing world
Progress on Wastewater Treatment
2021 Update

SDG 6 Indicator Report 6.3.1
TOTAL and INDUSTRIAL wastewater flows

Presentation by: Florian Thevenon
Date: 21 September 2021
SDG Target 6.3: Indicators 6.3.1 and 6.3.2
“By 2030, improve water quality by
reducing pollution, eliminating
dumping and minimizing the release
of hazardous chemicals and materials,
halving the proportion of untreated
wastewater and substantially
increasing recycling and safe reuse
globally”.
   • Indicator 6.3.1 “Proportion of
     wastewater safely treated”
   • Indicator 6.3.2 “Proportion of
     bodies of water with good
     ambient water quality”
Methodology to monitor indicator 6.3.1
Disaggregation of generated (ISIC) and treated flows

  INDUSTRIAL

  DOMESTIC
Total wastewater flow generated in 2015 (132 Bcm)
Total wastewater flow treated in 2015 (42 Bcm)

                                    other
Proportion of total wastewater flow treated: 32%
Proportion of industrial flow treated: 30%
Insufficient data for regional and global estimates
Non-reported water consumption (Switzerland)
Importance of non-municipal sources (Mexico)
Loads of BOD by economic activities (Costa Rica)
Thank you

www.unhabitat.org
Waste Water Treatment in Ireland

                   Eimear O’Keeffe
                   Environmental Protection Agency
                   September 2021
Waste water treatment in Ireland
Two thirds of the population
is served by piped sewers
(urban waste water
treatment plants)
One third of the population is
served by on-site sanitation
systems (domestic waste water
treatment systems)Urban Waste Water Treatment
1% of urban waste water is conveyed
to plants that provide basic treatment
Almost 64% of urban waste water is
treated at plants designed to provide
secondary treatment
Nearly 34% of urban waste water is
treated at plants designed to provide
secondary treatment with nutrient
removalRegulation of urban waste water Urban Waste Water Treatment Directive S.I. No. 254/2001 – Urban Waste Water Treatment Regulations, 2001 S.I. No. 684/2007 – Waste Water Discharge (Authorisation) Regulations, 2007
Urban waste water enforcement Priority areas e.g. areas discharging raw sewage National Site Inspection Plan National Projects Annual Urban Waste Water Treatment Report Compliance Investigations
Domestic Waste Water Treatment
DWWTS - regulatory system

                                                                                                                 Planning control
                                                             Planning
                                                              control                                            & standards
                                                            Local Authority           Building
Registration                     Complaints                An Board Pleanala        regulations
                                 Local Authority                                    Local Authority
& grants
                                                                                                               Code of
                                                                                                               Practice
         Registration
                                                                                                              Environmental
         Local Government

                                                   Regulation of
                                                                                                            Protection Agency
           Management
              Agency

                                                   septic tanks                                                  S.R 66 and
                                                                                                                 EN 12566
                 Grants
                schemes                                                                                        National Standards
                                                                                                               Authority of Ireland
               Local Authority
                                                                                           National
                                       High Status                                        Inspection
                                                                    Priority                 Plan
                                        Objective                  Areas for
                                       Catchments                                        Local Authority
                                                                    Action                Environmental
                                         Local authority
                                                                    LAWPRO              Protection Agency
                                                                  Local authority

                                                              Inspections
DWWTS Inspections - national inspection plan
2013
2015-2017
2018-2021
1,000 inspections/annum min.
Additional inspections - where
evidence exists that DWWTS are
causing an issue in a particular
catchment.DWWTS Inspections - national inspection plan
DWWTS Inspections – inspection process
Inspectors
Training course for WSA staff.
100 approx. Inspectors nationally
What to expect
No rainwater or clean surface water entering
No leaks
No ponding
No unauthorised discharges
Components in working order
Proper maintenance and operation
De-sludging
Not a risk to human health or the
environmentDWWTS Inspection - remediation
Advisory notice
Measures
Timeframes
Remediation
Planning exemption - Planning and Development (Amendment) Regulations
2013 (S.I. No. 219/2013)
Variances to the CoP requirements may be considered by the local authority
Grants
High Status Objective Areas
National Inspection Plan
Priority Areas for ActionInspections - 2020 findings Domestic Waste Water Treatment Systems Inspections 2020 report 2020: 809 inspections; 54% failed 2013-2020: 76% of systems that failed have been fixed (2,972) 34 legal actions
MONITOREO E INFORMES
                         EN AGUAS RESIDUALES, COSTA RICA
                                           INDICADOR ODS 6.3.1:
                         “Proporción de aguas residuales tratadas de manera segura”.

                                          INDICADOR ODS 6.3.1. CR:
                       “Proporción de aguas residuales por origen y tipo de tratamiento”.

Lic. Ana Victoria Giusti Méndez, USA-DPRSA

21 setiembre 2021
RESPALDO LEGAL-AGUAS RESIDUALES
LEY GENERAL DE • CAPITULO III “De las obligaciones y restricciones para la
SALUD (N°5395, evacuación sanitaria de excretas y aguas servidas y
1973) negras”.
• Artículo 128.-Prohíbese arrojar aguas servidas, aguas negras, desechos o cualquier
sustancia contaminante en manantiales, ríos, quebradas, arroyos permanentes o no
permanentes, lagos, marismas y embalses naturales o artificiales, esteros, turberas,
pantanos, humedales, aguas dulces, salobres o saladas, en sus cauces o en sus respectivas
LEY DE CONSERVACION áreas de protección.
DE VIDA SILVESTRE • Las instalaciones agroindustriales e industriales, así como las demás instalaciones,
(N°7317, 1992) deberán estar provistas de sistemas de tratamiento para impedir que los desechos sólidos
o las aguas contaminadas de cualquier tipo destruyan la vida silvestre. La certificación de
la calidad del agua será dada por el Ministerio de Salud.RESPALDO LEGAL-AGUAS RESIDUALES
• OBJETIVO: Establecer los límites máximos permisibles de parámetros físicos, químicos y microbiológicos
para la disposición de las aguas residuales y establecer las pautas para su control y cumplimiento.
• OBLIGATORIEDAD DE REPORTES OPERACIONALES: Todo ente generador de aguas residuales están en
la obligación de confeccionar REPORTES OPERACIONALES periódicamente (TRIMESTRAL /SEMESTRAL),
cuando el efluente es vertido a un CUERPO RECEPTOR, ALCANTARILLADO SANITARIO o REUSADO. Se
DE.33601-S- presentan al MINISTERIO DE SALUD.
MINAE
• Los ROAR se generan en la PLATAFORMA del “Sistema Informático para el Registro de Reportes
Reglamento Operacionales de Aguas Residuales”.
vertido y reuso
• PARAMETROS ESTABLECIDOS: UNIVERSALES (Caudal, T°C, pH, DBO, DQO, SST, SSED, GyA, SAAM),
de aguas COMPLEMENTARIOS (nitrógeno, fosfatos, fenoles, hidrocarburos, metales, plaguicidas, ……..),
residuales (2007) MICROBIOLOGICOS (nematodos, c.fecales).
• CERTICACION DE LA CALIDAD DEL AGUA RESIDUAL: De oficio y anualmente
• Art.10. ESTADISTICAS DE CUMPLIMIENTO DE PARAMETROS-LIMITES.
• Comité Técnico de Vertido y Reuso de Aguas ResidualesPARÁMETROS DE ANÁLISIS OBLIGATORIO CON SUS RANGOS O LÍMITES MÁXIMOS PERMISIBLES
DE.33601-S-MINAE
CUERPO REÚSO ALCANTARILLADO
PARAMETRO RECEPTOR SANITARIO
Rango o Límite Rango o Límite Rango o Límite
UNIDAD
Máximo Máximo Máximo
Caudal (1) ----- ----- ----- m3/día
Potencial hidrógeno (pH) 5a9 5a9 6a9 ----
Demanda Bioquímica de Oxígeno (DBO5,20) 50 50 300 mg/L
Sólidos Suspendidos Totales (SST) 50 50 300 mg/L
Grasas y Aceites (GyA) 30 30 50 mg/L
Nitrógeno Total 50 50 50 mg/L
Hidrocarburos 10 10 20 mg/L
Mercurio 0,01 0,01 0,01 mg/L
Organoclorados 0,05 0,05 0,05 mg/L
Coliformes Fecales 1000 1000 --- NMP/100mlSIRROAR
ATENCION CLIENTE-ARS
*TECNICO RESPONSABLE RO. 1 1.Verificacion-SIRROAR
*Inscrito en el MS. ASIGNACION DEL 2. Valida completitud
*Genera el RO CODIGO ENTE 3. Y Otorga N°. Trámite.
GENERADOR. 4. VISTO
Usuario y Contraseña
(USA-DPRSA)
REGULACION-ARS
1.Revisión y Evaluación RO.
2. Devolución RO. SI Procede
*R. OPERACIONAL
*ANALISIS LAB. CCAR.RESPALDO LEGAL
✓Sistema mediante el cual se generan los ROAR y la CCAR (DE.33601).
Sistema
✓Almacena datos y producción en Excel.
Informático para
el Registro de ✓Estadísticas de conformidad con el artículo 10° del DE.33601 (Parámeros-Límites-CIIU).
Reportes
Operacionales en ✓Reporte anual a los Entes Operadores de Alcantarillado Sanitario (AyA, ESPH, Municipalidades).
Aguas Residuales
✓Reportes a diferentes Instituciones gubernamentales (Municipalidades, Universidades,….).
(SIRROAR), 2016
✓Estadísticas anuales del agua residual tratada en CR, para el CTIE-AGUA, OCDE, FAO, DNU-PNUMA,
ODS.6.3,1, Cuentas Ambientales-BCCR, etc.EXCEL-SIRROAR-ANUAL
Coliformes
CODIGO TIPO Hidrocarburo
NOMBRE CIIU TIPO CAUDAL DB0 SST GyA DQO Arsenico ORGANOFOSFORA Fecales
ENTE PROVINCIA AGUA 3 s
ENTE GENERADOR DISPOSICION (m /día) (mg/L) (mg/L) (mg/L) (mg/L) (mg/L) DOS (NMP/100
GENERADOR RESIDUAL (mg/L)
(mg/L) ml)
CONGELADOS DEL PUNTARENA
RBR_DARSBAS_10 MONTE S.A. 1030 S ESPECIAL CUERPO RECEPTOR 6,40 21,00 9,00 3,00 51,00 - - 0,10 -
CONSERVAS DEL VALLE
RCE_DARSCTG_33 S.A. 1030 CARTAGO ORDINARIA CUERPO RECEPTOR 38,70 39,00 91,00 13,00 174,00 - - 0,00 -
FINCA EL PELON DE LA GUANACAST
RCH_DARSBGC_10 BAJURA. 163 E ORDINARIA REUSO - 11,00 69,00 11,40 13,00 - - 1,20 6,02
CONDOMINIO
RCN_DARSAJ1_13 HORIZONTAL VILLA
8 FLORES 3700 ALAJUELA ORDINARIA CUERPO RECEPTOR 12,50 9,00 44,00 3,00 43,00 - - - -
CASA DOMINGA
RCS_DARSCMU_5 RESTAURANTE Y ALCANTARILLADO
40 CAFETERIA 5610 SAN JOSE ORDINARIA SANITARIO 1,10 50,00 0,28 6,00 110,00 - - - -
RHA_DARSPCC_25 UNO PETROL LA RITA 4730 LIMON ESPECIAL CUERPO RECEPTOR 0,60 16,00 66,00 117,80 28,00 5,80 - - -
SERVICENTRO LA
RHN_DARSFRC_32 LUCHA. 4730 ALAJUELA ORDINARIA REUSO 1,00 21,00 30,00 4,00 46,00 4,00 - - -
CONDOMINIO
RESIDENCIAL VERTICAL PUNTARENA
RPC_DARSGAR_32 CASA CASCADA 3700 S ORDINARIA CUERPO RECEPTOR 6,00 8,00 16,00 3,00 27,00 - - - 0,00ESTADISTICAS-DE.33601-S-MINAE (art.10°)
EJEMPLO S.SED DQO ARSENICO
SST GyA SAAM HIDROCARB C.FECALES
RELLENOS SANITARIOS DBO (mg/L) (mg/L) (mg/L)
CIIU 3820 T°C pH (mg/L) (mg/L) (mg/L) (mg/L) (NMP/100
AR-CUERPO RECEPTOR (mg/L)
ml)
LIMITE NORMATIVO 15-40 5a9 300,00 200,00 1,00 30,00 5,00 1000,00 10 0,1 1000
Promedio 26,59 7,37 49,50 57,34 0,33 8,40 0,53 469,86 0,02 0,00 0,42
Desviación 6,20 1,77 45,43 60,23 0,93 6,14 0,52 329,27 0,02 0,00 2,58
Datos superior al límite 0,00 2,00 1,00 0,00 0,00 4,00
Cuenta 116,00 116,00 116,00 116,00 116,00 116,00 116,00 115,00 71,00 3,00 75,00
% Incumplimiento 0% 2% 1% 0% 0% 3%
20,0 5,0 2,0 0,0 0,0 0,0 0,0 32,0 0,0 0,0 0,0
Valor.Min
26,0 7,0 10,1 18,6 0,1 5,0 0,3 197,5 0,0 0,0 0,0
Q1 (25%)
27,0 7,5 38,5 47,0 0,1 5,0 0,5 397,0 0,0 0,0 0,0
Q2 (50%)
28,0 7,9 73,5 75,3 0,5 14,0 0,5 694,0 0,0 0,0 0,1
Q3 (75%)
32,0 9,0 225,0 460,0 10,0 24,7 5,0 1425,0 0,2 0,0 28,6
Valor. MaxESTADISTICAS-CTIE-AGUAS / RIEA
DIVISION ACTIVIDADES 2019
CIIU.4
Volumen
Volumen Volumen EMIS.TOTAL EMIS.TOTAL EMIS.TOTAL EMIS.TOTAL EMIS.TOTAL EMIS.TOTAL
(1000
(m3 /día) (m3/año) DB0 SST S.SED GyA SAAM DQO
m3/día)
(kg/año) (Kg/año) (L/año) (Kg/año) (Kg/año) (Kg/año)
AGRICULTURA, GANADERÍA, CAZA Y
01 ACTIVIDADES DE SERVICIOS CONEXAS 3066,53 932225,63 3,07 197535,08 119897,09 250191,56 16169,12 664,98 439017,16
ELABORACIÓN DE PRODUCTOS
10 ALIMENTICIOS 53809,77 16358168,80 53,81 872578,45 574582,91 8759167,53 122540,07 5510,59 2205791,82
FABRICACIÓN DE PRODUCTOS
13 TEXTILES 111,30 33835,20 0,11 1524,16 2133,26 21580,96 275,24 15,35 3951,03
FABRICACIÓN DE SUSTANCIAS Y
20 PRODUCTOS QUÍMICOS 246,48 74928,81 0,25 1974,73 1778,24 29145,53 311,49 56,02 6136,20
FABRICACIÓN DE PRODUCTOS
21 FARMACÉUTICOS, … 70,70 21492,80 0,07 161,39 221,22 1603,30 30,51 1,16 454,53
EVACUACIÓN DE AGUAS RESIDUALES
37 Y LODOS 86135,84 26185295,85 86,14 1704523,86 1379755,10 12771494,76 127023,51 114605,68 4268570,21
55 ACTIVIDADES DE ALOJAMIENTO 3068,79 1092490,78 3,07 44589,62 30303,04 515783,44 9540,41 1332,20 91970,70
ACTIVIDADES DE SERVICIO DE
56 COMIDAS Y BEBIDAS 269,59 95974,04 0,27 3183,64 2113,21 6847,07 756,69 77,84 7747,81
ACTIVIDADES DE ATENCIÓN DE LA
86 SALUD HUMANA 2495,53 758642,13 2,50 15554,69 15638,09 217319,53 4473,53 177,36 49227,79FORMULARIO ODS.6.3.1
Objetivo Objetivo 6. Garantizar la disponibilidad y la gestión sostenible del agua y el saneamiento para todos
Meta 6.3 De aquí a 2030, mejorar la calidad del agua reduciendo la contaminación, eliminando el vertimiento y minimizando la emisión de productos químicos y materiales
peligrosos, reduciendo a la mitad el porcentaje de aguas residuales sin tratar y aumentando considerablemente el reciclado y la reutilización sin riesgos a nivel mundial
Nombre del 6.3.1 Proporción de los flujos de aguas residuales domésticas e industriales tratados de manera adecuada
indicador o de la
variable
Indicador Proporción de aguas residuales por origen y tipo de tratamiento
propuesto para
Costa Rica
Proporción de aguas residuales por origen y tipo de tratamiento
Origen / Tratamiento
Aguas de origen Aguas de origen Aguas de origen Total de Aguas
Aguas de origen Subtotal tratado Sin tratamiento
doméstico tratadas agrícola tratadas en industrial tratadas en residuales generadas
Años domestico tratadas en en solución individual plantas de plantas de
plantas de tratamiento
(tanque séptico) tratamiento tratamiento
hm3 / hm3 / hm3 / hm3 / hm3 /
hm3 / año Porcentaje año Porcentaje año Porcentaje año Porcentaje año Porcentaje año Porcentaje hm3 / año Porcentaje
2015 24,30 4,80 227,00 44,80 88,80 17,50 111,00 21,90 451,10 89,00 55,90 11,00 507,00 100,00
2016 22,26 4,52 181,83 36,88 1,60 0,32 25,90 5,25 231,59 46,98 261,41 53,02 493,00 100,00
2017 28,26 5,72 176,20 35,67 1,09 0,22 25,72 5,21 231,27 46,82 262,73 53,18 494,00 100,00
2018 35,25 6,86 176,30 34,30 1,32 0,26 74,85 14,56 287,72 55,98 226,28 44,02 514,00 100,00
Fuente Ministerio de Salud, Sistema Informático y Registro de Reportes Operacionales de Aguas Residuales (SIRROAR), con datos del Instituto Nacional de Estadística y
Censos; Encuesta Nacional de Hogares, Empresa de Servicios Públicos de Heredia y Instituto Costarricense de Acueductos y Alcantarillados, Registros Comerciales de los entes
Públicos Administradores.• EJE 2. GESTION INTEGRADA PARA EL SANEAMIENTO DE LAS AGUAS RESIDUALES
• OBJETIVO: Fortalecer la gestión de saneamiento de aguas residuales ordinarias y especiales a través del
POLITICA NACIONAL aprovechamiento de los instrumentos actuales y la creación de nuevos en caso de ser requeridos.
DE SANEAMIEMTO EN
AGUAS RESIDUALES • SUBTEMA: Instrumentos tecnológicos para el manejo seguro de las aguas residuales.
(2016-2045)
• ACCION ESTRATEGICA: Elaboración e implementación de un sistema de información nacional única y
sostenible, que contenga el registro de vertidos y reúsos de aguas residuales, con la información de la
ubicación geográfica y la calidad de los efluentes.
• INDICADOR: Sistema de información único sectorial operando en línea con el 100% del total de la
información de vertidos y reúsos de aguas residuales.
• INDICADOR ODS 6.3.1: “Proporción de aguas residuales tratadas de
INDICADOR manera segura”.
ODS 6.3.1
• INDICADOR ODS 6.3.1. CR: “Proporción de aguas residuales por origen y
tipo de tratamiento”.RETOS Y DESAFIOS - INDICADOR ODS 6.3.1 ➢ Ampliar la captura de información de entes generadores de aguas residuales a nivel nacional. ➢ Mejora continua del SIRROAR (ajustes, programación, automatización de estadísticas). ➢ Incorporar el SIRROAR al Sistema para el Registro de Emisiones de Transferencia de Contaminantes (RETC), a mediano y largo plazo. ➢ Contar con un sistema de información único sectorial operando en línea con el 100% del total de la información de vertidos y reúsos de aguas residuales. (PNSAR 2016-2045).
!!! MUCHAS GRACIAS !!!
You can also read