Sea surface temperature and chlorophyll-a distribution from Himawari satellite and its relation to yellowfin tuna in the Indian Ocean
←
→
Page content transcription
If your browser does not render page correctly, please read the page content below
Sea surface temperature and chlorophyll-a
distribution from Himawari satellite and its
relation to yellowfin tuna in the Indian Ocean
1,2
  Abu B. Sambah, 1Asmiatul Muamanah, 1,2Ledhyane I. Harlyan,
1
 Tri D. Lelono, 1,2Feni Iranawati, 1,2Aida Sartimbul
 1
  Faculty of Fisheries and Marine Science, Universitas Brawijaya, Veteran street Malang,
 East Java 65145, Indonesia; 2 Marine Resources Exploration and Management Research
  Group, Faculty of Fisheries and Marine Science, Universitas Brawijaya, Veteran street
       Malang, East Java 65145, Indonesia. Corresponding author: A. B. Sambah,
                                   absambah@ub.ac.id

       Abstract. The southern Indian Ocean of Java has a variety of fish resources. Many types of fish migrate
       on a regular basis, on time scales ranging from daily to annually or longer, and over distances ranging
       from a few miles to thousands of miles. The analysis of oceanographic parameters using satellite
       observation helps in the study of fish migration for fishing ground observation. This research aimed to
       determine the dynamics of oceanographic factors in the Indian Ocean, to describe the variability of
       oceanographic parameters in the fishing ground of yellowfin tuna (Thunnus albacares), and to analyse
       the relationship between oceanographic parameters and yellowfin tuna. The study also attempted to map
       potential yellowfin tuna fishing grounds in the Indian Ocean. The quantitative descriptive methods
       applied included spatial analysis, correlation analysis, and biplot analysis. Oceanographic parameters
       such as sea surface temperature (SST) and sea surface chlorophyll-a (SSC) have an impact on the
       volume of fish caught. During the period 2015-2019, the highest average SST was 29.25°C and the
       lowest was 25.72°C, whereas the highest SSC was 0.26 mg m-3 and the lowest was 0.10 mg m-3. The
       coefficient of correlation was -0.610 between SST and SSC, -0.461 between SST and yellowfin tuna catch
       and 0.321 between SSC and yellowfin tuna catch. The negative correlation between SST and SSC and
       between SST and catch indicate that chlorophyll-a and tuna catch decline with increasing temperatures,
       while the positive correlation between SSC and catch indicates that yellowfin tuna are more likely to be
       caught in areas with higher SSC.
       Key Words: oceanographic parameters, Himawari satellite, yellowfin tuna, Indian Ocean.

Introduction. The movement pattern of water masses affects the fluctuation of
oceanographic variables such as sea surface temperature (SST) and sea surface
chlorophyll-a (SSC). SST and SSC are two important oceanographic parameters that
affect fish habitat. SST can be used as an indicator for estimating the location of
upwellings, downwellings, and fronts associated with potential fishing grounds.
Meanwhile, chlorophyll-a is an indicator of the level of the fertility and productivity of
marine waters (Yoga et al 2014).
         The migration of pelagic fish in marine waters is influenced by oceanographic
parameters such as SST, salinity, surface currents, dissolved oxygen, and other
ooceanographic factors (Cahya et al 2016). Therefore, oceanographic parameters such as
SST and SSC are among the factors that can greatly influence the variability of fish
catches. Upwellings bring nutrients to the surface and provide rich feeding grounds for
fish. The SST-induced wind stress curl reinforces seaward upwelling through Ekman
suction or pumping (Kok et al 2017), a critical effect of the air-sea interaction on both
circulation and eddies in coastal waters (Jin et al 2009). Given the sizes of these SST-
induced perturbations of the surface wind stress field and the magnitude of the related
Ekman upwelling impacts on the sea, it can be considered that this air-sea interaction is a
critical component of regional climate systems (Jin et al 2009). For example, Wass et al
(2012) reported coastal upwellings in the northern coastal waters of Papua in reaction to

AACL Bioflux, 2021, Volume 14, Issue 2.
http://www.bioflux.com.ro/aacl
                                                     897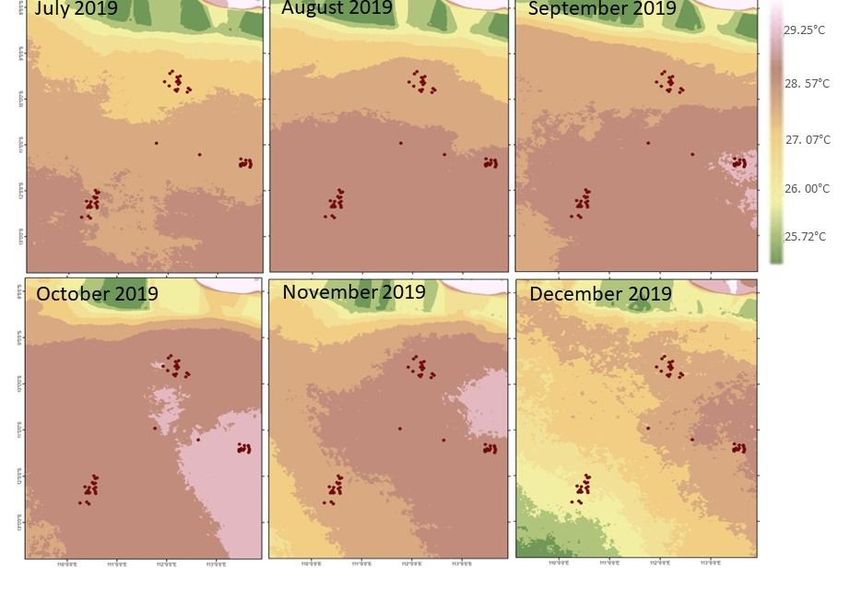
westerly winds and westerly wind bursts (WWBs) during December to March,
characterised by low SST, with intensified Ekman transport and maximum Ekman layer
depth. The reported SST range for yellowfin tuna is 18-31ºC (Cucalón-Zenck 2017).
        Chlorophyll-a is an indicator of primary productivity. If the waters are fertile, there
will be a lot of phytoplankton which are the primary producers at the base of the food
chain and are the main food source for some small fishes, as well as zooplankton which is
also food for small fishes. The food chain within the pelagic zone of the seas is generally
longer than in terrestrial ecosystems (Sommer et al 2018). Understanding of the
complexity of the pelagic food web has advanced from perceptions of a direct food chain
(phytoplankton - zooplankton crustaceans - planktivorous fish - carnivores) to an
expanded food web including microbial trophic pathways, complex webs within the
zooplankton, including gelatinous organisms, and a high prevalence of omnivory
(Andersson et al 2017). Yellowfin tuna are large pelagic fish that feed on small fishes,
crustacea, squid, and molluscs. The reported SSC range for yellowfin tuna is between
0.38 and 0.52 mg m-3 (Lan et al 2012).
        The yellowfin tuna (Thunnus albacares) is a large pelagic fish with potential as an
export commodity and contributes substantially to Indonesian fisheries production.
Yellowfin tuna can be found in oceans all around the world. In Indonesia yellowfin tuna
are found in the eastern Indian Ocean which includes the western waters of Sumatra,
southern waters of Java, and southern waters of Bali; they are also found in the Banda,
Molucca, Halmahera, Arafura, and Sulawesi Seas (Jatmiko et al 2016). The southern
coast of East Java is one of the main tuna landing centres. The dominant tuna species
captured in the waters off southern East Java in the Indian Ocean is yellowfin tuna,
comprising 45.2% of the tuna catch from 2011 to 2015 (Arnenda et al 2019).
        The application of satellite remote sensing in observing fisheries resources is
currently becoming popular due to the fairly representative temporal and spatial
resolution of available data. Some research has used satellite images for observing
marine environmental and oceanographic parameters in order to analyse fish stock
dynamics. Moreover, the geographical information system (GIS) approach can also help
in visualizing and analysing multi-layer raster data related to such research themes
(Zainuddin 2007; Nurdin et al 2014; Suhartono et al 2015; Setiawati et al 2015;
Mustapha et al 2020; Nurholis et al 2020). This research aimed to determine the
dynamics of specific oceanographic factors in the Indian Ocean, to describe the variability
of these oceanographic parameters in yellowfin tuna fishing grounds, and to analyse the
relationship between these oceanographic parameters and the yellowfin tuna catch. The
results of the study can be used as basic information for the mapping of potential
yellowfin tuna fishing grounds.

Material and Method

Research location. This research was located in the Indian Ocean off East Java (Figure
1). The research area is included in the Fishery Management Area of The Republic
of Indonesia No. 573 (FMA 573). This area is a potential fishing ground for tuna species.

Datasets. The oceanographic data on SST and SSC were obtained from Himawari 8
satellite images for the years 2015 to 2019. Himawari 8 is a Japanese weather satellite,
the 8th in a series of geostationary weather satellites operated by the Japan
Meteorological Agency (JMA). The JMA began the operation of the Himawari-8 satellite in
July 2015 with backup-operation by the Himawari-9 satellite in March 2017, with both
units scheduled to continue observations until around 2029. The SST and SSC data from
Himawari 8 level 3 were downloaded from http://www.eorc.jaxa.jp/ptree/registration_
top.html.
        The primary instrument aboard Himawari 8, the Advanced Himawari Imager
(AHI), is a 16 channel multispectral imager ranging from 0.47 to 13.3 μm and performs
disk observations every 10 minutes (Japan Meteorological Agency 2014). The Advanced
Himawari Imager (AHI) has several infrared channels, which are useful in masking

AACL Bioflux, 2021, Volume 14, Issue 2.
http://www.bioflux.com.ro/aacl
                                             898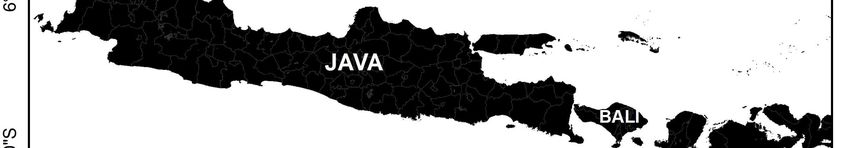
features that affect aerosol uptake. In addition, multiple visible bands and NIR provide a
major advantage in extracting aerosol properties.
Spatial data on fishing yellowfin tuna fishing activities were collected from fishing
trip logbooks of handline fisherman landing tuna at Sendangbiru fishing port in Malang,
East Java, Indonesia. The information consisted of the geographical coordinates of
yellowfin tuna catches and the oceanographic conditions around the handline fishing
grounds. Data collection and analysis was carried out from December 2019 to June 2020.
Figure 1. Map of the research area (Indian Ocean off the southern coast of East Java).
Sea surface temperature analysis. The AHI is an optical radiometer on board the
Himawari-8. Its observation frequencies are every 10 min for the full disk and every 2.5
min for the area adjacent to Japan. The AHI has 16 spectral bands from visible to
infrared wavelengths. The spatial resolution of the infrared (IR) bands is 2 km (Bessho et
al 2016). The IR bands centred at 3.9, 8.6, 10.4, 11.2, and 12.4 μm are usable for SST
retrieval. The calculation of temperature applied the vertical temperature difference (T)
using the following algorithm (Donlon et al 2002):
(1)
where Tsubskin is vertical temperature difference (°C), SST (°C) is calculated from two or
more than two IR data. IR data for JAXA’s SST consisting standard mode SST: 10.4 +
11.2 + 8.6 micron band, and night mode SST: 10.4 + 11.2 + 3.9 micron band.
If the bulk temperature conditions are cooler, the skin temperature value will be
obtained by reducing the SSTsubskin value by a value of 0.14-0.16°K. Subtracting this
value gives the MUR-SST skin data.
AACL Bioflux, 2021, Volume 14, Issue 2.
http://www.bioflux.com.ro/aacl
899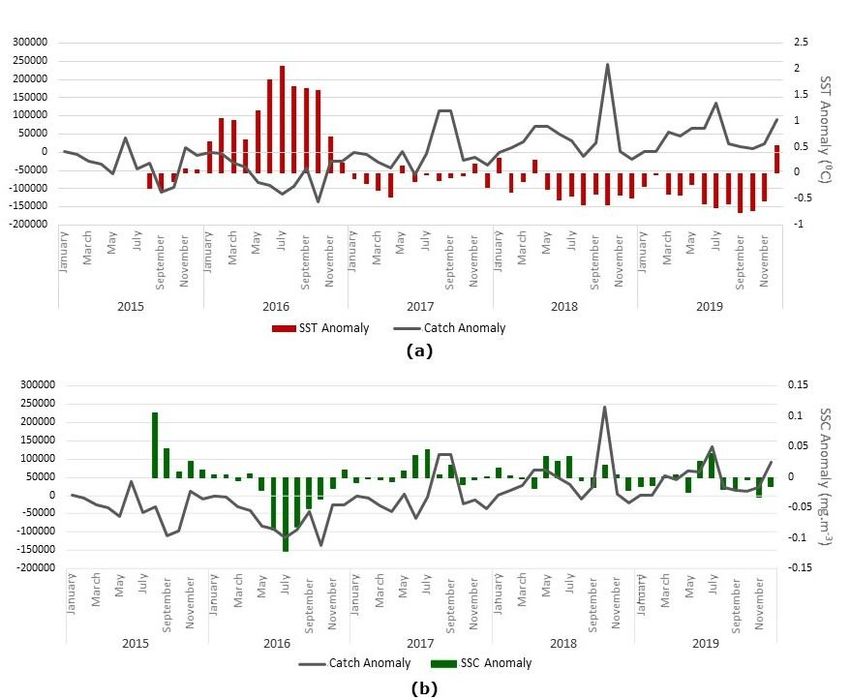
Hourly Himawari-8 data were combined into daily mean data to match the
temporal resolution of the MUR-SST data. The MUR-SST skin data has a spatial resolution
of 1 km, so it cannot be directly combined with the SST data from Himawari-8 due to
differences in resolution. The resolution of the two data was equalized using an image
resampling method. Resampling is the process of rescaling raster data that produces a
new raster cell grid with a cell size that is different from the original raster and can also
be called a cell resizing operation. This process will reduce the spatial resolution of the
MUR-SST from ~ 1 Km to ~ 2 Km, matching the spatial resolution of the Himawari 8
level 3 satellite image data (Wade & Sommer 2006). This analysis was performed in
SeaDAS, a comprehensive software package for the processing, display, analysis, and
quality control of ocean colour data (https://seadas.gsfc.nasa.gov/).
Chlorophyll-a analysis. Chlorophyll-a is a green pigment that has the property of
absorbing visible light when present in the water. As a result of this absorption, the VIS
rays reflected back and captured by the satellite will be less when compared to Near
Infrared (NIR) waves captured by the satellite. From these results, the fertility of the
surface waters in an area can be estimated by calculating the difference between the
values of NIR and visible (VIS) radiation captured by the satellite sensor. The near
infrared channel uses channel 4 while the red light uses channel 3. The transformation
formula of NDVI = (NIR)-(VISred)/(NIR+VISred) was used for calculating the SSC
concentration (Ginting & Jadera 2018), where NDVI is Normalized Difference Vegetation
Index, NIR is the reflectance from the Near Infrared band (0.725 – 1 m), and VISred is
the reflectance from the visible Red band (0.5 – 0.68 m).
The principle of surveying phytoplankton quantity by remote sensing is based on
reflection spectrum difference between sea water and chlorophyll-a. There is a linear
relationship between phytoplankton abundance and chlorophyll-a concentration (Songgun
2010). In the application of remote sensing for estimating chlorophyll concentration,
Jones et al (2007) reports that the applied exponential equation provides a stronger
correlation between NDVI and biomass and chlorophyll concentration. In addition, the
analysis of chlorophyll concentration also improves the predictive ability and accuracy of
NDVI. This model can be compared with other vegetation indices for better prediction and
data analysis (Prabu & Anouncia 2016).
Chlorophyll-a data from JAXA Himawari include water-leaving reflectance of band
01~03, chlorophyll-a concentration, absorption coefficient of phytoplankton + cdom +
detritus, absorption coefficient of particles, aerosol optical thickness of band 2, and
aerosol angstrom exponent in the file type of NetCDF (https://www.eorc.jaxa.jp/ptree/
userguide.html). The analysis was performed in SeaDAS, and the analysis of geographic
data was performed in ArcGIS, a platform to create, manage, share, and analyse spatial
data.
Correlation analysis. Correlation analysis discusses the strength of the relationship
between two or more variables. The strength or absence of a relationship in the
correlation analysis is indicated by a number in the range 0-1. The number 0 indicates no
correlation, and 1 shows a very strong correlation. The correlation criteria between the
two variables is as follows: if 0 ≤ r ≤ 0.2 then the correlation is very weak; if the value is
0.2 ≤ r ≤ 0.4 then the correlation is weak; if the value is 0.4 ≤ r ≤ 0.6 there is a
moderate correlation; if the value is 6 ≤ r ≤ 0.8 the correlation is strong; and if the value
is 0.8 ≤ r ≤ 1 the correlation is very strong. The Pearson correlation coefficient was
calculates using the following formula (Edwards 1976):
(2)
where: r is the correlation coefficient, n is the number of data points, X is the
independent variable, Y is the dependent variable.
AACL Bioflux, 2021, Volume 14, Issue 2.
http://www.bioflux.com.ro/aacl
900
Biplot analysis. Biplot analysis is performed on a data matrix with each column
representing a variable. In the biplot analysis, information is obtained about the
closeness between objects, the diversity of variables, the correlation between variables,
and the variability in the value of an object. Biplot analysis can describe the data in a
summary table in a two-dimensional graph. The information provided by the biplot
includes both objects and modifiers in one figure. In addition, this method can also be
used to describe data and create mappings with two-dimensional graphic displays.
A generalised biplot displays information on both continuous and categorical variables
(Gabriel 1971; Greenacre 2010). Biplot analyses have been used in several fisheries-
related applications such as to visualize the difference in distribution patterns of fish
assemblage composition from before and after the abolishment of fishing lots (Chan et al
2020) and to representing gear selectivity for the most abundant species in a study of
capture fisheries trends (San Diego & Fisher 2014). In this research the biplot analysis
was applied to the variables of fish catch, SST and SSC. This analysis was performed in
XLSTAT software.

Results and Discussion

Yellowfin tuna catch. The production volume of the yellowfin tuna catch reported at
Pondokdadap Fishing Port in Sendangbiru, Malang Regency was higher than that of other
tuna species. During 2015-2019, the highest yellowfin tuna production volume was
obtained in 2019 with a total annual production of 80,189 tonnes and the lowest was in
2016 with a total annual production of 47,560 tonnes (Figure 2).

   Figure 2. Yellowfin tuna catch volume reported by Pondokdadap Fishing Port, Malang,
                           Indonesia over the period 2015-2019.

Yellowfin tuna is a prime commodity with a higher catch volume than any other tuna
species in Indonesia. This is due to the abundant stocks of yellowfin tuna in the Indian
Ocean. Most of the yellowfin tuna landed at Sendangbiru Fishing Port, Malang, Indonesia
came from the waters off the southern coast of East Java. This area is a very strategic
fishing ground, especially for tuna. In addition, these waters are directly adjacent to the
Indian Ocean which has a large diversity of pelagic fish species (Jaya et al 2017). Fish
seasons in Indonesia are influences by the southeast or east and west monsoons. Annual
changes in fisheries catch are influenced by many factors such as oceanographic
phenomena, human factors and fishing gear. Seasonal variability in sea-surface
conditions is similar from year to year and interannual variability is predictable (Hendiarti
et al 2005). A study by Wiryawan et al (2020) revealed a significant correlation between
environmental factor fluctuation and regular seasonality and annual abundance of
yellowfin tuna which indicated by seasonal and annual patterns of variation in the
standardized catch per unit of effort. Seasonal variations in the number of cyclonic
eddies, dissolved oxygen concentration and tuna catches were statistically coupled, and
these links reflect a causative mechanism. Large pelagic fishes, like yellowfin tuna, are

AACL Bioflux, 2021, Volume 14, Issue 2.
http://www.bioflux.com.ro/aacl
                                            901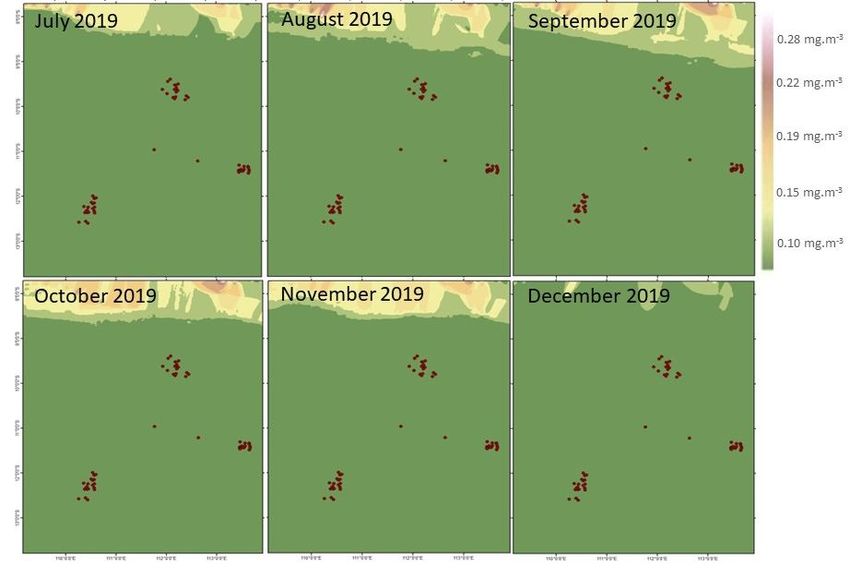
dynamic swimmers sensitive to low dissolved oxygen concentrations due to their high
metabolism (Al Jufaili & Piontkovski 2019).
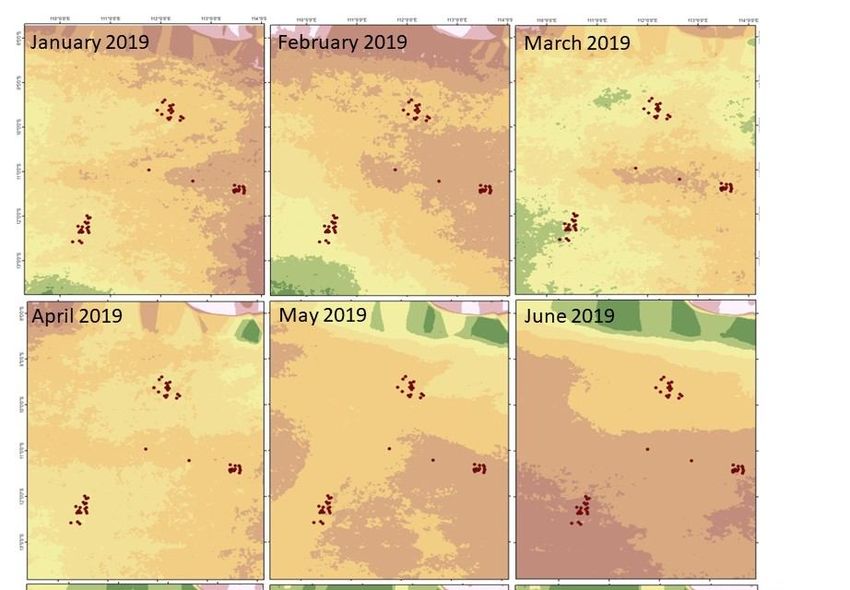
Oceanographic parameters. During the period 2015-2019, SST values in the southern
waters of East Java Province varied between east and west season. During 2015 to 2019,
the average SST in the study area ranged from 25.72 to 29.25°C. The average SST
during the eastern monsoon for all years based on Himawari image data analysis was
around 25.72-27.07°C, while for the west monsoon the SST range was 28.57-28.92°C,
and during the transitional seasons I and II the SST range was 26.00-29.25°C (Figure 3).
Figure 3. Spatial variability of SST (°C) from Himawari image analysis based on average
monthly values for the period 2015-2019.
AACL Bioflux, 2021, Volume 14, Issue 2.
http://www.bioflux.com.ro/aacl
902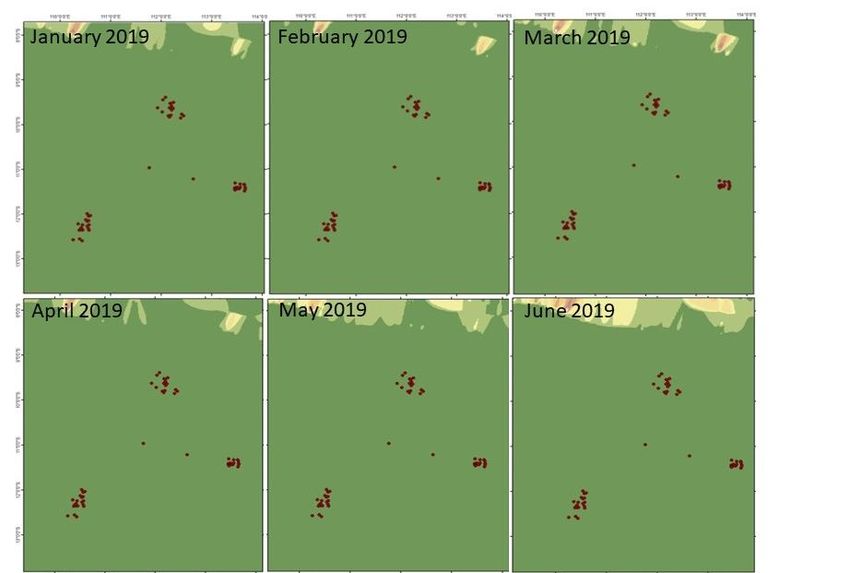
The variation in the distribution of SSC based on the Himawari satellite data
during 2015-2019 ranged from 0.10 to 0.26 mg m-3 (Figure 4). The highest SSC occurred
in August with an average SSC of 0.26 mg m-3 and the lowest in March with an average
of 0.10 mg m-3. This is in accordance with the peak fishing season, which was in the
transition season I (March-May) and during the east monsoon (June-August), when
upwelling phenomena occur.

         Figure 4. Spatial variability of SSC (mg.m-3) from Himawari image analysis.

AACL Bioflux, 2021, Volume 14, Issue 2.
http://www.bioflux.com.ro/aacl
                                            903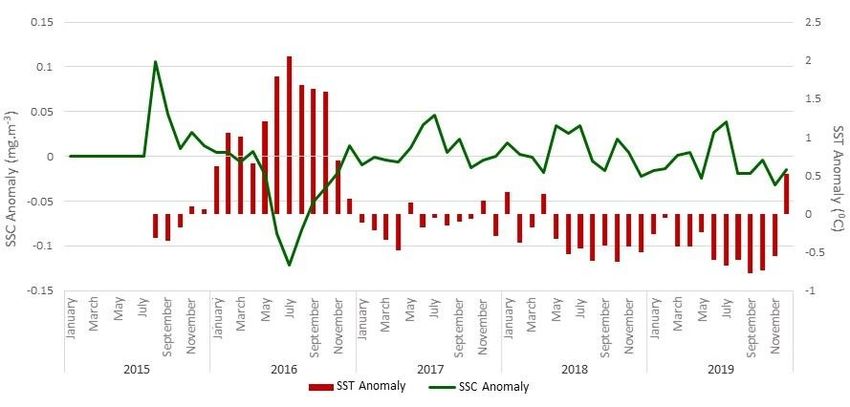
The relationship between oceanographic parameters. The correlation analysis
between SST and SSC was performed on the anomalies (departure from the mean value)
in each parameter (Figure 5). The analysis showed that the highest SST anomaly
occurred in July 2016 (2.05) and the lowest in September 2019 (-0.77). The highest SSC
anomaly occurred in July (0.1) and the lowest was in July 2016 (-0.12). The correlation
value was -0.6108 which shows a strong negative relationship (absolute value in the
interval 0.6-0.799).

   Figure 5. Negative correlation between anomalies in SST and SSC during 2015-2019.

The oceanographic dynamics of the eastern Indian Ocean are influenced by the complex
relationship between remote forcing from the equatorial part of the Indian Ocean and
strong local influences. The dynamics of these waters are influenced by factors such as
the monsoon system, the Indian Ocean Dipole (IOD), El Nino Southern Oscillation
(ENSO), Kelvin waves, Indonesian Cross Flow (ARLINDO), and the Southern Equatorial
Current and currents from the west coast of the Island of Sumatra (Susanto et al 2001;
Setyadji & Amri 2017; Sambah et al 2020). In addition, there are also other factors,
namely the South Java Coastal Current which is a branch of the west coast of Sumatra
current which affects the physical dynamics of the southern waters of Java Island (Purba
2007). The process of mass movement of water results in fluctuations in oceanographic
parameters such as SST and SSC conditions in the waters (Kunarso et al 2011).

The relationship between oceanographic parameters and yellowfin tuna catch.
As described above, the highest SST anomaly was in July 2016 and the lowest was in
September 2019. Meanwhile, the highest yellowfin tuna catch was in August 2017 and
the lowest was in September 2015. The correlation between SST and yellowfin tuna catch
was -0.461, in the moderate range (0.4-0.599). The correlation was negative, so the
relationship between SST and yellowfin tuna catch was inversely proportional. There was
a time lag of 2-3 months between changes in SST and changes in fish catch volume; this
time lag is though to be due to the upwelling processes being followed by an increase in
the amount of SSC, resulting in higher productivity and increasing food availability so
that tuna catch volume increased.
        The correlation between SSC and yellowfin tuna catch was 0.321 and classified as
a low or weak correlation. The correlation value was positive so that the relationship
between SSC and yellowfin tuna catch was directly proportional. This means that an
increase in SSC concentration was followed by an increase in tuna catch volume. The
relationship between SSC on yellowfin tuna also had a time lag of 1-2 months. Figure 6
shows these correlations.

AACL Bioflux, 2021, Volume 14, Issue 2.
http://www.bioflux.com.ro/aacl
                                          904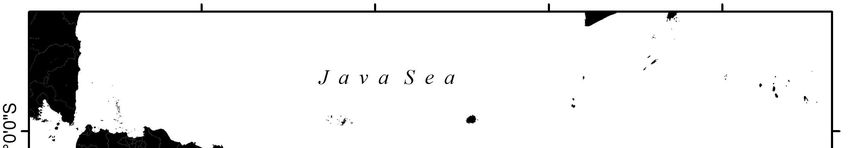
Figure 6. The relationship between oceanographic parameters and yellowfin tuna catch
                      volume: (a) SST anomalies; (b) SSC anomalies.

SST and SSC are oceanographic factors that affect the distribution of fish. Fish will tend
to move towards waters with warm temperatures and a high abundance of phytoplankton
(Kuswanto et al 2017). The distribution of chlorophyll-a is influenced by differences in
sunlight intensity and nutrient concentrations in the water. The distribution of
chlorophyll-a is generally relatively lower in offshore waters and increases towards the
coast. Movements of water masses such as upwellings mean that nutrient-depleted
surface waters will be replaced by nutrient-rich water masses from a lower layer (Kok et
al 2017). Chlorophyll-a concentration can be caused by a high occurrence of nutrient-
enriched on the surface layer of the waters through the various processes of the
dynamics of water masses (Nababan & Simamora 2012; Utari 2013; Trenggono et al
2018).
       The biplot analysis was carried out to find out how the distribution of yellowfin
tuna catches was influenced by SST and SSC. This graphic representation indicates which
parameters have more influence on the fisheries catch (Figure 7). Yellowfin tuna catch
was more influenced by chlorophyll-a, with a total number of 16 points in quadrant 2 that
were affected by chlorophyll-a. In quadrant 1 12 points were affected by SST. Quadrant 3
described 23 points, while quadrant 4 described 8 points with no influencing factors. This
shows that the most dominant factor influencing fish catch volume was SSC.

AACL Bioflux, 2021, Volume 14, Issue 2.
http://www.bioflux.com.ro/aacl
                                           905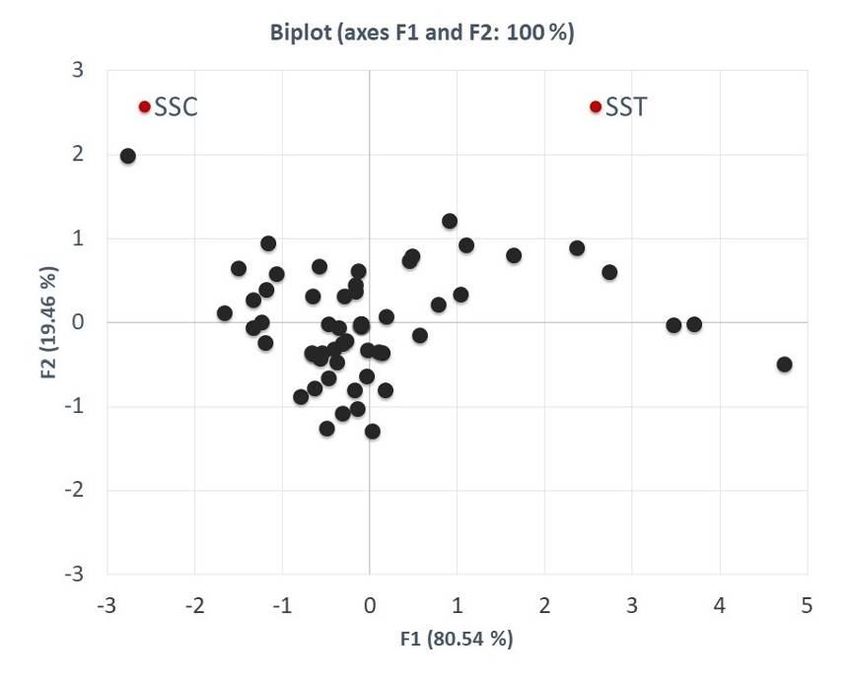
Figure 7. Biplot analysis describing the effect of oceanographic parameters on the
                         distribution of yellowfin tuna catch volume.

Conclusions. It can be concluded that the Himawari satellite data performed well in
describing the spatial variability of the oceanographic parameter SST and SSC. In turn,
these could be used in a correlation analysis with yellowfin tuna catch volume based on
fishing trip data. The analysis of oceanographic parameters showed that SST and SSC
were inversely correlated, as were SST and yellowfin tuna catch. Meanwhile, the
correlation between SSC and yellowfin tuna catch was directly proportional. There was a
time lag of 2-3 months in the relationship between SST and fish catch, and a time lag of
1-2 months in the relationship between SSC and yellowfin tuna catch. Recommendations
for the sustainable management of tuna fisheries in the study area can be formulated
based on temporal and spatial adjustments in fishing grounds, based on the areas
predicted as potential fishing grounds in each season. Future research on the relationship
between oceanographic parameters and fish catch, including statistical analysis to
determine which oceanographic parameters have the strongest influence, could use a
GAM (Generalized Additive Model) approach, modelling oceanographic parameters to map
potential fishing grounds.

Acknowledgements. The authors wish to thank the Japanese Meteorological Agency
(JMA) for the Himawari satellite data, and Laboratory of Fisheries and Marine Resources
Exploration, Faculty of Fisheries and Marine Science, Universitas Brawijaya for data
processing. This study was partly funded by a grant from the Faculty of Fisheries and
Marine Science, Universitas Brawijaya, Indonesia in 2020.

References

Al Jufaili S., Piontkovski S. A., 2019 Seasonal and interannual variations of yellowfin tuna
      catches along the Omani shelf. International Journal of Oceans and Oceanography
      13(2):427-454.
Andersson A., Tamminen T., Lehtinen S., Jürgens K., Labrenz M., Viitasalo M., 2017 The
      pelagic food web. In: Biological oceanography of the Baltic Sea. Snoeijs-Leijonmalm
      P., Schubert H., Radziejewska T. (eds), Springer, Dordrecht, pp. 281-332.
Arnenda G. L., Kusuma D. A., Fergiawan D. G., 2019 Pendugaan stok tuna sirip kuning
      (Thunnus albacares) menggunakan Model Produksi Surplus (MPS) di perairan
      Samudera Hindia (studi kasus: selatan Jawa Timur). Journal of Fisheries and Marine
      Research 3(2):245-251. [in Indonesian]

AACL Bioflux, 2021, Volume 14, Issue 2.
http://www.bioflux.com.ro/aacl
                                            906
Bessho K., Date K., Hayashi M., Ikeda A., Imai T., Inoue H., Kumagai Y., Miyakawa T.,
Murata H., Ohno T., Okuyama A., Oyama R., Sasaki Y., Shimazu Y., Shimoji K.,
Sumida Y., Suzuki M., Taniguchi H., Tsuchiyama H., Uesawa D., Yokota H., Yoshida
R., 2016 An introduction to Himawari‐8/9 - Japan's new-generation geostationary
meteorological satellites. Journal of the Meteorological Society of Japan 94(2):151-
183.
Cahya C. N., Setyohadi D., Surinati D., 2016 Pengaruh parameter oseanografi terhadap
distribusi ikan. Oseana 41(4):1-14. [in Indonesian]
Chan B., Ngor P. B., Hogan Z. S., So N., Brosse S., Lek S., 2020 Temporal dynamics of
fish assemblages as a reflection of policy shift from fishing concession to co-
management in one of the world’s largest tropical flood pulse fisheries. Water
12(11):2974.
Cucalón-Zenck E., 2017 Spatial and temporal distribution of purse-seine yellowfin tuna
(Thunnus albacares) catches in relation to AVHRR derived SST in the eastern
tropical Pacific Ocean. Revista Cientifica de Ciencias Naturales y Ambientales
11(1):1-11.
Donlon C. J., Minnett P. J., Gentemann C., Nightingale T. J., Barton I. J., Ward B., Murray
M. J., 2002 Toward improved validation of satellite sea surface skin temperature
measurements for climate research. Journal of Climate 15(4):353-369.
Edwards A. L., 1976 The correlation coefficient. In: An introduction to linear regression
and correlation. San Francisco, CA: W. H. Freeman, pp. 33-46.
Gabriel K. R., 1971 The biplot graphic display of matrices with application to principal
component analysis. Biometrika 58(3):453-467.
Ginting J. A., Jadera A. M., 2018 Analisa indeks vegetasi menggunakan citra satelit lansat
7 dan lansat 8 menggunakan metode k-means di kawasan Gunung Sinabung.
Indonesian Journal of Computing and Modelling 1(1):42-48. [in Indonesian]
Greenacre M., 2010 Biplots in practice. BBVA Foundation, Bilbao, Spain. Available
at: http://www.multivariatestatistics.org. Accessed: August, 2020.
Hendiarti N., Suwarso, Aldrian E., Amri K., Andiastuti R., Sachoemar S., Wahyono I. B.,
2005 Seasonal variation of pelagic fish catch around Java. Oceanography 18(4):
112-123.
Japan Meteorological Agency, 2014 New geostationary meteorological satellites -
Himawari-8/9-.Satellite Program Division, Observation Department Japan
Meteorological Agency.
Jatmiko I., Hartaty H., Nugraha B., 2016 Estimation of yellowfin tuna production landed
in Benoa port with weight-weight, length-weight relationships and condition factor
approaches. Indonesia Fisheries Research Journal 22(2):77-84.
Jaya M. M., Wiryawan B., Simbolon D., 2017 Analisis tingkat pemanfaatan sumberdaya
ikan tuna dengan metode potential ratio spawning di perairan Sendangbiru. Jurnal
Ilmu dan Teknologi Kelautan Tropis 9(2):597-604. [in Indonesian]
Jin X., Dong C. , Kurian J., McWilliams J. C., Chelton D. B., Li Z., 2009 SST-Wind
interaction in coastal upwelling: oceanic simulation with empirical coupling. Journal
of Physical Oceanography 39(11):2957-2970.
Jones C. L., Weckler P. R., Maness N. O., Jayasekara R., Stone M. L., Chrz D., 2007
Remote sensing to estimate chlorophyll concentration in spinach using multi-
spectral plant reflectance. Transactions of the ASABE 50(6):2267-2273.
Kok P. H., Mohd Akhir M. F., Tangang F., Husain M. L., 2017 Spatiotemporal trends in the
southwest monsoon wind-driven upwelling in the southwestern part of the South
China Sea. PLoS ONE 12(2):e0171979.
Kunarso, Hadi S., Ningsih N. S., Baskoro M. S., 2011 Variabilitas suhu dan klorofil-a di
daerah upwelling pada variasi kejadian ENSO dan IOD di perairan Selatan Jawa
sampai Timor. Jurnal Ilmu Kelautan 16(3):171-180. [in Indonesian]
Kuswanto T. D., Syamsuddin M. L., Sunarto, 2017 Hubungan suhu permukaan laut dan
klorofil-a terhadap hasil tangkapan ikan tongkol di Teluk Lampung. Jurnal Perikanan
dan Kelautan 8(2):90-102. [in Indonesian]
AACL Bioflux, 2021, Volume 14, Issue 2.
http://www.bioflux.com.ro/aacl
907Lan K. W., Nishida T., Lee M. A., Lu H. J., Huang H. W., Chang S. K., Lan Y. C., 2012
Influence of the marine environment variability on the yellowfin tuna (Thunnus
albacares) catch rate by the Taiwanese longline fishery in the Arabian Sea, with
special reference to the high catch in 2004. Journal of Marine Science and
Technology 20(5):514-524.
Mustapha A. M., Chan Y. L., Lihan T., 2010 Mapping of potential fishing grounds of
Rastrelliger kanagurta (Cuvier, 1871) using satellite images. Proceeding of Map Asia
& ISG July 2010, Kuala Lumpur, Malaysia.
Nababan B., Simamora K., 2012 [Variability of chlorophyll-a concentration and sea
surface temperature of Natuna waters]. Jurnal Ilmu dan Teknologi Kelautan Tropis
4(1):121-134. [in Indonesian]
Nurdin S., Mustapha M. A., Lihan T., 2013 The relationship between sea surface
temperature and chlorophyll-a concentration in fisheries aggregation area in the
archipelagic waters of Spermonde using satellite images. AIP Conference
Proceedings 1571(1):466.
Nurholis, Gaol J. L., Syah A. F., Dewi A. K., 2020 GIS-based spatio-temporal analysis on
yellowfin tuna catch in Eastern Indian Ocean off Sumatera. IOP Conference Series:
Earth and Environmental Science 429:012041.
Prabu M., Anouncia M., 2016 NDVI generation of chlorophyll from OCM data for the
Indian Ocean region using multispectral images. Research Journal of
Pharmaceutical, Biological and Chemical Sciences 7(5):2855-2866.
Purba M., 2007 Dinamika perairan selatan Pulau Jawa – Pulau Sumbawa saat muson
tenggara. Torani 17(2):140-150. [in Indonesian]
Sambah A. B., Oktavia T. D., Kusuma D. W., Iranawati F., Hidayati N., Wijaya A., 2020
Oceanographic variability and its influence on pelagic fish catch in the Bali Strait.
Berkala Penelitian Hayati 26(1):8-16.
San Diego T. J., Fisher W., 2014 Trends in the capture fisheries in Cuyo East Pass,
Philippines. International Journal of Fisheries and Aquatic Studies 1(3):57-72.
Setiawati M. D, Sambah A. B., Miura F., Tanaka T., As-syakur A. R., 2015
Characterization of bigeye tuna habitat in the southern waters off Java–Bali using
remote sensing data. Advances in Space Research 55(2):732-746.
Setyadji B., Amri K., 2017 Pengaruh anomali iklim (ENSO dan IOD) terhadap sebaran
ikan pedang (Xiphias gladius) di Samudera Hindia bagian timur. Jurnal Segara
13(1):49-63. [in Indonesian]
Sommer U., Charalampous E., Scotti M., Moustaka-Gouni M., 2018 Big fish eat small fish:
implications for food chain length. Community Ecology 19(2):107-115.
Songgun R. I., 2010 Assessment on phytoplankton quantity in coastal area by using
remote sensing data. Marine Environment Monitoring and Forecasting Division,
State Hydrometeorological Administration DPR Korea. Downloaded from
http://diktas.iwlearn.org/yslme/documents/public-awareness-communications-
strategy/2nd-regional-science-conference-24-26-feb-
2010/5.%20Songgun%20Ri.ppt/at_download/file. Accessed on November 2, 2020.
Suhartono N., Muzzneena A. M., Tukimat L., Mazlan A. G., 2015 Determination of
potential fishing grounds of Rastrelliger kanagurta using satellite remote sensing
and GIS technique. Sains Malaysiana 44(2):225-232.
Susanto R. D., Gordon, A. L., Zheng Q., 2001 Upwelling along the coasts of Java and
Sumatra and its relation to ENSO. Geophysical Research Letters 28(8):1599-1602.
Trenggono M., Amron, Pasha W. A., Rolian D. L., 2018 Effects of el nino on distribution of
chlorophyll-a and sea surface temperature in northern to southern Sunda Strait.
E3S Web of Conferences 47:05004.
Utari N., 2013 Klorofil-a dengan hasil tangkapan ikan di hubungan Suhu Permukaan Laut
(SPL) dan klorofil-a dengan hasil tangkapan ikan di Pelabuhan Pendaratan Ikan
(PPI) Blanakan Subang menggunakan citra satelit modis. UT - Aquatic Product
Technology. Institut Pertanian Bogor.
Wade T., Sommer S., 2006 A to Z GIS: an illustrated dictionary of geographic
information systems. 2nd edition, ESRI Press, 268 pp.
AACL Bioflux, 2021, Volume 14, Issue 2.
http://www.bioflux.com.ro/aacl
908Wass H. J. D., Siregar V. P., Jaya I., Gaol J. L., 2012 Coastal upwelling under the
influence of westerly wind burst in the North of Papua continent, Western Pacific.
International Journal of Remote Sensing and Earth Sciences 9(2):128-139.
Wiryawan B., Loneragan N., Mardhiah U., Kleinertz S., Wahyuningrum P. I., Pingkan J.,
Wildan, Timur P. S., Duggan D., Yulianto I., 2020 Catch per unit effort dynamic of
yellowfin tuna related to sea surface temperature and chlorophyll in southern
Indonesia. Fishes 5:28.
Yoga R. B., Setyono H., Harsono G., 2014 Dinamika upwelling dan downwelling
berdasarkan variabilitas suhu permukaan laut dan klorofil-a di perairan Selatan
Jawa. Jurnal Oseanografi 3(1):57-66. [in Indonesian]
Zainuddin M., 2007 Pemetaan daerah potensial penangkapan ikan kembung lelaki
(Rastrelliger kanagurta) di perairan kabupaten Bantaeng, Sulawesi Selatan
[Mapping of potential fishing grounds of Rastrelliger kanagurta in Bantaeng waters,
South Sulawesi]. Jurnal Sains dan Teknologi 7(2):57-64. [in Indonesian]
Received: 28 October 2020. Accepted: 10 February 2021. Published online: 02 April 2021.
Authors:
Abu Bakar Sambah, Faculty of Fisheries and Marine Science, Universitas Brawijaya, Jl. Veteran Malang 65145
East Java, Indonesia, e-mail: absambah@ub.ac.id
Asmiatul Muamanah, Faculty of Fisheries and Marine Science, Universitas Brawijaya, Jl. Veteran Malang 65145
East Java, Indonesia, e-mail: asmiatulmuamanah4@gmail.com
Ledhyane Ika Harlyan, Faculty of Fisheries and Marine Science, Universitas Brawijaya, Jl. Veteran Malang 65145
East Java, Indonesia, e-mail: ledhyane@ub.ac.id
Tri Djoko Lelono, Faculty of Fisheries and Marine Science, Universitas Brawijaya, Jl. Veteran Malang 65145 East
Java, Indonesia, e-mail:
Feni Iranawati, Faculty of Fisheries and Marine Science, Universitas Brawijaya, Jl. Veteran Malang 65145 East
Java, Indonesia, e-mail: t.djoko@ub.ac.id
Aida Sartimbul, Faculty of Fisheries and Marine Science, Universitas Brawijaya, Jl. Veteran Malang 65145 East
Java, Indonesia, e-mail: aida@ub.ac.id
This is an open-access article distributed under the terms of the Creative Commons Attribution License, which
permits unrestricted use, distribution and reproduction in any medium, provided the original author and source
are credited.
How to cite this article:
Sambah A. B., Muamanah A., Harlyan L. I., Lelono T. D., Iranawati F., Sartimbul A., 2021 Sea surface
temperature and chlorophyll-a distribution from Himawari satellite and its relation to yellowfin tuna in the
Indian Ocean. AACL Bioflux 14(2):897-909.
AACL Bioflux, 2021, Volume 14, Issue 2.
http://www.bioflux.com.ro/aacl
909You can also read