Seafood Consumer of the Future - Alaska Seafood
←
→
Page content transcription
If your browser does not render page correctly, please read the page content below

Seafood
    Consumer of
    the Future

© 2017 Technomic Inc.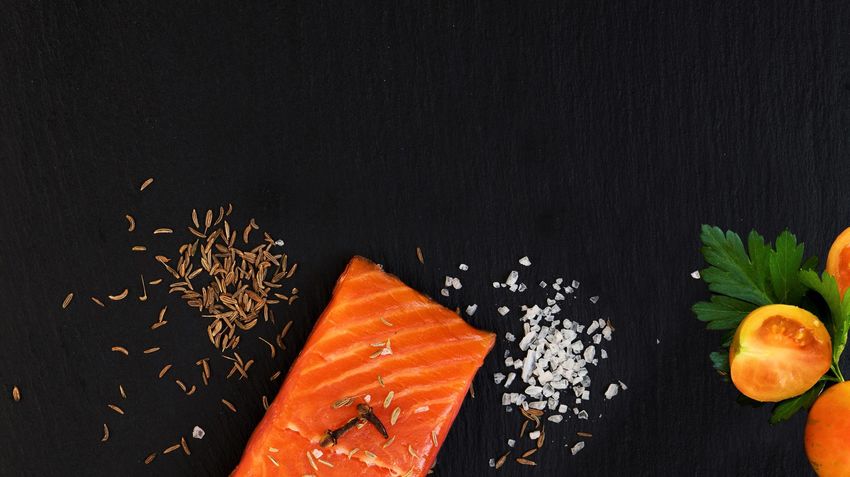
PROGRAM OVERVIEW
      Alaska Seafood Marketing               Deep dive into secondary sources
      Institute retained Technomic to                 to assess landscape and      PHASE ONE:
                                                opportunity of future seafood      SECONDARY
      identify future trends in seafood                consumer marketplace
                                                                                     REVIEW
      consumption, and how Alaska
      Seafood can best position itself
      within this dynamic
      marketplace
                                          Assess Alaska Seafood fit within the
                                            market to develop target consumer      PHASE TWO:
                                                personas, and actionable brand       PRIMARY
      Technomic proposed a two             strategy - anticipating strengths and
                                                                                    RESEARCH
      phase approach                                   challenges for the brand

© 2017 Technomic Inc.                                                                           2
PHASE ONE:                           Technomic leveraged internal and
                                       external resources to assess the
  SECONDARY                            current landscape and opportunity
  REVIEW                               for Alaska Seafood. Data sources
  METHODOLOGY                          used in this phase include:

   • Technomic Trend Reports and   •   Mintel
     Presentations                 •   Nielsen
   • Bureau of Labor               •   Food Marketing Institute
   • U.S. Census                   •   U.S. National Library of Medicine
   • Morgan Stanley                •   Pew Research Institute
   • Euromonitor                   •   Among Others…

© 2017 Technomic Inc.                                                      3
The best predictor
                        of future behavior
                                is…
                         past behavior
© 2017 Technomic Inc.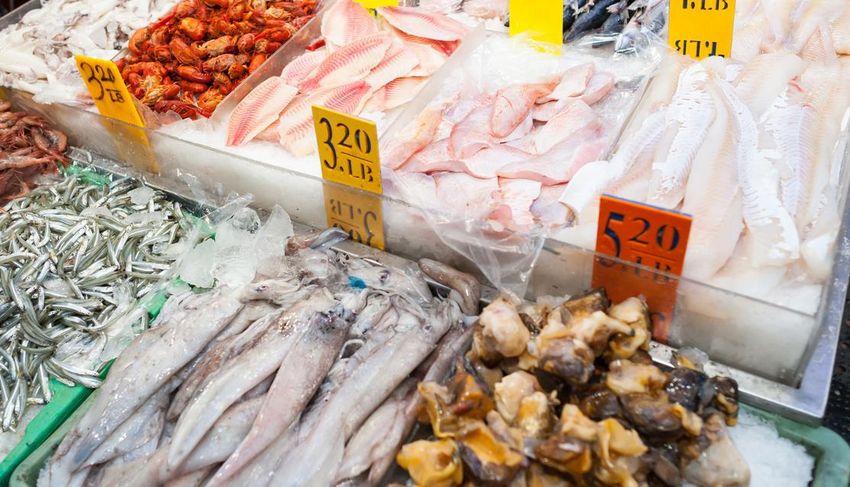
$50,000.00                               Consumption Levels by Age Group 1984-2013
                                                                                                        OVERALL SPEND
  $40,000.00                                                                                            PATTERNS
                                                                                                        By age groups over time
  $30,000.00

  $20,000.00
                                                                                                                      Insurance
                                                                                                                      Education
                                                                                                                      Entertainment
  $10,000.00
                                                                                                                      Health Care
                                                                                                                      Transportation
                                                                                                                      Apparel & Services
                $-                                                                                                    Housing
                             Under 25               25-34               35-44   45-54   55-64   65-74     75+         Food
Source: Morgan Stanley (2016) “Generations Change How Spending is Trending”
© 2017 Technomic Inc.                                                                                                                      5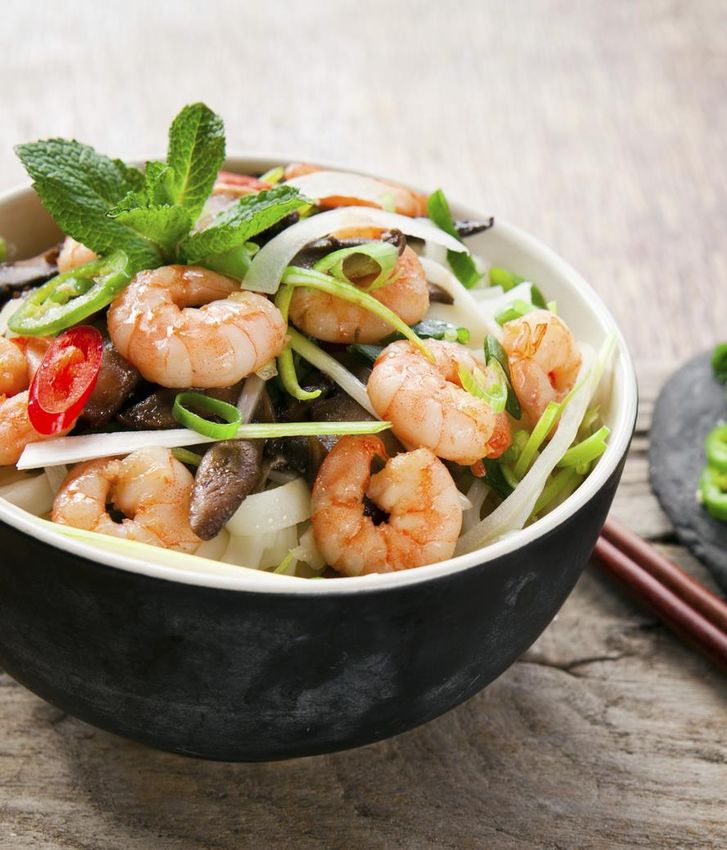
Mean Food Expenditures by Age, 2013

   AGE GROUP                                                                Share of spend
                                                                           away-from-home
                                                                                               45%       43%     41%     41%     37%     38%    32%

 FOOD                                                                             $9,000

                                                                                  $8,000

 SPEND                                                                            $7,000

  At-home and                                                                     $6,000
  away-from-home
                                                                                  $5,000

                                                                                  $4,000

                                                                                  $3,000
                      Food away-from-
                                                                                  $2,000
                      home
                      Food at-home                                                $1,000

                                                                                       $-
Source: bureau of Labor Statistics (2105) “Consumer expenditures by age”                     Under 25   25-34   35-44   45-54   55-64   65-74   75+
© 2017 Technomic Inc.                                                                                                                                 6
IN 2025… NEW WORKFORCE, NEW LIFESTAGE GROUPS A larger proportion of Gen Z will be in the workforce More Millennials will be married with kids, impacting their food spend behavior Some Gen X and older Millennials will start becoming empty nesters © 2017 Technomic Inc. 7

American Diversity by Generation

    GI
                                        80+
                                                                                                                                                                               FUTURE
    Generation                       70-79
                                                                                                                                                                               CONSUMERS
    Boomer
                                     60-69
                                                                                                                                                                               WILL BE
                                     50-60

                                     45-50
                                                                                                                                                                               MORE
    Gen X
                                     40-44                                                                                                                                     DIVERSE
                                     30-39
    Millennial
                                     20-29

                                     10-19
    Gen Next
U.S. Ethnic Group Population Projections

 By 2060…                                                                                                                                            2014                                            2060                      2060-2014
                                                                                           Ethnic Group
 NH White                                                                                                                      Population
                                                                                                                                (Millions)
                                                                                                                                                                       (%)                             (%)                   % Difference

 population share                                                                          Non-Hispanic
                                                                                           White
                                                                                                                                       197                          62.1%                           42.6%                          -19.5%

 shrinks by                                                                                Hispanic                                     56                          17.6%                           29.3%                          +11.7%

 20%                                                                                       African-
                                                                                           American
                                                                                                                                        40                          12.7%                           14.7%                           +2.0%

                                                                                           Asian-
                                                                                                                                        16                           5.0%                            8.2%                           +3.2%
                                                                                           American

                                                                                           Other/2+
                                                                                                                                        14                           4.3%                            8.2%                           +3.9%
                                                                                           Races

   Source: Nielsen (2015), “The Multicultural Edge: Rising Super Consumer”. Original data sourced from Nielsen Pop-Facts 2014 with U.S. Census Bureau , 2060 projections (Dec 2012) with reported numbers to exceed 100% due to
   allocation/overlap for Hispanics of mixed race. Included in “Other/2+ Races” are 3.1 million native American Indian and Native Alaskans (AINA), plus 600,000 Native Hawaiian & Pacific Islanders (NHPI), all generally of moderate growth.

© 2017 Technomic Inc.                                                                                                                                                                                                                           9
CURRENT THEMES                                        WOMEN
                                  DIGITAL              BREAKING
DRIVING                         EVERYWHERE             THROUGH
                                                        GLASS
                                                        CEILING
SHOPPER
CHANGE                                      CONSUMER
                                             DEMAND
                                               FOR
                                                                    CONSUMER
                                                                  PREFERENCES
                                                                      FOR
  In addition to demographic                 HEALTHY               SUSTAINABLE
  shifts, changes in taste,
  technology and the
  American household will        HIGHER
                                                       CHANNEL
                                EDUCATION
  shape the future of seafood       &                  AGNOSTIC
                                 HIGHER                SHOPPING
  consumption                     DEBT

© 2017 Technomic Inc.                                                            10
who
…is
shopping
© 2017 Technomic Inc.57% 43% Male
THE SHOPPER Female
GENDER
Primary
DIFFERENTIAL Grocery
WILL Shopper
CONTINUE TO by
Gender
DECREASE
Source: FMI (2015) “U.S. Grocery Shopper Trends, 2015
© 2017 Technomic Inc. 12GROCERY SHOPPER
83% OF CONSUMERS ARE
ROLE RESPONSIBLE FOR HOUSEHOLD
GROCERY SHOPPING
SEGMENTATION
17% 21% 36% 8% 19%
Non-Shopper Self-shopper Primary shopper Secondary shopper Shared shopper
Grocery Shopping Roles Among Adults in U.S.
Source: FMI (2015) “U.S. Grocery Shopper Trends, 2015
© 2017 Technomic Inc. 13MONTHLY+ SEAFOOD CONSUMER DEMOGRAPHICS
Age group Gender
75%
19-30 61%
55%
84%
31-50 73% 82% 84% All Seafood
56%
88%
51-70 81% 74% 75% Fish
54%
85%
71+
46%
81% 53% 55% Shellfish
Any seafood Fish Shellfish
Education Ethnicity
All Fish Shellfish
All Fish Shellfish
Caucasian (non-
Post Secondary 87% 80% 60% 83% 74% 53%
Hispanic)
HS or equivalent 82% 71% 50%
Mexican American 83% 70% 60%how
…are they
shopping
© 2017 Technomic Inc.grocery shopping
GROCERY CHANNEL is increasingly
SOURCING a multi-channel
experience
FRAGMENTATION
80%
Primary Grocery Store by Channel Grocery Category Segment Usage (%)
Fairly Often/Almost Always visit 2016 2017
60%
Supermarket 85 83
Supercenter 54 53
40% Discount Store 29 31
Limited Assortment 21 25
Dollar Store 20 22
20%
Drug Store 18 18
Natural + Organic 13 17
0%
Convenience Store 8 11
Supermarket Supercenter Warehouse Limited No Primary
Assortment Store Ethnic Food Store 7 11
2005 2010 2015 2016 2017 Online-only Food Store 5 11
Source: FMI (2017) “U.S. Grocery Shopper Trends, 2017
© 2017 Technomic Inc. 16IN THE UNIVERSE OF MEAL SOURCING OPTIONS
NEW FORMATS BRIDGE FOODSERVICE AND RETAIL
SOLUTIONS
Sourced away-
from-home
TRADITIONAL TRADITIONAL
FOOD RETAIL
SERVICE RETAIL MEAL
SOLUTIONS C-Store
DIGITAL
Foodservice MEAL KITS /BRICK& Retail
MORTAR
HYBRID
DIGITAL 3RD PARTY
TRADITIONAL ON-DEMAND
DELIVERY DELIVERY
DELIVERY
ONLINE
GROCERY
Sourced
at-home
© 2017 Technomic Inc.THE EMERGENCE OF DIGITAL/BRICK & MORTAR
HYBRID FORMATS REFLECT GROCERY SHOPPING
IN TRANSITION
18
© 2017 Technomic Inc.DIGITAL GROCERY
USAGE AT 23% IN 2017
Internet users who have purchased
groceries digitally
Younger
24%
Millennials
Older
26%
Millennials
Gen X 24%
Baby
21%
Boomers
Senior (73+) 12%
Source: Emarketer (2017) “Online Grocery Shipping is No Longer Just a Millennial Story”
© 2017 Technomic Inc. 19THE AVERAGE AMERICAN OWNS
FOUR INTERNET ENABLED DEVICES
The “Internet of Things” is closing the gap between need recognition
and need fulfillment
• 64% of households • 17 million appliances
SMART SMART
• Over half of users “PHONE” KITCHEN expected to hit 202
make purchases on million globally by
them 2021 at CAGR of 25%
FOOD/MEAL
NEED
RECOGNITION
• From the TV to the OTHER SMART • Currently in 7% of
tablet to the SUV, DEVICE(S) “SPEAKERS” households
Americans are online, • projected to be installed in
building wishlists and in 55% of households by
placing orders 2022
Source: Grand View Research (2015); Juniper Research (2016); Pew Research Center (2016); Tech Crunch (2017)
© 2017 Technomic Inc.WHERE AMERICANS DO THEIR
ONLINE SHOPPING
43% 23% 25%
In the In retail
In Bed
office stores
20% 20% 10%
In the While
In the drinking
bathroom
car
Source: BigCommerce (2017) “Omni-Channel Retail in 2017”
© 2017 Technomic Inc. 21WHERE IT’S HEADED?... EVEN EASIER © 2017 Technomic Inc. 22
SEAFOOD CONSUMPTION IS                                                                                                      Sourcing by department for at-home consumption
FRAGMENTED ACROSS
                                                                                                                                                                           95%
FOODSERVICE BUT SILOED IN                                                                                                  Meat dept
RETAIL
      Quick-service restaurants                                  20%                                                                                                       97%
                                                                            40%Seafood        entree
                                                                                                                        Produce dept
         Fast-casual restaurants                              15%                        sourcing
                                                                            41%
                                                                              Once a week+ & never
        Family-style restaurants                             14%                                                                                                       94%
                                                                             42%
                                                              16%                                                           Deli dept
49% order            Traditional CDR                          17%
  once a
 month or                                                  11%
less often               Upscale CDR                                     35%                                                                                               97%

          Fine-dining restaurants                         9%                                                             Bakery dept
                                                                              44%

      Local, independent FSRs                                  17%
                                                                 23%                                                                                                86%

                                        RMS                        25%                                                  Seafood dept
                                                                     33%

                                  At home                                            57%
                                                        4%
                                                                                                                          > $2MM grocery               Supercenters
                                        Once a week+               Never                                                  Mass merch w/ supercenters   Warehouse/club
 Base: 1,300 seafood consumers
 Q: How often do you eat seafood as a main entree, or as an ingredient/topping on a main entree (e.g., on a sandwich,     Dollar stores                Convenience store
 entree salad, etc.) from the following places?
 Source: Nielsen (2014) “Perishables Group Seafood Trends”
                                                                                                                          Drug store

 © 2017 Technomic Inc.                                                                                                                                                           23
Currently this favors non-grocery and non-
THE E-COMMERCE fresh categories. This will shift as e-
commerce becomes normalized and
CONSUMER LOOKS previous deterrents become additional
FOR… drivers.
DRIVERS DETERRENTS
CONVENIENCE FRESHNESS
VALUE QUALITY
ABILITY TO SAFETY
“STOCK-UP”
© 2017 Technomic Inc. 24what
…are they
shopping
for
© 2017 Technomic Inc.AMERICANS ARE
ASPIRING
TO A HEALTHY DIET
% who have Yes
changed their diet No
in past 3 years
Of those who have changed their
diet, 70% are now eating healthier
foods
© 2017 Technomic Inc. 26Reasons for eating more meals with seafood
Select all
% Overall
CONSUMERS WHO I'm trying to eat healthier and
consider seafood to be
57%
63%
REPORT EATING MORE healthier 67%
SEAFOOD CITE, I'm eating more seafood
in lieu of meat
32%
42%
38%
HEALTH AS THE I like more of the seafood
options available at foodservice
locations
36%
30%
33%
PRIMARY DRIVER There are more seafood
options available at foodservice
locations 19%
30% 23%
Seafood options are more 19% 22%
affordable at retail locations 24%
Say they’ve eaten more Seafood options are more
affordable at foodservice
25% 20%
30% seafood over the past locations
I'm more concerned about the
17%
year environmental impacts of meat
production 12%
22% 16%
Base:447 who report eating more meals with seafood
18–34 35+
Q: Why are you eating more meals with seafood? Select all that apply.
© 2017 Technomic Inc. 27YOUNGER CONSUMERS ARE MORE LIKELY TO FIND
SEAFOOD AND PLANT-BASED PROTEINS TO BE
HEALTHIER THAN POULTRY, BEEF OR PORK
Health perceptions of seafood &
vegetarian options Agree & agree completely %
Overall
64%
…beef and/or pork 56% 58%
I consider seafood to
be healthier than… …chicken and/or turkey 50%
40% 43%
59%
…beef and pork 52% 55%
I consider
49% Up from
vegetarian/vegan …chicken and turkey 39% 43% 35% in
2014
options to be healthier
than… …seafood
46%
Up from
36% 40% 33% in
2014
18–34 35+
Base: 1,083 (seafood) and 589 (vegetarian/vegan) consumers
Q: Please indicate your agreement or disagreement with the following statements regarding seafood.
Please indicate your agreement or disagreement with the following statements regarding vegetarian and/or vegan options/substitutes.
© 2017 Technomic Inc.THERE IS AN OPPORTUNITY FOR VALUE
PRODUCTS FOR YOUNGER SEAFOOD CONSUMERS
% who say they purchase the following types of seafood
25% $25
20% $20
15% $15
10% $10
5% $5
0% $0
Lobster Salmon Scallops Tilapia Lobster Salmon Scallops Tilapia
Total shoppers Boomers (1946-1964) Millennials (1980-1995)
Source: Nielsen (2014) “Perishables Group Seafood Trends”
© 2017 Technomic Inc. 29CONSUMER “I am more interested today in “I am more interested today in how
INTEREST IN where my food was sourced from
than I was two years ago…”
food is grown, raised or produced
than I was two years ago…”
HOW FOODIS % agree completely or agree % agree completely or agree
PRODUCED
HAS 64% 64%
INCREASED Overall Overall
71% 69%
Millennials Women
Base: 2,000
Q: Is it more important to you that a food's source is regionally specified at certain
types of restaurants and other foodservice locations versus others?
© 2017
© 2017 Technomic
Technomic Inc.
Inc. 30SUPPORTING FOOD PRODUCERS RANKS HIGHEST
FOR PREFERENCE FOR ORIGIN-SPECIFIC PRODUCTS
Top Three Reasons Consumers Prefer Origin-specific %
Products overall
I prefer to support food producers who
are located in my region or in the U.S. 1 61%
I am just interested to know where
an item was grown/produced 2 42%
Products from regions associated with
certain foods are higher in quality 3 39%
I prefer to avoid food from certain regions
31%
because of concerns over safety or quality
I prefer to avoid food from certain regions
because of environmental issues 18%
18–34 35+
Base: 1,505
Q: Thinking about all the types of items in restaurants or other foodservice locations for which origin-specific sourcing is important to you, what would you say are your TOP TWO reasons for preferring origin-specific products? (Top 5 shown)
© 2017 Technomic Inc. 31PLACE OF ORIGIN, ENVIRONMENTAL IMPACT AND PRODUCTION
METHOD ALL PLAY A PART IN THE SEAFOOD PURCHASING
DECISION
Importance of seafood sourcing
Agree & agree completely
% Overall
It's important that the environment is 37%
not negatively impacted by the 41%
seafood I eat 45%
It's important to know which country 38%
the seafood I eat is from
40%
43%
I prefer to eat seafood caught in the 36%
39%
wild rather than farm-raised seafood 41%
Male Female
Base: Approximately 1,082 seafood consumers
Q: Please indicate your agreement or disagreement with the following statements regarding seafood.
© 2017 Technomic Inc. 32The …digitally native
…highly educated
seafood …health-conscious
consumer …sustainability-
minded
of the …sourcing their
future is meals from wherever
[…] …urban & suburban
…on social media
© 2017 Technomic Inc.Key Takeaways
Alaska Seafood is well positioned to take advantage of trends in
seafood consumption, but to do so will need…
….A consumer strategy that targets consumers in and
approaching peak spending years
…A product strategy that highlights health, sustainability, and
uses source-specificity to elevate the Alaska Seafood brand
…A go-to-market strategy that anticipates the challenges and
opportunities of omni-channel fresh food sourcing
© 2017 Technomic
© 2017 Inc. Inc.
Technomic 34Next
Steps
PHASE ONE: DOMESTIC PHASE TWO: STRATEGIC
SECONDARY COMMITTEE PRIMARY WORK
REVIEW MEETING RESEARCH SESSION
SEPTEMBER- NOVEMBER, 27 DECEMBER- FEBRUARY,
NOVEMBER FEBRUARY TBD
© 2017 Technomic
© 2017 Inc. Inc.
Technomic 35Will Notini
Manager, Consumer Insights
wnotini@technomic.com
© 2017 Technomic Inc. 36Questions? © 2017 Technomic Inc.
You can also read