Seneca in 2021: A planning framework for student success

                     January 2010
←
→
Page content transcription
If your browser does not render page correctly, please read the page content below
Seneca in 2021: A planning framework for student success
January 2010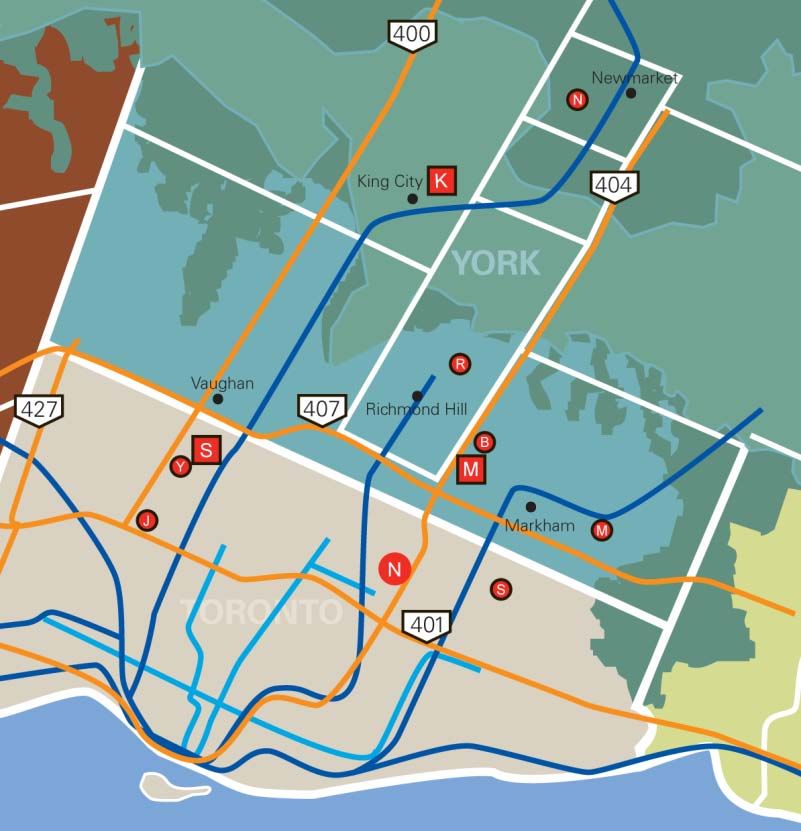
Seneca in 2021: A planning framework for student success
Overview

As a leading Ontario postsecondary education institution, Seneca has both unique opportunities
and fundamental responsibilities shaping our strategic framework for the next decade.
Our opportunities come from the GTA enrolment boom over the next 15 years, our legacy as a
high-quality college, the government’s emphasis on education and postsecondary credential
attainment, the evolution of the system to recognize differentiation among colleges and the
growing sophistication of Seneca itself. And our responsibilities are rooted in the same factors:
we are a critical educational institution, located in the fastest growing region of the province at a
time when Ontario needs more college graduates than ever before, and we are acknowledged as
being capable of playing an even larger role in the province’s economic and social well-being.
With the right focus, determination and investment, in 2021 we will be the leading college in
Ontario, the preferred destination for students, employers, faculty and staff who are seeking
excellence in career-related and professional education. Our brand and reputation will be based
on the quality of our teaching and our strong commitment to students. We will provide relevant
programs, services and supports that foster student success. Seneca will be considered the first-
choice partner by the top-tier universities and a respected competitor by the undergraduate-
focused universities.
In short, Seneca will mean success.
Our progress will be measured by, among other means: our rank in applications, the strength and
depth of our partnerships with other PSE institutions, the demand for our graduates and our
reputation among stakeholders.
While remaining a comprehensive college, we will build a discrete number of academic clusters
with both “deep and wide” programs. Each major cluster will be characterized by a family of
credentials: typically one or more degree offerings, related two- and three-year diplomas and
graduate certificates, along with appropriate continuing education and corporate training
offerings. Our degrees will remain career-oriented, while becoming progressively broader to
reflect growing market demand for ever-increasing advanced credentials as entry-level
requirements to the jobs of the new economy.
We will continue to promote access to postsecondary education and vocational training for
students who demonstrate both commitment and potential, but lack credentials, through our
Seneca Skills umbrella. Seneca Skills will offer programs such as academic upgrading, a variety
of employment-related programs and others that focus on entry-level skills and increasing job
opportunities.
We will offer flexible program delivery to meet the needs of our diverse student body, leveraging
technology and recognizing the imperative for continuous learning. We will recruit, support and

                                                                                                   2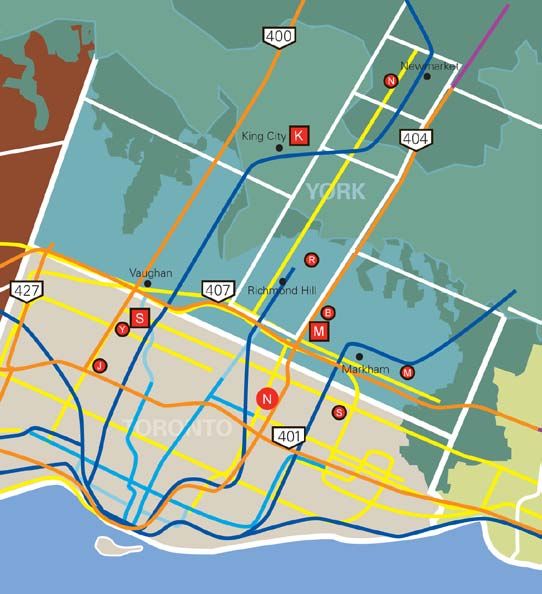
promote the best faculty and staff who have the relevant skills to support Seneca as the student-
centred leader in teaching and learning.
In setting these directions, we will seek to control our growth at a pace, and in academic areas,
that allow us to continue to grow without compromising our focus on quality and student
success. Our “smart growth” targets include the following:
Full-time enrolment will grow about 3.5 per cent a year, or to roughly 30,000 students by
2021, with a supportive policy environment and appropriate government capital investments.
We will focus our expansion in York Region at our Markham and King campuses to provide
about 8,000 more student spaces.
Between 15 and 20 per cent of our program activity will be in degrees. We will also increase
the number of graduate certificates and advanced diplomas to become a preferred destination
for college and university graduates to further their postsecondary education.
Consistent with the labour market needs of the innovation-based economy, we will expand
and strengthen our “deep and wide” academic clusters of expertise. The benefits will be more
comprehensive offerings, greater credential recognition, increased academic laddering
opportunities and greater linkages across sectors and disciplines. These areas include:
financial services and business; community health and safety; creative arts and design;
environment and sustainability; information and communications technology; and aerospace
and flight technology. Within these clusters, there will be program areas where Seneca will
be a provincially and nationally recognized leader. These will include foci in existing areas
of excellence, such as financial services, open source technology, child development and
biotechnology.
To enrich students’ classroom experiences and provide a diverse and global perspective, we
will continue to be a leader in international student education. Up to 15 per cent of our
student population will be from outside Canada. In addition, we will pursue partnerships
with international academic institutions to enhance pathways and mobility options for
students.
Some of the initiatives that will be undertaken in support of these directions will include:
Playing a leadership role in student mobility within the postsecondary system by building
stronger pathways, particularly to the GTA universities. We will be the preferred partner to
smaller colleges to provide their students opportunities for transfer and advanced diplomas.
Broadening our proprietary degree offerings in areas such as business, technology and
multidisciplinary studies, as well as developing our own nursing degree. In partnership with
colleges and universities in the GTA, we will also develop innovative delivery models to
address the imminent growth in demand for undergraduate education. A leading example is
more “2 plus 2” degrees in areas such as interdisciplinary arts and other programs.
Developing a significant public safety and community health education facility at the King
Campus, in cooperation with York Region Police and fire services, aligning our police, fire
and health services programs and developing programming focused on emergency services.
3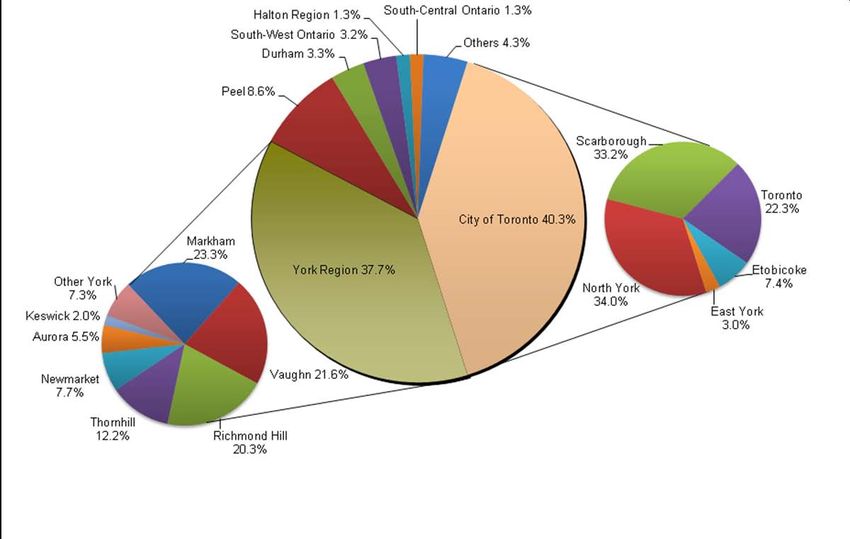
Recognizing that the next decade will be marked by constrained government resources,
ensuring we stay entrepreneurial and ready for partnership opportunities. We will look to
create stronger connections with industry to grow our endowment and assist in capital
investments. We will also look for strategic partnerships that will differentiate Seneca in the
marketplace.
Focusing our research activities on industry-driven research related to our degree offerings,
as well as being the Ontario leader in applied research in pedagogy, building on current
activities in areas such as retention research and the College Math Project.
Increasing the number of reciprocal partnerships with high caliber, international PSE
institutions, including opportunities for our students to study abroad.
Implicit in these directions are choices about what we will not, or no longer, be.
As our applications grow, and our growth is controlled, increasing numbers of applicants will not
find places at Seneca. Our entry level requirements will climb, strengthening our status as a first-
rank institution. Our high academic standards will be maintained, while our retention and
graduation rates will improve. Through Seneca Skills, we will continue to offer access
opportunities for non-traditional students, who can succeed at the college level but lack
credentials.
Seneca has not traditionally focused on the apprenticeship trades, and we do not intend to
increase activity in that area. We also shed our “community college” label, both in name and in
reality, some time ago. The government does not fund us to accept every student who applies,
nor would it serve our past, current or future students for us not to insist on rigorous academic
standards for entry to our programs. Our approach infuses the Seneca credential with a consistent
and differentiated excellence across all program areas.
We will also continually review our academic directions, with our industry partners and program
advisory committees for opportunities for growth and further focus. While we have to be
sensitive to the ebb and flow of business and economic cycles, we also need to review programs
with low or declining enrolment to ensure a continued fit with our academic directions.
This framework sets out a direction for Seneca’s own success: a distinctive positioning in the
postsecondary marketplace based on an unapologetic drive to be the best college.
Our mission has evolved, as have the education system and the economy in which we are
preparing our students to participate. But at heart we remain relentlessly focused on providing
our students with the highest-quality, career-related and professional education possible. And if
we accomplish that, then truly Seneca is success.
4
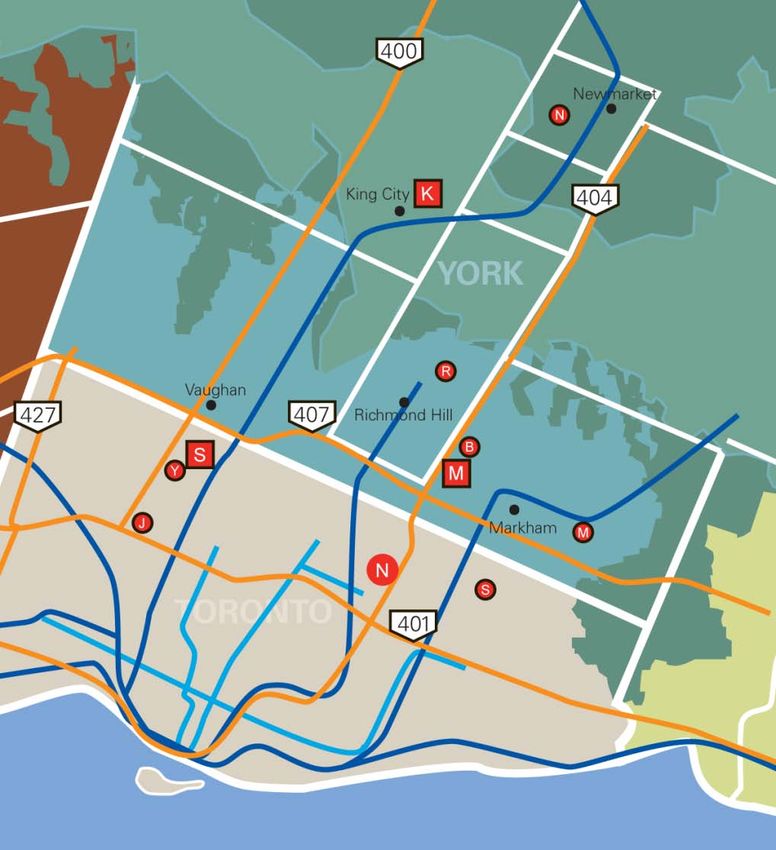
Seneca’s footprint:
Seneca’s has 11 locations in the Greater Toronto Area (GTA)—five in Toronto and six in York
Region. Within these boundaries, the College is a concerned and engaged stakeholder in the
actions and directions of the municipal governments and communities in Toronto, Markham,
King, Newmarket, Richmond Hill and Vaughan, as well as the regional government in York.

In the GTA, five colleges and three universities provide varying levels of applied training and
skills development, research facilities, apprenticeships and career development opportunities to
meet diverse workforce needs. It is a competitive, yet differentiated landscape (In depth profiles
of GTA postsecondary institutions are on pp. 24-31).

Geographically and strategically, Seneca is well-positioned to provide the postsecondary
educational opportunities, training, research and partnerships necessary to meet the needs of
students, businesses and other community stakeholders to succeed in a very competitive
economic environment. This is especially the case in the growing, diverse population of York
Region.

Fig.1: Seneca’s placement in the GTA

                                                                                                5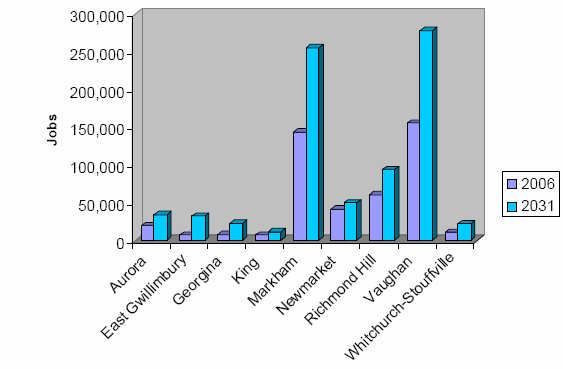
Greater Toronto is the fastest growing area in Ontario, with an expected population of 8.3
million by 2030, or more than half of Ontario’s population. The largest proportion of the
province’s current population (six million people) lives in the GTA (46.8 per cent). By 2031, the
age-18-to-21 population in the GTA is expected to grow by about 69,000 individuals over 2007
levels.

The importance of the GTA to the provincial and national economy is clear. In fact, the GTA is
an important cluster in the North American economy. Together with other regional centres, the
GTA mirrors what Richard Florida et al. (2007), refer to as a “Mega Region,” or “polycentric
agglomeration of cities and their low-density hinterlands.” These regions “represent new, natural,
economic units that emerge as metropolitan regions that not only grow upward and become
denser, but grow outward into one another (6).” 1 This “Tor-Buff-chester” Mega Region is the
fifth largest grouping of people in North America.
Fig.2: North America “Mega Regions”

Within the GTA, York is the fastest growing region and accounts for approximately 16 per cent
of the GTA’s population, which is projected to increase to 1.28 million by 2028. Nearly eight of
every 10 immigrants to Ontario and four of every 10 immigrants to Canada settled in the GTA.
Immigrants now comprise 50 per cent of the population in Toronto and 56.5 per cent in
Markham.

1
 Florida, Richard et al. (2007). “The Rise of the Mega Region.” The Martin Prosperity Institute. University of
Toronto.

                                                                                                                 6
Fig.3: Regional growth rates in Ontario 1995-2007
1995 2007 Change Growth rate
Central (GTA) 482,423 610,734 128,311 26.6 per cent
East 166,826 185,259 18,433 11.0 per cent
West 311,216 346,227 35,011 11.2 per cent
Northern 84,901 77,747 -7,154 -8.4 per cent
Ontario 1,045,366 1,219,967 174,601 16.7 per cent
Source: MTCU
Toronto
Canada’s largest city is not immune to the fiscal hardships and infrastructure concerns being
experienced in areas across the country. Toronto faces a $500 million structural budget shortfall,
and although amalgamation
has created Toronto the Fig.4: Future “Metrolinx” transit in GTA
“megacity,” many of its parts
operate with their own
agendas, especially in the areas
of planning.
Toronto will encounter change
on many levels in the coming
years. In November 2010, the
city will elect a new mayor,
while starting preparations for
the 2015 Pan Am games. It
will also continue numerous
capital infrastructure projects
to reinvest in geographic areas,
including the Downtown; the
Central Waterfront; North
York; Scarborough, Etobicoke,
large brownfields and
greenfields.
Toronto will also look to
tackle the problems of poverty
(a priority is its
“Neighbourhood Strategy”);
congestion; environmental
sustainability; affordable
housing; preserving green
areas; investing in arts and
culture; creating a positive
7environment for development and public transit. Public transit poses a mutual concern for
Toronto and its neighbors in Peel and York regions and is one the primary infrastructure
priorities for all three, illustrated by the ongoing joint “Metrolinx” project. A provincially
legislated agency, Metrolinx is mandated to develop an integrated, multi-modal transportation
network that will improve travel from York and Durham, through Toronto, Peel, Halton and to
Hamilton, over the next 25-30 years.
Accessible public transit, connecting Toronto with the municipalities in Peel and the Region of
York will be crucial in battling congestion, carbon emissions and providing students and
residents an efficient, affordable alternative for getting to work or classes. These future transit
developments also have the potential to make Seneca campuses more accessible to a wider
population base.
York Region
York Region includes the municipalities of Markham, Newmarket, Richmond Hill, Georgina,
King, Aurora, and Whitchurch-Stouffville.
At the regional level, these municipalities have collaborated to develop “Vision 2026:” a long
term plan for the attraction and retention of residents through accessible transportation options; a
vibrant economy; responsive human services; housing choices; and balanced growth.
Fig.5: Current York Region population, by municipality
Within the Region, each
municipality has also
established priorities for
growth, development and
sustainability, with the
common goals to battle traffic
congestion; enhance public
transit, and develop housing
options, while maintaining
“small town” histories.
Specifically, in the Town of
Markham (where Seneca
houses its newest campus),
the Council has approved
“Markham 2020,” a blueprint
that targets four key sectors
of opportunity: convergence
of information and
communications technology
and life sciences;
information, entertainment and cultural industries; professional, scientific and technical services;
and finance and insurance. Markham’s priorities align well with Seneca’s programming depth
and strengths, specifically in financial services and information technology. Most of the
8employment growth in York Region is occurring in the southern municipalities, like Markham,
along with Richmond Hill and Vaughan.
Fig.6: Employment by municipality, 2006/2031
Source: York Region
Relative to the GTA and Canada, York Region is young. Those aged 38 to 57 make up 32.5 per
cent of the population, in comparison to 30.2 per cent in the GTA and 30.7 per cent nationally. In
the GTA about 70 per cent of the growth in the age-18-to-21-population is projected to occur in
York and Peel regions. Overall population growth in York and Peel regions is projected to be 1.3
million people over that same period. Demographics and geography favour Seneca dramatically,
as Seneca attracts students from York Region and Toronto in almost equal numbers.
9Fig.7: Seneca domestic enrollment, by municipality, fall 2009
Source: Registrations Office, Seneca
As the many young people in York Region, and the wider GTA, look to enter the workforce,
they will be part of a larger, increasingly international and extremely competitive Ontario
population that will be well educated and experienced. A postsecondary credential will be
viewed as a requirement, as will continual training and skills upgrading.
10Provincial government synopsis:
The Ontario government is the level of government with the most impact on colleges. Through
operating grants, other special purpose funding, and the controls the government places on
tuition, the province controls or influences over 75 per cent of college revenues. Despite
increases in recent years, provincial government funding has not kept pace with the rate of
inflation or system growth. This situation is not likely to change in the near future, as the
economy will be the overarching priority for the McGuinty government in the months ahead.
Fig.8: Enrollment and revenue changes 1995-2010
Ontario, given its reliance on the manufacturing sector, was impacted by the softening economy
in the United States, even before the recession was felt by other jurisdictions. In early 2008, it
was announced that Ontario had become a “have not” province for the first time in its history,
entitling the province to equalization payments from the federal government.
The province announced that the deficit for 2008-2009 (fiscal year ending March 31, 2009) was
$6.4 billion, instead of the $3.9 billion that had been predicted in the March Provincial Budget.
This deficit follows three consecutive years of balanced budgets. The Fall Economic Statement
conceded a deficit of $24.7 billion for 2009-2010.
In the midst of the economic woes, the government is facing the implementation of a harmonized
GST and PST. The government positioned the tax as a modernization, supportive of business
investment. Instead it has raised the ire of many small business owners, as well as rank and file
Ontarians. (Items that were excluded from PST will now be taxed under the harmonized tax.)
Government caucus members have been feeling the heat on the harmonized tax from
constituents, which has led to some tough discussions between MPPs, the premier and Cabinet.
11The harmonized tax issue is seen as the biggest vulnerability to the government and will remain a
focus by the opposition parties leading up to the next election in October 2011. Now that the
McGuinty government has passed the halfway point in its mandate, its attention will increasingly
move towards that election milestone. Key priorities that still need to be implemented include the
move to full-day kindergarten and meeting the targets of the poverty reduction strategy. Both
these decisions are costly at a time when all government spending is under a microscope. The
accountability dramas at eHealth, OLG and other ministries have eroded the government’s
credibility as good fiscal managers and stewards of the province, and it will look to regain some
lost ground in this regard.
For postsecondary education, the government is faced with the end of its “Reaching Higher”
plan. This means that multi-year funding arrangements and the current tuition framework need to
be replaced. The government is currently considering what it will do for a follow-up to Reaching
Higher. Increasing access to postsecondary education, improving quality and student success
remain priorities for the government, and it recognizes the growth pressures specific to the GTA.
However, given the significant economic pressures, the McGuinty Government faces, Reaching
Higher’s successor will likely be high on lofty goals but without the huge a boost to funding that
was a central figure of Reaching Higher. Colleges have been told that all these announcements
will be wrapped together with the provincial budget that is expected in mid-March. Until the
March budget is delivered, it is very difficult for Seneca to produce long-term projections.
Colleges and universities will be looking closely for clarity in the government’s direction to be
able to start planning for the future.
For the upcoming budget, the government will need to consider some difficult options, including
tax increases; lobbying for increased federal transfer payments; targeted program cuts; and other
government expenditure reductions. With tax increases unlikely (given the looming election) and
the federal government’s inability to provide significant increases in transfer payments (due to its
own fiscal constraints), there will be a focus on other cost containment measures.
The government is quite aware of the impact of public sector wage costs on its attempts to
contain transfers to crown and public agencies and is paying attention to wage settlements in
municipalities, and the university/college, school and hospital sectors. While the government is
likely going to provide sustained support for education and health care, it does not want to see
programs and services eroded at the cost of public sector wage increases. The government will
also look to increase accountability by reporting on the outcomes of its investments.
12Federal government synopsis:
The federal government is an indirect partner in terms of postsecondary education as the
constitution states that education is a provincial responsibility. Other that providing transfer
payments to the province, the federal government has made targeted investments in PSE,
focusing on providing research funding and funding for some student assistance.
Like at the provincial level, the number one priority for the federal government continues to be
the Canadian economy. A ten-minister cabinet shuffle took place January 19, while talk of an
election in 2010 continues, in an environment where each of the political parties has not been
able to break out of static levels of support. As the prime minister faces criticism for the second
prorogation of parliament in less than a year and questions about the treatment of detainees in
Afghanistan, his government will do its best to promote the benefits of the Economic Action
Plan, and the projects it has funded. The Harper government will also hope that the focus of the
public attention will shift to February’s Winter Olympic Games in Vancouver.
In early March 2010, the next Federal Budget will be introduced, with fiscal austerity as the
theme. It is expected that while there will be no increases in transfer payments to the provinces
with the funding flat lined. The tightening of the purse is in direct contrast to the budget in
January 2009, which included the $62 billion “Economic Action Plan,” a broad stimulus package
for infrastructure renewal. The Plan provided “Knowledge Infrastructure Program (KIP)”
funding for colleges and universities, done jointly with provincial and territorial counterparts.
This initiative represented an extraordinary, one-time foray into capital investment at the federal
level. All told, the federal government will spend $2 billion on 450 projects at colleges and
universities.
The federal government has also focused on many other issues that have impacted postsecondary
education and training such as stimulating the workforce by extending employment insurance
benefits, expanding training programs, providing grants for apprentices and promoting work
sharing. There has also been a push to expand graduate student internships.
Other PSE-related issues at the federal level include the winding down of funding for the
Canadian Millennium Scholarship Foundation (December 31, 2009) and the Canadian Council
on Learning (July 6, 2010). The government’s review of student financial assistance found that
the Foundation had limited success in encouraging more people to go to college or university and
did not provide students with predictable funding from one year to the next.
With the announced conclusion of these programs, the 2008 Federal Budget introduced new
student financial assistance programs through the “Advantage Canada” initiative. This includes
$350 million investment in 2009-10 and $430 million in 2012-13 for a new, consolidated Canada
Student Grant Program; $123 million over four years to streamline the Canada Student Loans
Program; increasing limits on the Registered Education Savings Plan; and textbook tax credits.
Federal assistance for newcomers joining the Canadian labour force comes from Citizenship and
Immigration Canada (CIC), which runs a series of programs, administered locally, with complex
eligibility and delivery requirements. CIC funds represent “flow through” funding for
13institutions, like Seneca, who are considered a “service provider organization” (not a PSE
organization) with regard to this funding.
While the government’s focus remains on stimulating the economy, it is in Ontario colleges’
interest to continue to monitor federal agencies’ calls for funding proposals in the areas of
applied research (specifically concerning Industry Canada priorities like science and
technology), employment and training program development and newcomer integration.
Postsecondary education in Ontario:
Ontario is an educated province. In 2007, the province had Canada’s second-highest PSE
attainment rate (67 per cent of the population, aged 25 to 44) and the nation’s highest proportion
of degree holders (22 per cent with bachelor’s degrees, 31 per cent including all university
degrees). 2 Conservative estimates suggest that, by 2020, there will be an additional 78,000
undergraduate enrolments in Ontario, representing a 22 per cent increase over 2004-2005.
Fig.9: Projected PSE demand in Ontario, 1996-2034
2
However, the province is seventh in the proportion of diploma or certificate holders (36 per cent): This may be
attributable to the high number of skilled immigrants in Ontario with degrees.
14Source: MTCU/MEI Long Term Capital Planning Project, Courtyard Group, Toronto
Each year, approximately 500,000 students are served by Ontario’s colleges: 200,000 full-time
and 300,000 in continuing education. Almost 60 per cent of new entrants to PSE in Ontario
enroll at a college. Furthermore, most of the province’s 15-to-24-year-old population is located
in the GTA, which will be the primary source of these additional students, with numbers
reaching 82,000 by 2021. Along with providing opportunities for young students, colleges must
attract more mature students. Strategies will include: Second Career, more frequent intakes
continuous studies and more flexible learning alternatives.
Today’s college student in Ontario:
Colleges welcome students at all stages of their academic and professional careers; more than
one-third have previous PSE experience, and the majority of applicants come from outside
secondary school, with 40 per cent applying directly from high school. Currently, twenty per
cent of college applicants are over age 30.
15Fig.10: Ontario students’ pathway to college
Direct from high school
(38%)
Delayed after high school
(23%)
Complete PSE (19%)
Incomplete PSE (18%)
Less than high school (1%)
Other (1%)
Source: Colleges Ontario
In 2008, 73 per cent of students surveyed cited employment or career preparation as the main
goal for attending college. One third reported their “ultimate academic credential” was a degree,
with 18 per cent intending to pursue a university bachelor’s degree and 12 per cent looking to
attain a professional or graduate degree. For Seneca the numbers are even stronger. In 2008, 42.7
per cent of Seneca students surveyed expected to continue their educations at university.
As well, colleges offering options at various credential levels and/or joint programs with
universities tend to benefit from “repeat customers,” as the majority of graduates who pursued
further education either returned to their own colleges or enrolled at an Ontario university
(largest sector: applied arts, lowest, health). Seventeen per cent of graduates in 2006-07 returned
to college, while 82 per cent returned to their college of graduation.
16Fig. 11: After graduation, current Seneca students expect to:
80.0
70.0
60.0
50.0
40.0
30.0
20.0
10.0
0.0
1997 1998 1999 2000 2001 2002 2003 2004 2005 2006 2007 2008
enter university 24.0 26.7 30.8 32.5 37.0 38.7 40.5 39.9 41.1 43.9 44.1 42.7
enter a full time job 54.3 56.4 51.9 51.2 48.1 47.2 44.0 40.3 39.5 36.6 36.8 35.7
enter a Seneca degree 3.0
Fall CPT Background Questionnaire
Need for financial support:
College students continue to depend on financial assistance to achieve their academic and career
objectives.
In 2008, 23 per cent of surveyed college applicants reported a household income of less than
$30,000, and 52 per cent had incomes below $60,000. Seventy-one per cent of all applicants in
2008 were working at the time of their application (25 per cent full-time, 46 per cent part-time).
Financial accessibility is crucial for “first generation” PSE students as well. Currently, 36 per
cent of college applicants are those coming from a household where they are the first to attend a
PSE institution. Children of parents with no PSE are twice as likely to attend college as
university.
In 2008-09, 47 per cent of Seneca students received OSAP funding, a three per cent increase
from 2007-08 and eight per cent increase from 2006-07. As well, in 2008-09, Seneca assisted
7,604 students with bursary and scholarship funding.
Internationally trained professionals:
Colleges continue to be a necessary entry point for immigrants, whose first language is not
English—specifically internationally trained professionals. Fifty per cent of adults who recently
immigrated to Canada hold a university degree. However, many of these professionals’
17credentials need to be supplemented by Canadian PSE programs. Immigrant applicants to
Ontario’s colleges are more likely that Canadians to have a university degree, household incomes
under $30,000 and be older. In 2008, 17 per cent of surveyed college applicants were not born in
Canada. (This coincides with the 2006 census report, which noted that 19 per cent of 15-to-24-
year-old Ontarians was not born in Canada, as was 31 per cent of the population aged 25 to 44.)
These demographic trends illustrate the need for ongoing funding and programming catering to
internationally trained professionals, who require language training and credential
supplementation to draw upon their previously attained skills and knowledge and successfully
integrate into the Canadian workforce. Seneca’s geographic locations in one of Canada’s most
desirable regions for immigrants and strong program offerings in credential upgrading and
language studies makes it a key resource for Canada’s growing number of newcomers.
Graduate outcomes:
In 2007-08, the overall graduation rate for college students in Ontario was 64.9 per cent.
Currently, Seneca’s graduation rate is below the provincial average.
Fig.12: Seneca graduation rates 2003-2008
Measurement year Number of entrants Number of graduates Graduation rate
2007-2008 8,489 4,736 55.8 per cent
2006-2007 8,466 4,549 53.7 per cent
2005-2006 8,354 4,469 53.5 per cent
2004-2005 7,651 4.083 53.4 per cent
2003-2004 7,390 3,825 51.8 per cent
Source: Seneca College
In Ontario, graduates in preparatory health sciences, general arts and sciences and art
fundamentals were most likely to further their educations at a college, while those studying
general arts and sciences, preparatory health sciences, ECE and business admin were most likely
for further their education at university. Higher credentials lead to higher entry level salaries for
graduates.
Fig.13: Earnings (six months after graduation):*
Credential Annual income
One-year graduate certificate program $38,971
Degree $37,663
Advanced diploma $32,606
Diploma $32,606
Certificate $30,303
*The highest average and median annual earnings were for males, employed in the health sector ($45,842 and
$46,464), and the lowest was for females in applied arts ($30,151 and $29,200).
Source: Colleges Ontario
18Ontario’s economy and the future workforce, provincially and locally
Fig. 14: Distribution of 2006-07 Seneca graduates, by major occupational category
Professional, Scientific & Technical Services 17%
11%
Retail Trade 14%
12%
Health Care & Social Assistance 14%
23%
Finance & Insurance 8%
4%
Manufacturing 7%
8%
Admin. & Support, Waste Mgmt & Remed. Services 6%
6%
Information & Cultural Industries 6%
4%
Educational Services 3%
4%
Transportation & Warehousing 3%
2%
Accommodation & Food Services 5% Seneca All Colleges
8%
Public Administration 3%
3%
Wholesale Trade 3%
2%
Arts, Entertainment & Recreation 3%
3%
Construction 4%
6%
Real Estate & Rental & Leasing 2%
1%
Other Services 3%
3%
Mining & Oil & Gas Extraction 1%
Utilities 1%
Source: KPI Grouping by sector based on North American Industry Classification System
Today’s college graduates are joining a workforce that is beginning to grow for the first time
since the economic downturn of 2008. Ontario’s unemployment rate for September 2009 was 9.2
per cent, slightly higher than the August 2009 rate of 9.4 per cent. The Canadian average for
September 2009 was 8.4 per cent.
Economists and other experts are mixed in their prognosis of Ontario’s economic recovery at this
stage. However, given Ontario’s reliance on manufacturing and exports, and the sluggish U.S.
economy, coupled with a high Canadian dollar, it is anticipated that short-term economic
recovery will lag other jurisdictions in Canada and globally.
An Overview by Industry Canada (November 2009) highlights some of Ontario’s leading
industries, including biotechnology, information and communication technology, finance and
administration, tourism and retail, advanced manufacturing, emerging green technology and
wholesale trade. As these industries continue to recover from the economic downturn, providing
much of the province’s GDP and employment destinations, colleges would be wise to examine
program and credential development to increase demand for graduates and meet employment and
training needs.
19Fig.15: Employment growth by industry, November 2009
Information and communication tech (2.5%)
finance and insurance (2.9%)
construction (5%)
Accomodation and food service (4.4%)
retail trade (3.9%)
Source: Industry Canada
Current key industry drivers and trends, identified by Industry Canada and HRSDC:
Ontario is the leading region in the pharmaceutical and biotechnology industry and home to more than half of
the brand-name pharmaceutical companies in Canada, with the largest regional concentration of
biotechnology firms in North America.
The Conference Board of Canada forecasts a shortfall of 364,000 workers by 2025. One of every three job
openings will be the result of retirements, impacting most sectors of the economy.
HRSDC projects skill shortages at the national level in occupations such as:
physicians; nurses; pharmacists; medical technicians and technologists, and assisting occupations;
management occupations; occupations related to the oil and gas sector; some trades, especially construction
related; some information technology occupations such as computer engineers and software engineers.
Ontario accounts for about 50 per cent of the country’s information and communication technology firms and
revenue, as well as about half of national ICT employment and GDP.
In order to remain globally competitive, Ontario’s ICT sector will need to address some major challenges,
namely the attraction and retention of talent, the need to increase R&D produced by Ontario ICT firms and
universities, as well as the need to address declining enrollment in computer science at Ontario’s universities.
Financial services sector employs roughly 350,000 people in Ontario and accounts for 7.7 per cent of
Ontario’s total GDP.
About 230,000 in the sector are employed in Toronto, making the city the third largest financial sector in
North America behind New York and Chicago.
The Ontario Ministry of Tourism is forecasting a recovery in the tourism industry in 2010. The total number
of visitors (domestic and international) is expected to grow in the range of 1.3 per cent to 1.8 per cent
annually between 2010 and 2013, after experiencing a 2.6 per cent decrease in 2009.
The Pan Am games are expected to bring 10,000 participants and 250,000 visitors to Toronto and create
15,000 new jobs, primarily in tourism and construction.
Ontario’s retail and wholesale trade sector accounted for 11.8 per cent of the provinces total output and 17.3
per cent of employment in the Q2 of 2009. This translates to 660,000 jobs and $28 billion in GDP.
20The workforces in Toronto and York Region:
The workforces in Toronto and York Region are highly educated with immigrant and domestic
workers. In 2006, 63.3 percent of the labour force in Toronto had completed a postsecondary
education. In York, of adults between the ages of 25 to 64, 61.2 per cent have postsecondary
education – higher than both the federal and provincial averages. In the years to come, both
Toronto and York will need these educated employees.
Toronto’s workforce continues to grow steadily. The City’s overall employment in 2008 was 1.3
million, up by 0.8 per cent or 10,600 jobs from 2007. This represents the fifth consecutive year
of growth. Full-time employment has continued to stay above the 1 million mark for the third
year, growing to 1.02 million. This is an increase of 4,400 full-time employees and a growth of
6,200 part-time employees from 2007 to 285,400.
Currently, the largest share of jobs is found in the office sector (46.7 per cent), followed by the
institutional (16.4 per cent), retail (11.3 per cent), manufacturing (10.9 per cent) and service
(11.4 percent). These numbers reflect the diverse nature of the Toronto economy.
York Region continues to add between 15,000 and 20,000 jobs each year. At year end 2006,
there were approximately 460,000 jobs in the Region. By 2011, York Region’s job numbers are
expected to increase to 540,000, 696,000 in 2026 and 780,000 by 2031.
Of the approximately 81,500 new jobs in the Region, the largest increases were in management
(22.3 per cent), business, finance and administration (17 per cent) and natural and applied
sciences and related occupations (15.3 per cent). Seneca alumni are helping to fill these
positions, as 75 per cent of graduates on file have taken permanent residences in Toronto and
York Region.
Fig. 16: Permanent residence for Seneca alumni on record
Geographic region of residence Percentage of alumni
City of Toronto 49.7
York Region 25.12
Peel Region 6.94
Durham Region 4.76
South Central Ontario 3.86
Southwestern Ontario 3.55
Halton Region 1.40
Other 4.67
Source: Seneca College
With substantial job growth, like that in Toronto and York Region, comes the necessity of
having enough qualified personnel to meet demands. This is a concern in the GTA and
nationally. GTA colleges’ and universities’ roles will be compounded as providers of PSE
credentials for a wide demographic of students, as well as training providers for those already in
the workforce looking to upgrade their skills and research partnerships for SMEs and other
industry partners. Each GTA institution brings specific strengths and foci to these stakeholders.
21Seneca College: current dynamics
Overview:
Seneca’s present enrollment is 20,029 full-time students and 70,000 continuing education
registrations. This includes 2,732 full-time international students (not including Seneca Corp or
international students with less than a 66 per cent course load). Seneca welcomes students at
various stages of their academic and professional careers. Students have access to more than 500
career options, as well as 200 degree transfer options, with 64 universities in Canada, Australia,
England, South Africa and the USA
The College’s ever-expanding choice of pathways now includes graduate certificates, bachelor’s
degrees, advanced diplomas, diplomas, certificates and joint programs with York, the University
of Toronto and Trent University.
Seneca credentials, by program number and enrollment (fall, 2009)
Graduate certificate Graduate
(28) certificate (462)
Degree (12) Degree (466)
Advanced diploma Advanced diploma
(37) (1,710)
Diploma (79) Diploma (3,887)
Certificate (28) Certificate (1,011)
Seneca also offers newcomer bridging with training and re-employment services for
internationally trained professionals, as well as upgrading for college eligibility. These diverse
options allow Seneca to achieve its overall mission to provide accessibility to quality programs,
services and experiences that ensure students are career-ready upon graduation.
It its 42-year history, it is estimated that more than 1 million people have pursued learning at
Seneca.
Campuses and programs:
Newnham: (650,000 sq. ft., 51 acres), population (full-time): 10,330
Program areas: business; accounting; building systems; civil engineering; esthetics; event
management; fashion; financial services; fire protection; floral design, human resources; legal
studies; liberal arts; opticianry; and real property administration.
Seneca@York: (Stephen E. Quinlan Building: 270,000 sq. ft. TEL Building: 170,000 sq. ft.),
population (full-time): 4,741
22Seneca@York Program areas: 3D animation; bioinformatics; biotechnology; broadcasting;
chemical laboratory studies; computer studies; corporate communications; creative advertising;
graphic design; digital photography; music production; informatics and security; journalism;
pharmaceutical regulatory affairs; and quality operations.
King Campus: (700 acres – Garriock Hall: 122,000 sq. ft., Modular building: 12,000 sq. ft. and
Animal Health Facility: 26,000 sq. ft.), population (full-time): 3,347
Program areas: emergency services communications; early childhood education; forensic
investigative studies; golf course technician; nursing; police foundations; recreation; social
service; underwater skills; and veterinary technology.
Markham Campus: (27 acres, 256,053 sq. ft. building), population (full time): 1,487
Program areas: brand management; business administration; marketing; tourism and travel; and
hotel and restaurant management.
Specialized campuses:
Buttonville Airport: a fleet of 14 planes, Bachelor of Applied Technology, Flight
Jane Campus: mechanical techniques and mechanical engineering technician.
Yorkgate: skills assessment; training and career counselling; assistance with job placement; and
links to local services and referral agencies.
The College also has four community campuses in Markham, Newmarket, Richmond Hill
and Scarborough. These satellite locations provide a variety of programs and resources for new
Canadians, job seekers and fledgling entrepreneurs.
23You can also read