SGX-REITAS Education Series - ESR-REIT
←
→
Page content transcription
If your browser does not render page correctly, please read the page content below
SGX-REITAS Education Series
  23 February 2016

16 International Business Park
Executive Summary
Singapore Industrial Real Estate
Sector Overview
Role of Regulators in the Industrial Sector
Overview of Industrial S-REITs
Overview of CIT
2
Singapore Industrial Real Estate Sector Overview
Macro-Economic Outlook
Economic Performance in 2015
Singapore economy grew modestly by 2.1% in 2015
Inflation declined 0.5%
Global economy was buoyed by stronger-than-expected economic growth in
the US
On the other hand, Eurozone’s economy remained lacklustre together with a
slowdown in China’s economy
Economic Outlook for 2016
MTI expects Singapore’s economy to grow by 1.0% to 3.0%
Economic growth is expected to come from domestically-oriented sectors such as
business services sector
Inflation is expected to stay between -0.5% to 0.5%
Subdued global economic conditions and prolonged weakness in commodity prices
are expected to continue to weigh on the manufacturing sector
Source: DTZ Consulting and Research, February 2016
4
Factory Property Market
Supply of Factory Space
Approx. 19.8m sq ft (NLA) of private
factory space will be completed
between 2016 and 2018
This is significantly below the 10 year
average annual supply of 9.7m sq ft
7.9m sq ft of private factory space are
multiple user factories
Out of which 6.9m sq ft (89%) are strata-
titled for sale, with units less than 5,000
sq ft
These segments however are not
direct competition for CIT’s leasing
strategy
Source: DTZ Consulting and Research, February 2016
5
Warehouse Property Market
Supply of Warehouse Space
Approx. 13.7m sq ft (NLA) of private
warehouse space is in pipeline
between 2016 to 2018
This is higher than the 10 year average
annual supply of 3.1m sq ft
10.4m sq ft of pipeline supply is
predominantly single user warehouse
This includes facilities developed by major
logistics players
E-commerce segment gaining traction
Players are moving towards online and offline
retail experiences allowing potential opportunities
of the warehousing sector in Singapore
Source: DTZ Consulting and Research, February 2016
6
Role of the Regulators in the Industrial Sector

511/513 Yishun Industrial Park A

Role of JTC / HDB

JTC
• Lead agency to spearhead the planning, promotion and development of
  Singapore’s industrial landscape
• Developed over 7,000 hectares of industrial land and 4 million m2 of ready-
  built facilities
• Key iconic projects – Jurong Island, Airport Logistics Park of Singapore,
  International and Changi Business Parks, Seletar Aerospace Park,
  CleanTech Park, Tuas Biomedical Park, one-North, Biopolis, Fusionopolis
  and Mediapolis

HDB
• Main role – public housing authority with a minor role of administering
  industrial properties located within public housing estates
• Caters to SME clientele
• Manages close to 12,000 industrial properties island-wide, including
  workshops, warehouses and factories

                                                                                8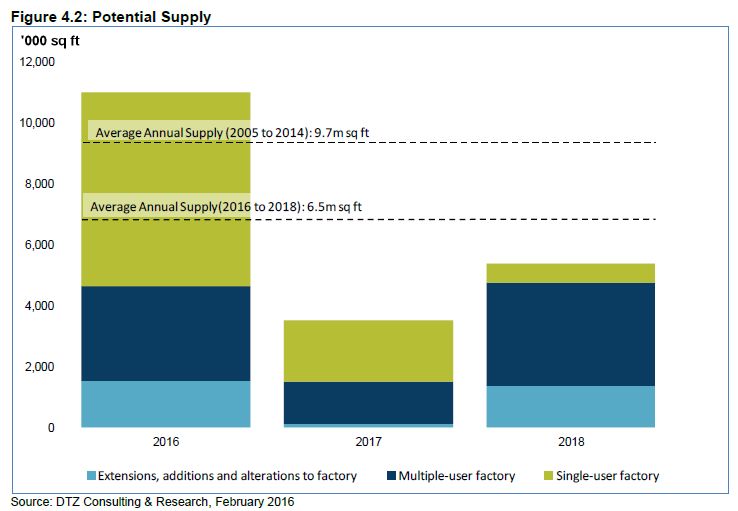
Recent Changes to Policies Implemented by JTC / HDB

• Minimum of 70% of the total Gross Floor Area needs to be occupied by
  approved anchor tenant(s)

• Approved anchor tenants need to satisfy JTC’s assessment of amongst
  others:
    • Value-added to the economy
    • Remuneration per worker
    • skilled workers profile

• Each anchor tenant has to occupy at least 1,000sqm

                                                                         9
Overview on Industrial S-REITs

3 Pioneer Sector 3

                                      10
Industrial S-REITs’ Features
Bond-like listed security (“Dividend Play”) that provide steady income
distribution stream to investors in addition to upside potential of capital gains
SGX listing ensures liquidity of investment
Most industrial S-REITs (including CIT) are Central Provident Fund
Investment Scheme approved which allows a wider pool of investors to
participate
Industrial properties in REIT portfolios are professionally managed by REIT
Managers
Portfolio diversification
Industrial Real estate exposure with minimal capital outlay
11Industrial S-REIT Sector Overview
Sector Industrial
• Business Parks
• Factories
Asset Class
• Warehouses
• Business park – focused
Categories of • Logistics – focused
Industrial
REITs • General industrial – focused
• Global economic conditions
Key Influence • Performance of the Singapore industrial sector
Factors • Regional performance of the logistics sector
• AIMS AMP Capital Industrial REIT • Mapletree Logistics Trust
• Ascendas REIT • Sabana REIT
Counters • Cache Logistics Trust • Soilbuild REIT
• Cambridge Industrial Trust • Viva Industrial Trust
• Mapletree Industrial Trust
12S-REIT yields against other market instruments
10
8.3 8.2
7.4
% yield per annum
5
2.5 2.2
0
CIT FY2015 Yield ⁽¹⁾ Industrial S-REITs S-REITs Yield ⁽²⁾ CPF Ordinary Singapore
Yield ⁽²⁾ Account ⁽³⁾ Government 10-
Year Bond ⁽⁴⁾
(1) Based on closing price of S$0.565 as at 31 December 2015 and Full Year DPU of 4.793 cents
(2) Based on S-REIT Tracker published by OCBC on 4 January 2016
(3) Prevailing CPF Ordinary Account interest rate from 1 Oct 2015 to 31 Dec 2015
(4) Based on MAS website (https://secure.sgs.gov.sg/fdanet/SgsBenchmarkIssuePrices.aspx)
13CIT FY2015
Overview of Cambridge
Results Industrial TrustOverview of CIT
Introduction
Singapore’s first independent industrial REIT
Listed on 25th July 2006
Well diversified industrial properties in Singapore
Portfolio ranging from logistics, warehouse, light industrial, business
parks, car showroom and workshop
Credit Rating of Baa3 by Moody’s
Stable rating that is reaffirmed annually
Financials
Gross Revenue of S$112.2 million
13.0 % increase year-on-year
Net Property Income of S$86.2 million
10.7 % increase year-on-year
Distribution Per Unit of 4.793 cents achieved for FY2015
4.2% decrease year-on-year
15
3Overview of CIT
IPO in July 2006
Current Market Cap ~S$733 million
51 Properties
~8.5 million sq ft GFA
~S$1.42 billion Property Value
8.8 months of Security Deposits
~94.3% Occupancy Rate
Changi
International Airport
Jurong Port
Pasir Panjang Terminal
Logistics General Industrial
Keppel Terminal
Warehouse Car Showroom & Workshop
Data as at 31 December 2015 Light Industrial Business Park
16Diversified Portfolio
Car Showroom
Business Park,
and Workshop, Asset Class by Rental Income
1.7%
3.0%
General Logistics, 15.8% 2015 2014
Industrial, 30.3%
No of Properties 51 50
Property Value (S$ billion) 1.42 1.37
Total Portfolio GFA (million sq ft) ~8.5 ~8.4
Total Net Lettable Area (million sq ft) ~8.0 ~7.9
Warehousing, Portfolio Occupancy (%) 94.3* 96.0
Light Industrial, 21.1%
28.1% Total no. of Tenants 187 168
* Note that 513 Yishun will be undergoing AEI works. Excluding 513 Yishun, the portfolio occupancy would be 94.8%
Single-Tenanted vs Multi-Tenanted (By Rental Income)
Single Tenanted
Properties, 48.3%
Renewed approximately 306,000 sq ft of leases in 4Q2015, amounting to
1.02 million sq ft of leases for FY2015
Multi-Tenanted
Properties, 51.7%
17Diversified Tenant Base and Trade Sector
By Gross Revenue
Tenant Classification (Sub Sectors)
Wholesale of Household Goods, Textiles, Furniture & Furnishing and Others
Computer, Electronic and Optical Products
Logistics Tenant Classification
Main Trade Sectors
General storage
Other
Services, Precision Engineering, 3.0%
Fabricated Metal Products
3.4%
Construction, 4.2%
Wholesale of Industrial, Construction and IT Related Machinery and
Equipment
Others
Professional,
Scientific and Wholesale,
Specialised storage Techinical Retail Trade
Activities, Services and
Civil & Engineering Services 10.8% Others, 27.6%
Architectural and Engineering Activities and Related Technical Consultancy
Manufacturing,
25.4%
Car Distribution Transportation
and Storage,
Other Services 25.6%
Paper and Paper Products
Machinery and Equipment
Precision Engineering
0% 5% 10% 15%
18Proactive Lease Management
Weighted Average Lease Expiry (WALE) remains steady at 3.8 years
By Rental Income
• 2 properties are expected to be divested
• 4 properties are expected to be renewed / new lease
• 1 property is expected to be converted into a multi-tenanted building
• 1 property is expected to go through some improvement works
30.0%
25.0%
20.0%
9.2%
15.0% 2.6%
13.4%
9.3%
6.4%
10.0%
13.0%
12.9%
(8 10.5%
5.0% properties)
7.1% 7.9% 7.7%
0.0%
2016 2017 2018 2019 2020 2021 +
Single-Tenanted Multi-Tenanted
As at 31 December 2015
19Quality and Diversified Tenant Base
Top 10 Tenants Account for ~37.3% of Top 10 Tenants Account for ~35.1% of
Rental Income Rental Income
31 December 2015
31 December 2014 10.0%
9.0%
8.0%
6.7%
7.0%
6.0% 5.0% 5.0%
5.0%
3.8%
4.0% 3.3% 3.0%
3.0% 2.3% 2.0% 2.0% 2.0%
2.0%
1.0%
0.0%
20Portfolio Occupancy Levels by Asset Class
Healthy portfolio occupancy compared to industry average
CIT Portfolio Occupancy CIT Portfolio Average:
100.0% 100.0%
97.1%
100.0% 100.0% 100.0% 100.0% 100.0% 100.0% 100.0% 94.3%
100.0% 96.2%96.5%
91.4% 91.3% 92.5% 94.8%
87.9% 89.2%
90.0%
88.1%
80.0% 74.0% JTC Industrial
70.0%
69.2%
Average: 90.8%
60.0%
50.0%
40.0%
30.0%
20.0%
10.0%
0.0%
Logistics Warehousing Light Industrial General Industrial Car Showroom and Business Park TOTAL
Workshop
STBs MTBs TOTAL
As at 31 Dec 2015
Reflects the occupancy level if we exclude 513 Yishun that will be undergoing AEI works
21Portfolio Rent and Rental Reversion
Portfolio Rents (Based on Leased Area Per Month Per Sq Ft)
$1.60
$1.45
$1.40
$1.27
$1.20 $1.12
$1.00
$0.80
$0.60
$0.40
$0.20
$0.00
STBs MTBs TOTAL
1,024,681 sq ft renewed in FY2015: : Positive rental reversion of 9.1%
As at 31 December 2015
22Diversified Debt Maturity Profile
Well-staggered debt maturity profile, with no refinancing due till FY2017
Available RCF of S$36.5m provides CIT with financial flexibility
300
S$ Mil
200
100
155 160
113.5
100
0
2016 2017 2018 2019 2020
MTNs Secured Term Loans Unsecured Term Loan
23FY2015 Capital Management Activities Summary
• In January, completed a S$55m secondary issuance of MTN Series 003. The issuance was 1.4x
subscribed and institutional investors took 99% of the issuance
• In May, S&P assigned “BBB-“ investment grade rating on CIT’s MTN programme and all its
outstanding MTN series
• In May, priced S$130 million 5-year MTN @ 3.95%. Issuance was more than 2x subscribed and
institutional investors took 91% of the issuance
• In June, completed the refinancing of the S$250m Club Loan Facility, using the using proceeds
from MTN and a new unsecured bilateral loan facility
• In November, CITM is recognised as the Highly Commended Winner for Best Financing Solution at
the Adam Smith Asia Awards 2015, organised by Treasury Today Asia
24Important Notice
This material shall be read in conjunction with CIT’s results announcements for the financial period ended 31 December 2015.
The value of units in CIT (“Units”) and the income derived from them may fall as well as rise. Units are not investments or deposits in, or
liabilities or obligations of, Cambridge Industrial Trust Management Limited ("Manager"), RBC Investor Services Trust Singapore Limited
(in its capacity as trustee of CIT) ("Trustee"), or any of their respective related corporations and affiliates (including but not limited to
National Australia Bank Limited, nabInvest Capital Partners Pty Ltd, or other members of the National Australia Bank group) and their
affiliates (individually and collectively "Affiliates"). An investment in Units is subject to equity investment risk, including the possible
delays in repayment and loss of income or the principal amount invested. Neither CIT, the Manager, the Trustee nor any of the Affiliates
guarantees the repayment of any principal amount invested, the performance of CIT, any particular rate of return from investing in CIT, or
any taxation consequences of an investment in CIT. Any indication of CIT performance returns is historical and cannot be relied on as an
indicator of future performance.
Investors have no right to request that the Manager redeem or purchase their Units while the Units are listed. It is intended that investors
may only deal in their Units through trading on Singapore Exchange Securities Trading Limited (the “SGX-ST”). Listing of the Units on
the SGX-ST does not guarantee a liquid market for the Units.
This presentation may contain forward-looking statements that involve assumptions, risks and uncertainties. Actual future performance,
outcomes and results may differ materially from those expressed in forward-looking statements as a result of a number of risks,
uncertainties and assumptions. Representative examples of these factors include (without limitation) general industry and economic
conditions, interest rate trends, cost of capital and capital availability, competition from similar developments, shifts in expected levels of
occupancy or property rental income, changes in operating expenses (including employee wages, benefits and training costs),
governmental and public policy changes and the continued availability of financing in amounts and on terms necessary to support future
CIT business. You are cautioned not to place undue reliance on these forward-looking statements, which are based on the Manager’s
current view of future events.
This presentation is for informational purposes only and does not have regard to your specific investment objectives, financial situation or
your particular needs. Any information contained in this presentation is not to be construed as investment or financial advice, and does
not constitute an offer or an invitation to invest in CIT or any investment or product of or to subscribe to any services offered by the
Manager, the Trustee or any of the Affiliates.
25Further Information
Ms. Elena Arabadjieva
Cambridge Industrial Trust Management Limited
61 Robinson Road, #12-01 Tel: (65) 6222 3339
Robinson Centre Fax: (65) 6827 9339
Singapore 068893 elena.arabadjieva@cambridgeitm.com
26You can also read