Shading and layout influence on flats energy performance of an apartment building
←
→
Page content transcription
If your browser does not render page correctly, please read the page content below
E3S Web of Conferences 197, 02013 (2020)                                 https://doi.org/10.1051/e3sconf/202019702013
75° National ATI Congress

       Shading and layout influence on flats energy
       performance of an apartment building
       Iole Nardi1,*, and Marialisa Sarcina2

       1 ENEA,    DUEE Department, 00123 via Anguillarese 301 Santa Maria di Galeria (Rome), Italy
       2   Via S.Dorotea, 75C, Scoppito (AQ), Italy

                      Abstract. Giving the need for environment protection and energy need
                      reduction, especially in the building sector, it is important to clearly
                      understand what influences, and to what extent, buildings’ energy
                      performance. In this work, an apartment building has been considered, and
                      the influence of shadings and of flats layout on the energy performance
                      ratings are evaluated. The case study is a building of the ‘90s, which has
                      been demolished and re-built (2016) according to the actual energy
                      requirements. For each of the 16 flats of the building, the energy certificate
                      has been retrieved in the two configurations: before and after reconstruction.
                      From the analysis of the specific energy consumption, and of their
                      components (i.e. energy need for ventilation, transmission losses, solar
                      gains), in the two configurations, a comparison amongst the flats has been
                      drawn. Results show that the apartment layout influences the solar gains, but
                      this influence (in percentage) is higher in the “ex-ante” configuration than
                      in the “ex-post”. Similarly, the energy gains are more relevant in the “ex-
                      post” configuration, in which some apartments, although having higher
                      dispersing surface, result to be more efficient due to their favourable
                      exposition.

       1 Introduction
       The growing attention to building energy consumption and related environmental impact has
       led to the increasing spread of knowledge concerning these two aspects.
       This, of course, demonstrates the interest to these issues, as also proven by the two common
       approaches followed: the top-down and the bottom-up.
           In fact, on one hand, laws, regulations, technical standards push the search and
       achievement of ever higher energy performances and ever lower energy losses, also with the
       introduction of the buildings’ energy label [1-2]. On the other hand, the final users are even
       more aware of the energy, environmental and economy effects of efficient housing [3-6].

       *
           Corresponding author: author@email.org

© The Authors, published by EDP Sciences. This is an open access article distributed under the terms of the Creative Commons
Attribution License 4.0 (http://creativecommons.org/licenses/by/4.0/).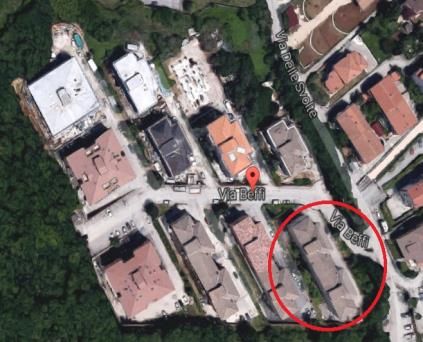
E3S Web of Conferences 197, 02013 (2020) https://doi.org/10.1051/e3sconf/202019702013
75° National ATI Congress
This, as foreseeable, has become also a driving force for the building sector, from the
construction management to the rental or sales services [7-10]. It is clear that, at equal prices,
the final user tends to be more attracted by the better energy label. However, the energy label
by itself can mislead the proper evaluation of a building or flat. In fact, this datum is
meaningless when not paired with the total energy consumption of the building itself [11]. In
this paper, such point is focused, demonstrating that, according to the Italian building energy
evaluation methodology, a better energy label does not directly imply a higher energy
efficiency.
To this aim, an apartment building has been considered. The structure, originally built in
the ‘90s, has been severely damaged by the L’Aquila earthquake of 2009, and, therefore, it
has been demolished and re-built in 2016, according the newest requirement at the time. The
energy certificate of the 16 flats of the building has been evaluated, both before and after the
reconstruction, according to the technical standards in law in 2016. This way has been chosen
to highlight the differences of the energy consumption and the modification on the energy
label and on the possible “ranking” of the flats. Finally, the differences have been studied in
light of considerations on the solar gains and on the transmission losses of each apartment,
also according to its exposure, thus evaluating the effect of the surrounding buildings and of
the solar path.
2 The case study
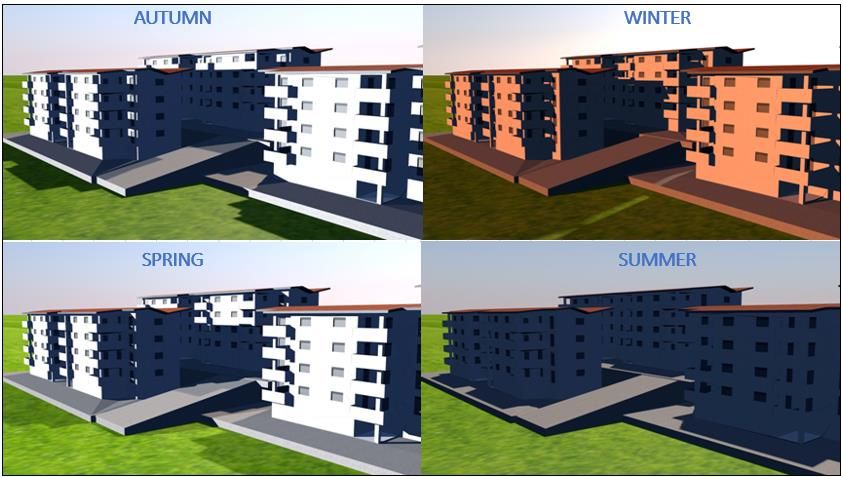
The selected building stands in the near outskirt of L’Aquila city, in central Italy (Figure 1).
The building belongs to a social housing project dated back to 1992: 15 identical apartment
buildings were built in the slope of a hill. The earthquake occurred in 2009 affected the
concrete beam structure; therefore, this building was demolished and rebuilt in 2016, in
compliance with the requirement in force in that year. Data were therefore taken directly form
project.
Country: Italy
Municipality: L’Aquila
Altitude: 721 m a.s.l
Geographic coordinates: 42°21′14.43″N -
13°23′31.17″E
Degree Days: 2514
Fig. 1. Aerial view (from Google Maps) of the selected building and location details
2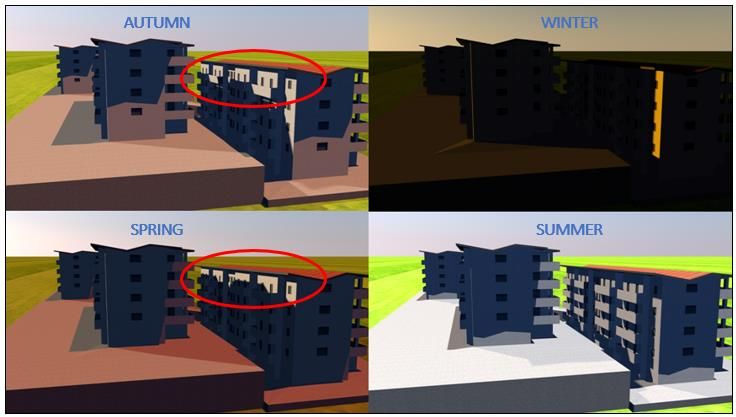
E3S Web of Conferences 197, 02013 (2020)                       https://doi.org/10.1051/e3sconf/202019702013
75° National ATI Congress

                                   Table 1. Building technical features.
                                        EX-ANTE                            EX-POST
       External Wall                    U= 1,3 W/m2K                       U= 0,3 W/m2K
       Internal Wall                    U= 2,3 W/m2K                       U= 2,3 W/m2K
       Walls toward unheated staircase  U= 1,5 W/m2K                       U= 0,9 W/m2K
       Slab                             U= 1,6 W/m2K                       U= 1,6 W/m2K
       Slab toward unheated spaces      *                                  U= 0,3 W/m2K
       Roof                             *                                  U= 0,3 W/m2K
       Pillars                          U= 2,7 W/m2K                       U= 0,4 W/m2K
       Boiler                           Pmax=30 kW autonomus,              Pn=107 kW centralized
                                        multi-stage,
       Solar thermal panels             Not installed
       Photovoltaic panels              Not installed                      10 kW
       *Values derived from analogy with similar buildings

         The structure conserved its main shape. However, some modifications took place:
              • Balconies on the front side were enlarged, preserving their squared form, whilst
                  small balconies were added on the rear side;
              • The original autonomous heating system was replaced by a centralized one;
              • The original fourth floor confined with an unheated attic; with the
                  reconstruction, the fourth floor has a wooden roof directly towards the outdoor;
              • The autonomous boilers, serving for the heating and hot water, were replaced
                  by a centralized unit;
              • An inertial storage tank (1500 litres) was added to the HVAC;
              • Solar thermal panels were added and installed for water pre-heating;
              • Photovoltaic panels were also added (total of 10 kW, 64 m2 of panels).

                                                                                                a)

                                                    3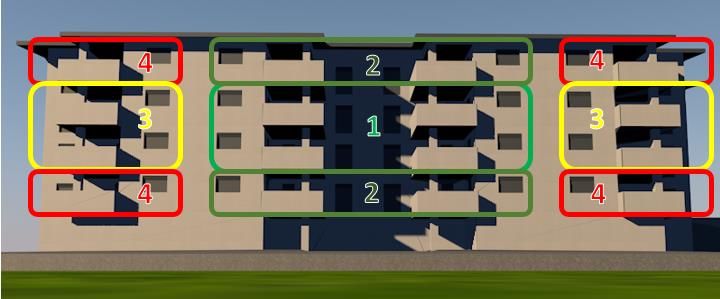
E3S Web of Conferences 197, 02013 (2020)                         https://doi.org/10.1051/e3sconf/202019702013
75° National ATI Congress

       b)                                                                  c)
       Fig. 2. (a) Drawing of the selected building with conventional nomenclature, (b)
            side view with shadow projection and (c) solar path along the building

          To ease the referral to the apartment, the following rule has been employed (Fig. 2a):
          since the centralized HVAC system serves two adjacent building, they’ve been both
          considered in the evaluations (B1 and B2). Each building has a staircase, that allows to
          access the flats on the left (E1) and on its right (E2). Each flat is then referred to its floor
          (from 1 to 4). Therefore, the writing B1.E2.3 refers to the apartment on the third floor of
          the right side of building B1. The considered buildings are shaded by other buildings
          standing in proximity (Fig. 2b), whose interference with the solar light is shown in (Fig.
          2c) and will be better analysed in the following sections.

      2.1 Evaluation method

          For the purposes of this work, it has been chosen to evaluate the energy performances of
      the flats as it would have been done for selling or renting, as required by Italian law. Hence,
      a commercial software was employed, to gather the energy labelling. Balconies, pillars,
      thermal bridges, shadings and all the information needed for a proper energy evaluation were
      modelled
          By this method, several energy related indexes can be found, related to the energy services
      in the building. For residential buildings, they are: domestic hot water (w); heating (h);
      cooling (c). each one can be expressed as a sum of renewable (ren) or non-renewable (nren)
      contribution, according to specific conversion parameters. The sum of the energy
      performance indexes is the global energy performance (gl, tot) of the building that, in turn,
      can be expressed in terms of renewable and non-renewable contribution.

                                EPW,ren    +    EPw,nren    =     EPw        (1)
                                  +               +                +
                                EPH,ren    +    EPH,nren    =     EPH        (2)
                                  +               +                +
                                EPc,ren    +    EPc,nren    =     EPc        (3)
                                  =               =                =
                                EPgl,ren   +    EPgl,nren   =    EPgl, tot   (4)

         The energy certification expresses by a letter (label) the “ranking” of the global non-
      renewable energy performance index, according to specific grades given by multiplying
      coefficients. Such ranking is expressed by letters (form better to worse: A4,

                                                      4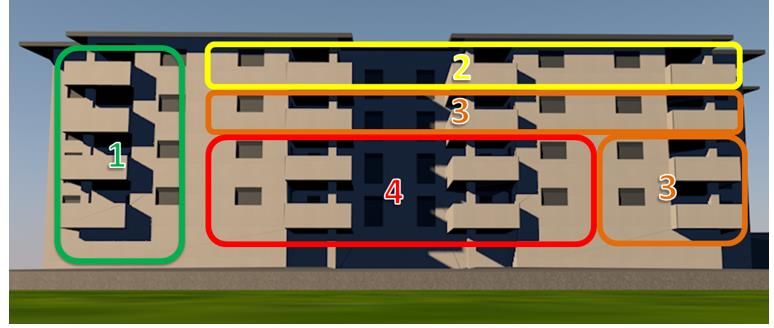
E3S Web of Conferences 197, 02013 (2020)                      https://doi.org/10.1051/e3sconf/202019702013
75° National ATI Congress

      A3,A2,A1,B,C,D,E,F,G). For this reason, results have been firstly expressed in terms of
      EPgl,nren (kWh/m2y), and secondly in terms of the solar heat gained Qsol (kWh) and of the heat
      loss for transmission through the envelope Q tr (kWh) during the heating season (being this
      predominant given the degree days). All these results were gathered by using a commercial
      software in accordance to the Italian laws in force, in order to compare flats as it would be
      done by technicians and energy labellers.

      3 Results and discussion
          According to the Italian law in force, the energy label and EP gl,nren have been calculated
      for each apartment, both for the “ex-ante” and “ex-post” case. Results are shown in Figure 3.
          Before reconstruction, each flat was classified as G (the worste energy performance in
      the grad). Flats of B1.E2 and B2.E1 have lower global indexes than their narrows, and this
      also happens with all the flats of the second and third floor, showing the dependence on the
      boundary conditions given by the presence of occupied flats in the nearby. However,
      differences can be high, in fact. After reconstruction, half of the apartments were classified
      as A1, the remaining with B. EPgl,nren ranged between 49,5 kWh/m2y of flat B2.E1.3 and 71
      kWh/m2y of flat B2.E2.4. Once again, flats of the second and third floor have lower global
      non-renewable energy consumption, but it does not directly correspond to higher grades.
          To compare the behaviour of each building staircase, histograms of figure 4 are shown,
      referring to the EPgl,tot (thus, including the renewable contribution).

                                                                                               (a)

                                                                                               (b)

       Fig. 3 Energy label and Global Non-renewable Energy Performance index of each
       flat: (a) Ex ante; (b)ex-post

                                                    5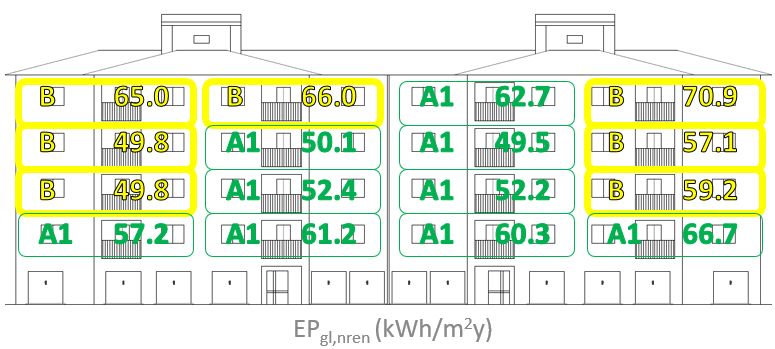
E3S Web of Conferences 197, 02013 (2020)                    https://doi.org/10.1051/e3sconf/202019702013
75° National ATI Congress

       Fig. 4 Average, for each stair, of the global total energy performance index, before and
       after reconstruction.

                                                  6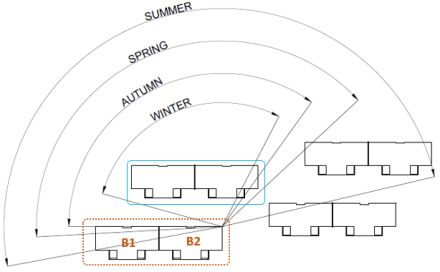
E3S Web of Conferences 197, 02013 (2020)                     https://doi.org/10.1051/e3sconf/202019702013
75° National ATI Congress

       Fig. 5 Qh, sol analysis at 9 a.m. on the NW esposure, and at 5 p.m on the SW exposure

          Figure 4 clearly highlights that columns B1.E1 and B2.E2 are those penalized by their
      exposition, being lateral. The solar path on the buildings has been simulated with a
      commercial software (Cinema 4D) along the seasons: renders are shown in Figure 5, where
      analysis refer to 9 a.m. on the NW esposure, and to 5 p.m on the SW exposure. For the
      simulations, it can be seen that in the morning, each flat gathers quite the same amount of
      light (and heat) from sum on the NW exposure; on the contrary, by seeing the SW side, in
      autumn and spring, the fourth floor is lighted by sun at dawn, as well as column B1.E1 in
      winter. This hints that results must be read in terms of solar gains and heat transmission,
      especially for the heating season. Therefore, results of Fig.6 are prposed, where once againg
      flats are grouped or ranked.

                                                                                             (a)

                                                   7
E3S Web of Conferences 197, 02013 (2020) https://doi.org/10.1051/e3sconf/202019702013
75° National ATI Congress
(b)
Fig. 6 Results in terms of: (a) Qh,sol and (b) Qh,tr
For the analysis of Qh,sol, the best column (rank 1) is B1.E1 (since it does not have any
building or obstacle in the nearby that projects shadows, as seen also in Fig. 2c). For the
remaining flats, the ones with lower solar gains are those in the first floor, followed by the
ones on the second and on the third. This agrees with the projection of Fig. 2b). Then, heat
losses for transmission have been evaluated, to assess (and confirm) the influence of the
boundary conditions determined on the central flats. Results are ranked in Fig.6 b).
Finally, solar gains and transmission losses have been compared for each column of the
two buildings, both in the ex-ante and ex-post configurations. Results are shown in Fig.7.
where it is evident that before reconstruction transmission losses were high for all the
apartments, and orders of magnitudes higher than the solar gains.
8E3S Web of Conferences 197, 02013 (2020) https://doi.org/10.1051/e3sconf/202019702013
75° National ATI Congress
a)
b)
Fig. 7 Tranmission losses and solar gains before (a) and after (b) recontruction
This effect was preponderant in the final evaluation (energy label) of the flats, that, in
fact, were all classified as “G”. On the contrary, after reconstruction, the transmission losses
are higher (three to four times) than the solar gains, that now play an important role in the
final ranking of each flat. This implies a different pattern for the energy labelling, which can
influence the building (rental or selling) market. Please also note that from Fig. 2b that lower
EPgl,nren does not automatically corresponds to higher grades, as happens for flats B1.E1.1
and B1.E1.2 (this depends on the way the grads are evaluated according to the Italian law).
This can contribute to mislead the final user in his choice. In fact, which apartment is more
suitable to be recommended to a potential buyer? Answer this question is not so easy, as seen
by these results.
9E3S Web of Conferences 197, 02013 (2020) https://doi.org/10.1051/e3sconf/202019702013
75° National ATI Congress
4 Conclusions
When choosing a housing solution, many aspects must be addressed. Pretending to be a final
user, it is normal to expect that, at equal prices, you get more attracted by the better energy
label. However, as proven in this work, the energy label by itself can mislead the proper
evaluation of a building or flat. This datum is meaningless when not paired with the total
energy consumption of the building itself, and with other side considerations on issues like
solar gains or transmission losses. In this paper, such evaluations have been pointed out on a
real building, showing that flats layout and shadings might affect, in relevant ways, total
energy consumptions, and/or the energy label associated to each flat.
In fact, by coupling commercial softwares, it is possible to compare the main energy
consumption index of flats, and to assess which are the ones penalized by their exposure.
Indeed, by comparing the solar gains and the transmission losses, it is possible to rank the
flats. Such consideration can be done before and after reconstruction, in order to infer if and
how such ranking can change due to the effect of solar gain and transmission losses.
As a whole, exposure and shading due to other buildings are very relevant for flats energy
performance: their contribution to total energy performance are higher when transmission
losses get lower. Flats not shaded by side buildings can benefit of higher solar gain but, on
the other hand, might have higher transmission losses due to their positioning in the building
(they are generally on the highest floor). On the contrary, flats in the middle, which have
lower transmission losses, also have lower solar gains.
Before reconstruction, transmission losses were high for all the apartments, and orders of
magnitudes higher than the solar gains; after reconstruction, the transmission losses are three
to four times the solar gains, but their relative weight for the energy label has changed. In
fact, after reconstruction, solar gains play an important role in the final ranking of each flat.
This implies a different pattern for the energy labelling (before reconstruction, all flats were
classifiedg “G”).
References
1. Directive 2002 /91/CE (EPBD - Energy Performance of Building Directive)
2. Directive 2012/27/EU of the European Parliament and of the Council of 25 October
2012 on energy efficiency, amending Directives 2009/125/EC and 2010/30/EU and
repealing Directives 2004/8/EC and 2006/32/EC (2012)
3. C. Zeng, S. Liu, A. Shukla, B. Yang, J. Build. Eng. 18, 281-291 (2018)
4. W. O'Brien et al., Build. Environ. (to be published 2020)
https://doi.org/10.1016/j.buildenv.2020.106906
5. M. Ashouri, B. C.M. Fung, F. Haghighat, H. Yoshino, Energy, 194, 116813 (2020)
6. Y. Zhang, C. Xiao, G. Zhou, J Clean Prod 242, 118555 (2020)
7. L.G. Giraudet, Energy Econ., 87, 104698 (2020)
8. M. Olsthoorn, J. Schleich, S. Hirzel, Ecol. Econ., 136, 240-254 (2017)
9. L. Zhang, Y. Li, R. Stephenson, B. Ashuri, Energ Build 158, 1226-1240 (2018)
10. L. Tronchin, K. Fabbri, Energ Policy 48, 176-184 (2012)
11. F. Fantozzi, F. Leccese, G. Salvadori, G. Tuoni, WIT Transactions on Ecology and the
Environment, Vol 122, (2009)
10You can also read