Sleep deprivation impairs molecular clearance from the human brain
←
→
Page content transcription
If your browser does not render page correctly, please read the page content below
doi:10.1093/brain/awaa443                                                                                                 BRAIN 2021: 144; 863–874   | 863

Sleep deprivation impairs molecular clearance

                                                                                                                                                             Downloaded from https://academic.oup.com/brain/article/144/3/863/6214917 by Oslo and Akershus University College user on 13 April 2021
from the human brain
 Per Kristian Eide,1,2 Vegard Vinje,3 Are Hugo Pripp,4 Kent-Andre Mardal3,5 and
Geir Ringstad6

See Stefani and Högl (doi:10.1093/brain/awab047) for a scientific commentary on this article.

It remains an enigma why human beings spend one-third of their life asleep. Experimental data suggest that sleep is required for
clearance of waste products from brain metabolism. This has, however, never been verified in humans. The primary aim of the pre-
sent study was to examine in vivo whether one night of total sleep deprivation affects molecular clearance from the human brain.
Secondarily, we examined whether clearance was affected by subsequent sleep. Multiphase MRI with standardized T1 sequences
was performed up to 48 h after intrathecal administration of the contrast agent gadobutrol (0.5 ml of 1 mmol/ml), which served as
a tracer molecule. Using FreeSurfer software, we quantified tracer enrichment within 85 brain regions as percentage change from
baseline of normalized T1 signals. The cerebral tracer enrichment was compared between two cohorts of individuals; one cohort
(n = 7) underwent total sleep deprivation from Day 1 to Day 2 (sleep deprivation group) while an age and gender-matched control
group (n = 17; sleep group) was allowed free sleep from Day 1 to Day 2. From Day 2 to 3 all individuals were allowed free sleep.
The tracer enriched the brains of the two groups similarly. Sleep deprivation was the sole intervention. One night of sleep depriv-
ation impaired clearance of the tracer substance from most brain regions, including the cerebral cortex, white matter and limbic
structures, as demonstrated on the morning of Day 2 after intervention (sleep deprivation/sleep). Moreover, the impaired cerebral
clearance in the sleep deprivation group was not compensated by subsequent sleep from Day 2 to 3. The present results provide
in vivo evidence that one night of total sleep deprivation impairs molecular clearance from the human brain, and that humans do
not catch up on lost sleep.

 1    Institute of Clinical Medicine, Faculty of Medicine, University of Oslo, Oslo, Norway
 2    Department of Neurosurgery, Oslo University Hospital – Rikshospitalet, Oslo, Norway
 3    Center for Biomedical Computing, Simula Research Laboratory, Lysaker, Norway
 4    Oslo Centre of Biostatistics and Epidemiology, Research Support Services, Oslo University Hospital, Oslo, Norway
 5    Department of Mathematics, University of Oslo, Oslo, Norway
 6    Department of Radiology, Oslo University Hospital – Rikshospitalet, Oslo, Norway

Correspondence to: Professor Per Kristian Eide, MD PhD
Department of Neurosurgery
Oslo University Hospital – Rikshospitalet
Pb 4950 Nydalen
N-0424 Oslo, Norway
E-mail: p.k.eide@medisin.uio.no

Keywords: sleep; sleep deprivation; brain metabolism; magnetic resonance imaging; cerebrospinal fluid tracer

Received July 21, 2020. Revised August 24, 2020. Accepted October 8, 2020.
C The Author(s) (2021). Published by Oxford University Press on behalf of the Guarantors of Brain. All rights reserved.
V
For permissions, please email: journals.permissions@oup.com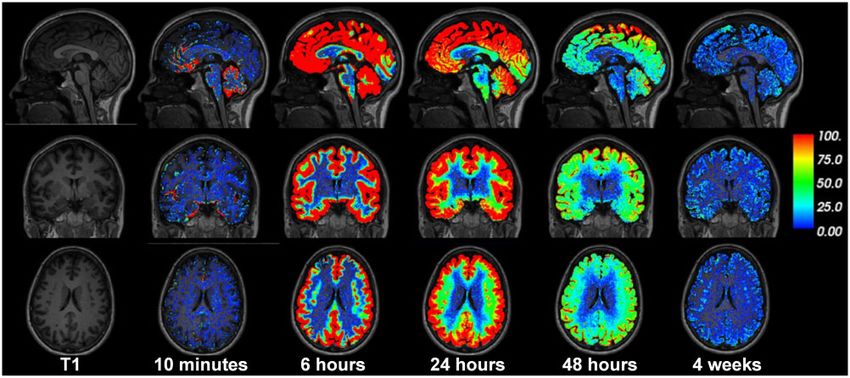
864   | BRAIN 2021: 144; 863–874                                                                                       P. K. Eide et al.

Introduction                                                       T1-weighted MRI scanning before and after intrathecal
                                                                   gadobutrol at predefined time points during Day 1 and at
Sleep is essential for human life, including cognitive function    24 h (next morning), 48 h (the morning after) and at 4
(Rasch and Born, 2013), but it remains a mystery why man           weeks (Supplementary Fig. 1). Following completion of
spends about one-third of life asleep. Experimental evidence       imaging, the entire brain was analysed in FreeSurfer, allow-
has shown that sleep has a restorative function by facilitat-      ing for the assessment of 85 subregions.
ing clearance of metabolic waste products from the brain
that accumulate during wakefulness (Xie et al., 2013). With

                                                                                                                                           Downloaded from https://academic.oup.com/brain/article/144/3/863/6214917 by Oslo and Akershus University College user on 13 April 2021
two-photon microscopy, it was found that sleep increased
the brain interstitial volume fraction by 60%, allowing for a
                                                                   Materials and methods
2-fold faster clearance of amyloid-b from the cortex. The          The study was approved by the Regional Committee for
observations echoed with reports of disrupted sleep in the         Medical and Health Research Ethics (REK) of Health Region
preclinical stage of Alzheimer’s disease (Moran et al., 2005),     South-East, Norway (2015/96), the Institutional Review Board
a disease in which amyloid-b and tau aggregation in suscep-        of Oslo University Hospital (2015/1868), the National
                                                                   Medicines Agency (15/04932-7), and was registered in Oslo
tible brain areas develop long before onset of clinical demen-
                                                                   University Hospital Research Registry (ePhorte 2015/1868). The
tia. Severe sleep disturbances also accompany traumatic
                                                                   conduct of the study was governed by ethical standards accord-
brain injury (Mathias and Alvaro, 2012), where patients suf-
                                                                   ing to the Declaration of Helsinki of 1975 (and as revised in
fer from increased cerebral tau and amyloid-b burden and           1983). Study participants were included after written and oral
risk of Alzheimer’s disease (Johnson et al., 2012). It was pre-    informed consent.
viously demonstrated in a mouse Alzheimer’s disease model
that interstitial levels of amyloid-b, a metabolic by-product
of neuronal activity, increased after acute sleep deprivation,
                                                                   Experimental design
while chronic sleep deprivation increased amyloid-b forma-         The aim of the study was to determine whether sleep depriv-
tion (Kang et al., 2009). Others also reported that sleep de-      ation results in impaired molecular clearance from the human
privation increased the amount of soluble amyloid-b and the        brain. Total sleep deprivation for 24 h in one of the groups
risk of amyloid-b plaque formation in mice (Roh et al.,            (sleep deprivation group) was the intervention. The participants
2012). The levels of tau were also increased in the interstitial   undergoing sleep deprivation were observed within the depart-
fluid of the hippocampus following sleep deprivation (Holth        ment of neurosurgery by the nursing staff. Also, a close relative
et al., 2019). In healthy humans, undisturbed sleep caused         stayed with the participant throughout the night to help them
                                                                   stay awake. Thereby, it was controlled that the participants
6% reduction in CSF amyloid-b42 levels while remaining un-
                                                                   were awake from Day 1 to Day 2.
changed after one night of total sleep deprivation (Ooms
                                                                      An MRI contrast agent, gadobutrol, was administered intra-
et al., 2014). An amyloid-b PET study showed that one
                                                                   thecally, and served as CSF tracer. MRI acquisitions were car-
night of sleep deprivation increased parenchymal amyloid-b
                                                                   ried out at multiple time points: pre-contrast, and after 0–1.5 h,
burden by 5% in 20 healthy individuals (Shokri-Kojori              1.5–3 h, 4.5–7 h (Day 1), 24 h (Day 2), 48 h (Day 3), and after
et al., 2018). More recently, a direct link between sleep-         4 weeks. Individuals allocated to total sleep deprivation were
related neuronal activity and CSF and blood flow was indi-         awake from Day 1 until Day 2. From Day 2 until Day 3, they
cated based on observations that slow-wave sleep was               were allowed to sleep without restrictions. The sleep deprivation
accompanied with large-amplitude CSF flow as compared              group was compared with subjects with no restrictions on sleep
with the awake state, and an inverse relationship between          (sleep group), who were asleep from the evening of Day 1 until
CSF flow and blood flow (Fultz et al., 2019). It has, how-         the morning of Day 2, during which time the subjective sleep
ever, never been demonstrated in vivo whether sleep, or            quality was recorded. An illustration of the study design is pre-
sleep deprivation, affects molecular clearance from the            sented in Supplementary Fig. 1.
human brain.
   The present study was undertaken to examine the effect of       Patients
one night of total sleep deprivation on molecular clearance
                                                                   Intrathecal administration of gadobutrol is currently performed
from the human brain. The MRI contrast agent gadobutrol
          R                                                        off-label on clinical indication and is not used in healthy individ-
(GadovistV, Bayer) was used as tracer molecule to enrich
                                                                   uals. Therefore, the study was restricted to include patients
brain tissue via intrathecal administration in CSF (Ringstad
                                                                   under clinical work-up of tentative CSF disorders in
et al., 2018). Gadobutrol is a highly hydrophilic molecule
                                                                   the Department of Neurosurgery, Oslo University Hospital –
with molecular weight of 604 Da, hydraulic diameter of 2          Rikshospitalet (Table 1) and with a clinical indication for
nm; and distributes freely within the brain, confined to the       performing intrathecal contrast-enhanced MRI. We invited con-
extravascular compartment by the blood–brain barrier               secutive patients to undergo sleep deprivation; participants in
(Ringstad et al., 2018). Gadobutrol as a CSF tracer may            the sleep group included patients who matched the sleep depriv-
therefore be considered a surrogate marker for assessing           ation group regarding tentative diagnosis, age and gender.
transport of water-soluble metabolites excreted along extra-       Other selection criteria were not used. Exclusion criteria
vascular pathways within the brain, including amyloid-b            included: history of hypersensitivity reactions to contrast agents,
and tau. The MRI research protocol included standardized           history of severe allergy reactions in general, evidence of renal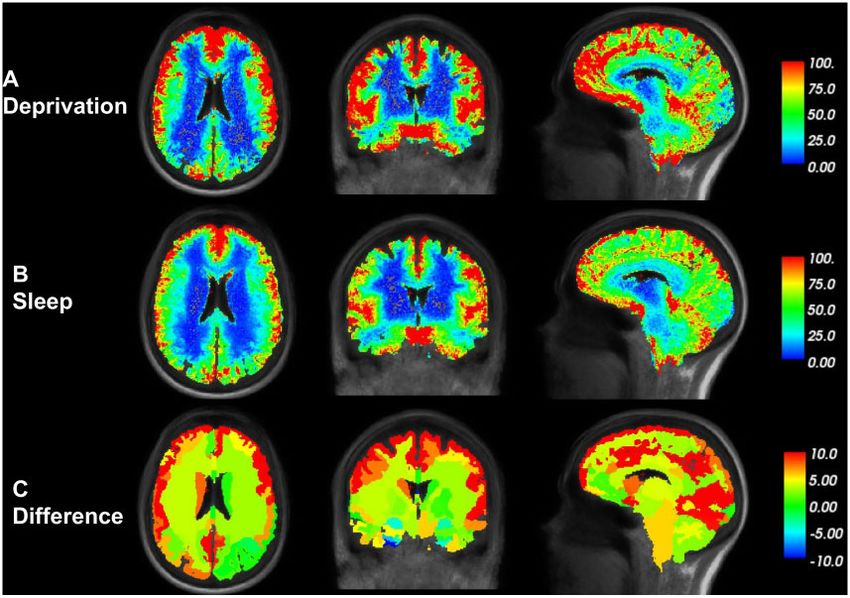
Sleep and cerebral molecular clearance                                                                                                BRAIN 2021: 144; 863–874               | 865

Table 1 Demographic and clinical information about the two study groups

                                                                Sleep group                           Sleep deprivation group                                   Significance
  n                                                                  17                                              7
  Sex, female/male                                                  15/2                                            6/1                                                ns
  Age, years                                                     39.2 ± 14.1                                    44.7 ± 15.7                                            ns
  BMI, kg/m2                                                     28.3 ± 6.2                                     26.2 ± 3.7                                             ns
  Tentative diagnosis
     Non-verified CSF leakage                                     3 (17.6%)                                     2 (28.6%)                                              ns

                                                                                                                                                                                        Downloaded from https://academic.oup.com/brain/article/144/3/863/6214917 by Oslo and Akershus University College user on 13 April 2021
     Pineal cyst (non-surgery)                                    5 (29.4%)                                     1 (14.3%)                                              ns
     Arachnoid cyst (non-surgery)                                  1 (5.9%)                                     1 (14.3%)                                              ns
     Hydrocephalus (non-surgery)                                   1 (5.9%)                                         0                                                  ns
     IIH (non-surgery)                                            2 (11.8%)                                     1 (14.3%)                                              ns
     IIH (surgery)                                                5 (29.4%)                                     2 (28.6%)                                              ns
  Sleep Day 1 to 2
     Total sleep deprivation                                           –                                             7                                                 –
     Hours with sleep                                              6.4 ± 1.9                                         0                                                 –
  Subjective sleep quality Day 1 to 2
     Light                                                            2                                              –                                                 –
     Medium                                                           5                                              –                                                 –
     Deep                                                             10                                             –                                                 –

Categorical data presented as numbers; continuous data presented as mean ± standard deviation. Significant differences between groups were determined by independent samples
t-test for continuous data and by Pearson v2 test for categorical data. BMI = body mass index; IIH = idiopathic intracranial hypertension; ns = non-significant. The subjective sleep
quality from Day 1 to Day 2 is indicated.

dysfunction, pregnant or breastfeeding females, and age 518 or                                  Gadobutrol increases the T1 relaxation of water and hence
480 years.                                                                                    results in higher signal intensity at the image greyscale when
                                                                                              present in CSF or brain tissue. The T1 signal intensity thus
                                                                                              provides a semiquantitative measure of the tracer
MRI protocol                                                                                  concentration.
The study used a 3 T Philips Ingenia MRI scanner (Philips
Medical systems), applying equal imaging protocol settings at
all time points to acquire sagittal 3D T1-weighted volume scans.
                                                                                              Image analysis
The following imaging parameters were used: repetition time =                                 The multiple MRI acquisitions were aligned, and we used
‘shortest’ (typically 5.1 ms), echo time = ‘shortest’ (typically 2.3                          FreeSurfer software (version 6.0) (http://surfer.nmr.mgh.har
ms), flip angle = 8 , field of view = 256  256 cm and matrix                                vard.edu/) for segmentation, parcellation and registration/align-
= 256  256 pixels (reconstructed 512  512). We sampled                                      ment of the longitudinal data. The segmentation and parcella-
184 overcontiguous (overlapping) slices with 1 mm thickness                                   tion acquired from Freesurfer were used to investigate the
that were automatically reconstructed to 368 slices with 0.5 mm                               increase of T1 intensity caused by the CSF tracer. The meth-
thickness; total duration of each image acquisition was 6 min                                 ods are documented in a review (Fischl, 2012). Non-brain tis-
and 29 s. To secure consistency and reproducibility of the MRI                                sue is removed using a hybrid watershed/surface deformation
slice placement and orientation, slice orientation of image stacks                            procedure (Segonne et al., 2004), followed by automated
was defined using an automated anatomy recognition protocol                                   Talairach transformation and segmentation of the subcortical
based on landmark detection in MRI data (SmartExamTM,                                         white matter, and deep grey matter structures (including
                                                                                              hippocampus, amygdala, caudate, putamen and ventricles)
Philips Medical Systems) for every time point.
                                                                                              (Fischl et al., 2002, 2004). The magnetic resonance images of
                                                                                              each patient were used to create a median template registered
Intrathecal gadobutrol as CSF                                                                 to the baseline, as previously described (Reuter et al., 2012).
tracer                                                                                        Hence, for each patient the magnetic resonance images were
                                                                                              registered to the corresponding template using a rigid trans-
After the pre-contrast MRI, the intrathecal injection of gadobu-                              formation (Reuter et al., 2012). The registrations were subse-
trol was carried out by an interventional neuroradiologist.                                   quently checked manually by V.V. to correct for any
Correct position of the syringe tip in the subarachnoid space                                 registration errors.
was verified by CSF backflow from the puncture needle.                                           For image analysis at the group level, a template was created
Gadobutrol was administered in a dose of 0.5 mmol (0.5 ml of                                  using scans of all subjects for all time points. The template was
                                                R
1.0 mmol/ml gadobutrol; GadovistV, Bayer Pharma AG). After                                    created with ‘mri_robust_template’ and segmented with ‘recon-
injection, the patient was instructed to rotate once around the                               all’ in FreeSurfer; thereafter all segmentations were visually
body axis on the table. Study participants were kept flat until                               inspected for possible errors, not disclosing any structural differ-
the last MRI acquisition Day 1 and allowed to move freely                                     ences between the templates of the two groups. With the aligned
thereafter.                                                                                   image data and the template segmentation, a median image of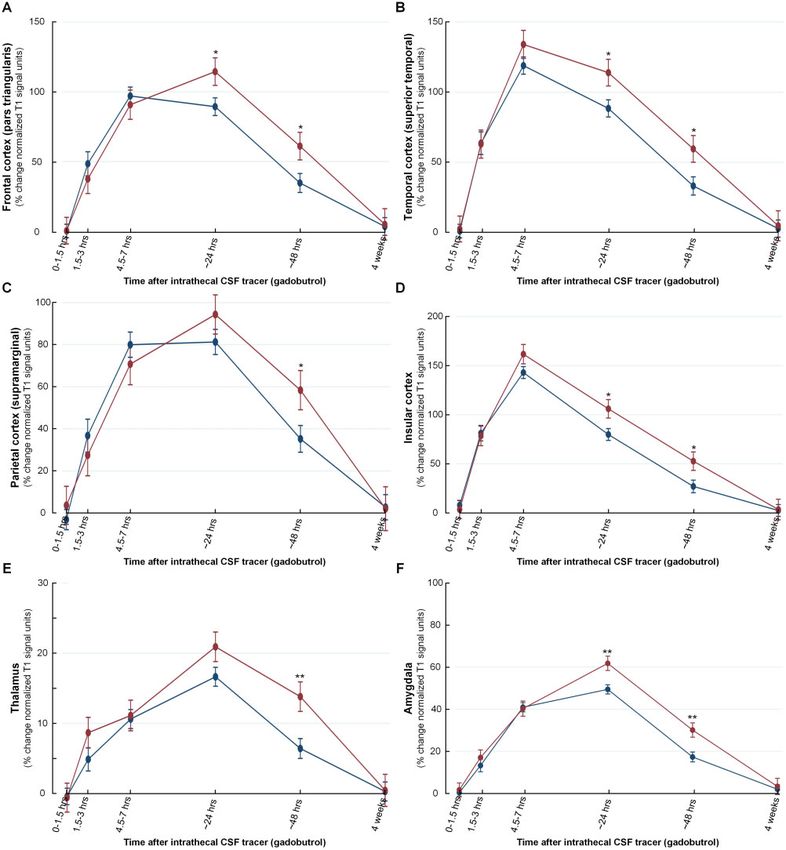
866   | BRAIN 2021: 144; 863–874                                                                                                       P. K. Eide et al.

                                                                                                                                                           Downloaded from https://academic.oup.com/brain/article/144/3/863/6214917 by Oslo and Akershus University College user on 13 April 2021
 Figure 1 In vivo brain imaging shows that one night of total sleep deprivation reduces molecular clearance from the human
 brain. The images present tracer enrichment within brain tissue, while tracer in CSF spaces have been subtracted. Tracer enrichment in brain tis-
 sue is expressed by MRI signal percentage increase from baseline, and shown on the colour scale. (A) The tracer-dependent signal increase in
 brain is presented on average for the cohort undergoing total sleep deprivation from Day 1 to Day 2 (n = 7; sleep deprivation group). Axial (left),
 coronal (middle) and sagittal (right) MRI scans are presented with the percentage signal increase from baseline, indicated by the colour scale. (B)
 The average percentage signal increase from tracer enrichment is presented for the cohort allowed to sleep freely from Day 1 to Day 2 (n = 17;
 sleep group). (C) The percentage difference in signal increase between the cohorts (sleep deprivation minus sleep groups) is shown. The colour
 scale shows that tracer levels in the brain tissue were higher after sleep deprivation compared to sleeping subjects. The red colour represents
 areas with the highest tracer levels. In particular, clearance of tracer after sleep deprivation was most impaired in frontal, temporal, parietal and
 cingulate cortical areas.

each group was created at given time points. For each group,                  Statistical analyses
the relative increase in intensity from the last time point of Day
                                                                              Continuous data were presented as mean (standard deviation,
1 to Day 2 was computed. The differential map shown in Fig. 1
                                                                              SD) or mean (standard error, SE), as appropriate. Normal distri-
was created by subtracting the median relative increase of the                bution of data was assessed in both groups. We estimated from
sleep deprivation group from the median relative increase in the              the image analysis the mean and standard error at 0 (pre-con-
sleep group. Finally, for the visualization, each segmented region            trast), 0–1.5 h, 1.5–3 h, 4.5–7 h, 24 h, 48 h, and at 4 weeks fol-
was assigned the median value of the differential map in the re-              low-up. The repeated measurements were assessed with linear
spective region.                                                              mixed models by maximum likelihood estimation using a sub-
                                                                              ject-specific random intercept and including for main regions
                                                                              parenchyma of brain a nested random effect of brain segments.
                                                                              Using estimated marginal mean from the statistical model, we
Normalization of T1 signal                                                    tested the difference between the sleep deprivation group and
                                                                              sleep group at the different points of follow-up.
To adjust for changes in the greyscale between MRI scans, the                    The statistical analysis was performed using SPSS version 26
T1 signal unit for each time point was divided by the T1 signal               (IBM Corporation, Armonk, NY) and Stata/SE 15.0 (StataCrop
unit of a reference region of interest for the respective time                LLC, College Station, TX). Statistical significance was accepted
point. The reference region of interest was placed within the                 at the 0.05 level (two-tailed).
posterior part of the orbit. The placement of the reference region
of interest is illustrated in Supplementary Fig. 2. The ratio repre-
sents the ‘normalized T1 signal units’ and corrects for any base-
                                                                              Data availability
line changes of image greyscale due to automatic image scaling.               The data presented in this work are available upon request.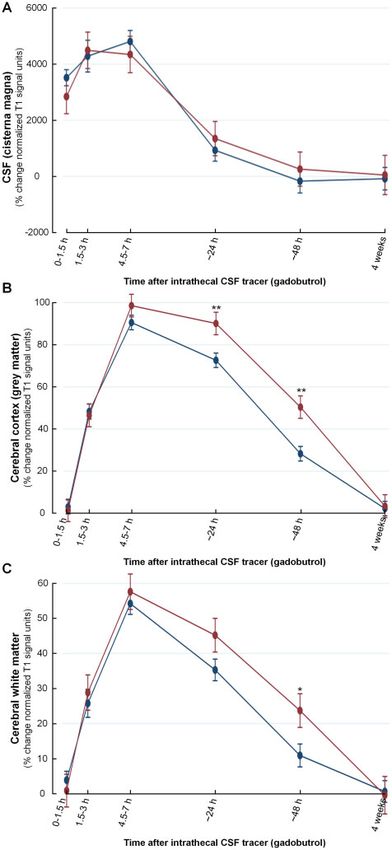
Sleep and cerebral molecular clearance                                                         BRAIN 2021: 144; 863–874    | 867

Results                                                           Increased amount of CSF tracer in
                                                                  brain after total sleep deprivation
Patients                                                          Our main question was whether tracer levels within brain
Seven individuals underwent total sleep deprivation from          parenchyma differed after one night of total sleep depriv-
Day 1 to Day 2 (sleep deprivation group), and 17 individu-        ation. Elevated levels of tracer on a declining enhancement
als slept from Day 1 to Day 2 (sleep group). The two groups       curve would here be defined as reduced molecular clearance
were similar with regard to age, gender, body mass index          from the brain. After one night, both groups still displayed

                                                                                                                                     Downloaded from https://academic.oup.com/brain/article/144/3/863/6214917 by Oslo and Akershus University College user on 13 April 2021
(BMI) and tentative diagnosis (Table 1). While individuals in     substantial tracer enrichment within the brain, but the tracer
the sleep deprivation group had no sleep from Day 1 to 2,         enrichment was higher in the sleep deprivation group com-
individuals in the sleep group had 6.4 ± 1.9 h sleep from         pared to the sleep group (Fig. 1). After 24 h, tracer levels
Day 1 to 2. Subjective sleep quality was ‘deep’ in 10 individ-    were similar within the CSF spaces of the two groups
uals, ‘medium’ in five and ‘light’ in two subjects (Table 1).     (Fig. 4A), demonstrating that clearance of tracer from CSF
                                                                  spaces was not affected by sleep deprivation. On the other
Tracer enrichment within the CSF                                  hand, in the sleep deprivation group there were significantly
                                                                  increased tracer levels within the cerebral cortex (Fig. 4B)
space                                                             and cerebral white matter (Fig. 4C), as sign of reduced tracer
Following intrathecal injection, the tracer distributed in the    clearance. Moreover, the impaired molecular clearance from
subarachnoid spaces intracranially, primarily in the basal cis-   sleep deprivation was evident in structures typically consid-
terns and along the major artery trunks (anterior, middle         ered part of, or closely linked to, the limbic system, such
and posterior cerebral arteries) at the brain surface, allowing   as amygdala, hippocampus, nucleus accumbens, prefrontal
for free mixing with CSF (Supplementary Video 1). A region        cortex, insula and cingulum (Fig. 5 and Supplementary
of interest was placed manually in each image volume at the       Table 3).
level of the cisterna magna to assess tracer enrichment in           Between the 24 h to 48 h time points, no sleep restrictions
CSF spaces (Supplementary Fig. 3). Tracer enrichment of the       were given to any of the groups. Still, the tracer levels in the
intracranial CSF spaces was confirmed in all study partici-       brain tissue remained elevated at 48 h in the sleep depriv-
pants, with no difference in enrichment level between the         ation group (Figs 1, 5 and Supplementary Table 3), suggest-
sleep deprivation and sleep groups throughout the imaging         ing a lost night of sleep is not immediately compensated for
period (Supplementary Table 1).                                   by a 1-day recovery period of unrestricted sleep.
   The normalized MRI T1 signal within the CSF, indicative           Forty-eight hours after sleep deprivation, differences be-
of tracer enrichment in CSF spaces, was comparable be-            tween groups were noted within numerous white matter
tween the sleep and sleep deprivation groups                      regions (Supplementary Table 3). We cannot conclude
(Supplementary Table 1). After intrathecal injection, the CSF     whether this was primarily an effect of the sleep interven-
tracer enriched the subarachnoid CSF spaces; at 4.5–7 h the       tion, or secondary to different tracer levels in the cortex
normalized T1 signal was significantly increased in the sleep     above. Enrichment of white matter was highly associated
(P 5 0.001) and sleep deprivation (P = 0.007) groups, but         with enrichment of the adjacent grey matter of cerebral cor-
with no differences between groups.                               tex after 4–5–7 h (Fig. 6A), 24 h (Fig. 6B) and 48 h
                                                                  (Fig. 6C). Thus, the events that we observed within the white
Tracer enrichment within brain                                    matter seem dependent on the enrichment of grey matter.
tissue
The tracer gadobutrol enriches brain tissue from the surface.
                                                                  No residual tracer in CSF after 4
Notably, tracer enhancement in brain tissue represents mo-        weeks
lecular movement in the extravascular spaces (i.e. perivascu-     After 4 weeks, there were no differences in normalized T1
lar and interstitial spaces). Tracer enriched in all main brain   signal as compared to before intrathecal CSF tracer adminis-
regions (Fig. 2). The time course of enrichment of tracer         tration in any of the groups (Supplementary Table 4), i.e. no
within the extravascular compartment of the brain is illus-       signs of remaining contrast agent in CSF or brain tissue in
trated for one individual of the sleep group in Fig. 3 (see       any of the groups.
also Supplementary Video 2). Furthermore, Supplementary
Table 2 demonstrates—for a wide range of brain loca-
tions—a highly significant change in T1 signal after 4.5–7 h,
which indicates extravascular enrichment of CSF tracer in
                                                                  Discussion
brain tissue. As can be seen, the CSF tracer passes to nearly     This study provides the first in vivo evidence that sleep de-
all examined regions of the brain. For the majority of brain      privation results in impaired molecular clearance from the
subregions, there were no differences in tracer enrichment        human brain and that one night clearance failure may not
between groups at 4.5–7 h, except for a few locations.            be compensated by subsequent sleep.
868 | BRAIN 2021: 144; 863–874 P. K. Eide et al.
Downloaded from https://academic.oup.com/brain/article/144/3/863/6214917 by Oslo and Akershus University College user on 13 April 2021
Figure 2 The CSF tracer enriches the extravascular compartment of the brain centripetally. The images present tracer enrichment
within brain tissue, while tracer in CSF spaces has been subtracted. The degree of tracer enrichment in brain tissue is expressed by the MRI signal
increase, and shown by the colour scale. Tracer enrichment was brain-wide and comparable between the groups at the last MRI scan on Day 1
preceding sleep deprivation. The average percentage signal increase in the brain after 4.5–7 h is shown for all subjects within (A) the sleep depriv-
ation (n = 7) and (B) sleep (n = 17) groups. For both groups, it should be noted that tracer enrichment occurred in a centripetal pattern, and con-
centrated particularly in brain regions adjacent to large artery trunks at the surface. The coronal section (middle) shows enhancement in the
medial temporal lobe close to the circle of Willis and posterior cerebral arteries, in the cingulum adjacent to the location of the anterior cerebral
arteries in the anterior interhemispheric fissure, and around the Sylvian fissure, where the middle cerebral artery trunks reside. Compared to be-
fore tracer administration (blue), the normalized T1 signal had increased markedly after 4.5–7 h (red) within grey matter of cerebral cortex (C)
and cerebral white matter (D).
The two groups were comparable with regard to age, gender of tracer from the brain in the sleep deprivation group. Total
and tentative diagnosis. The level of tracer in CSF space was sleep deprivation was verified in the sleep deprivation group by
similar throughout the study period and should therefore have the patient, the attending family members and nursing staff
not confounded different levels of tracer in brain tissue at any within the neurosurgical ward, where the participants stayed.
time point. In the end, we therefore regard the sleep interven- It was established many years ago that acute sleep depriv-
tion to be the only factor accompanied with impaired clearance ation negatively affects a wide range of cognitive functions,Sleep and cerebral molecular clearance BRAIN 2021: 144; 863–874 | 869
Downloaded from https://academic.oup.com/brain/article/144/3/863/6214917 by Oslo and Akershus University College user on 13 April 2021
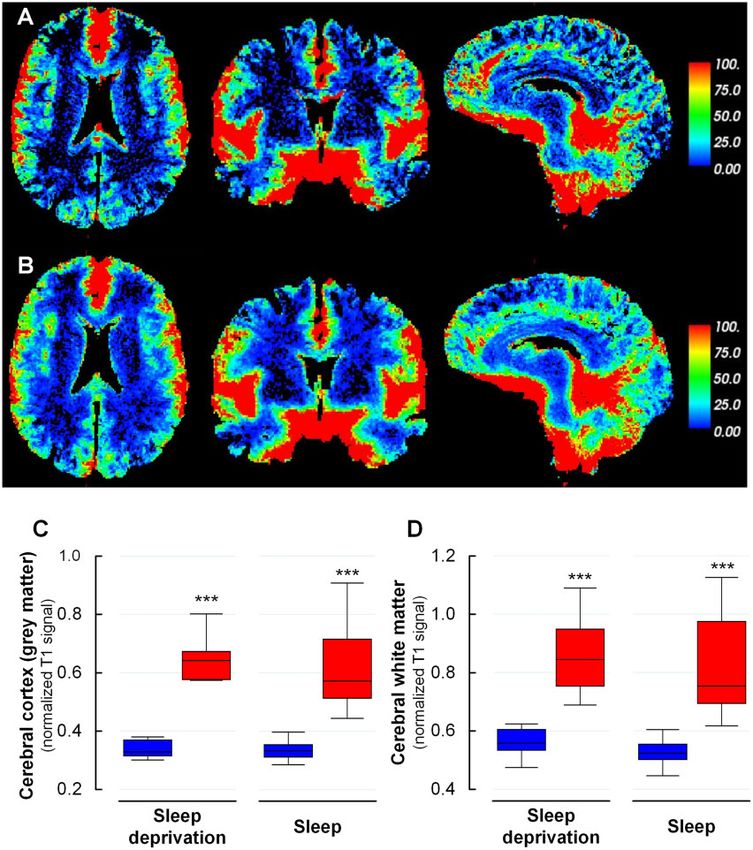
Figure 3 Brain-wide CSF tracer enrichment over time for one individual from the sleep group. The images present tracer enrich-
ment within brain tissue, while tracer in CSF spaces have been subtracted. Standardized T1-weighted MRI was obtained at different time points
before and after intrathecal gadobutrol, serving as CSF tracer. Percentage T1 signal increase from tracer enrichment in brain tissue is illustrated
by the colour scale. Positive and negative image noise are coded blue or transparent, respectively. Because of a lower signal-to-noise ratio, noise
is most apparent in images from time points with no tracer enrichment in the brain. After 4 weeks, there was no sign of residual tracer in brain
tissue (Supplementary Table 4).
including memory, learning, attention, emotional reactivity cerebral cortex (allocortex) with resemblance between
(Lim and Dinges, 2010). Sleep deprivation for days and humans and lower species. The proximity of these regions to
weeks may even be fatal (Rechtschaffen et al., 1983; Shaw large artery trunks at the brain surface may suggest that the
et al., 2002). A progressive type of insomnia has been arterial pulsation by their propagation to CSF is an import-
described in humans (familial or sporadic) that results in ant driving force for nearby parenchymal tracer enrichment,
aggravating loss of sleep and eventually dementia and death as shown previously (Ringstad et al., 2018). Limbic struc-
(Montagna et al., 2003). Chronic sleep deprivation has even tures also correspond to some degree with areas susceptible
emerged as a major risk factor for Alzheimer’s disease and to consecutive tau propagation in Alzheimer’s disease (Braak
neurodegeneration in general (Moran et al., 2005). An or- and Braak, 1991).
dinary explanation for sleep disturbance in dementia has The mechanisms by which molecules are cleared from the
been dementia-related death of neurons involved in sleep brain are currently extensively debated, not least facilitated
function including the hypothalamic suprachiasmatic nucleus by the description of a glymphatic system in rodent brain
(Swaab et al., 1985). This region is involved in circadian (Iliff et al., 2012). The glymphatic system is a paravascular
rhythm as the suprachiasmatic senses light via the retinohy- transport route for convective motion of fluids and solutes
pothalamic tract (Moore and Eichler, 1972; Berson et al., along the arterial tree penetrating the brain, via interstitial
2002). Over the last few years, more attention has shifted to- tissue and finally along the venous vessels, driven by artery
wards the role of sleep in clearance of waste products, such pulsations and being dependent on the water channel aqua-
as amyloid-b (Xie et al., 2013). porin 4 (AQP4) at astrocytic endfeet surrounding the cere-
Whether or not sleep affects molecular clearance from the bral vasculature (Iliff et al., 2012). The concept has been
human brain has never been proven. The previous in vivo criticized regarding the role of AQP4 (Smith and Verkman,
observations from mice (Xie et al., 2013), using two-photon 2018), mechanisms behind molecular transport in interstitial
microscopy, assessed events occurring 50.5 mm below the tissue (Holter et al., 2017), as well as studies indicating that
cortical surface after removal of the scull bone, which is paravascular transport of solutes such as amyloid-b occur
known to affect the pulsatile nature of the brain. Our brain- retrograde along the basement membrane and muscular wall
wide observations show that sleep deprivation affects clear- of arteries towards lymphatic vessels (Weller et al., 2007;
ance even within deep parts of the brain, and that the effect Bakker et al., 2016). Due to the limited resolution of MRI
of sleep deprivation is protracted (peak after 24–48 h). In (1 mm), we cannot conclude with certainty about the exact
particular, differences were evident within the limbic system, passage route of the tracer within brain tissue. Our observa-
which represents the phylogenetically oldest part of the tions utilizing intrathecal contrast-enhanced MRI may,870 | BRAIN 2021: 144; 863–874 P. K. Eide et al.
however, provide support to the glymphatic concept, namely
the antegrade transport of CSF tracer along arteries
(Ringstad et al., 2017), centripetal enrichment of brain tissue
from outside cerebral cortex of a tracer strictly confined out-
side vessels due to the blood–brain barrier (Ringstad et al.,
2018), and evidence for transport faster than extracellular
diffusion in the observed tracer movement (Valnes et al.,
2020). The present observations of sleep-dependent tracer
Downloaded from https://academic.oup.com/brain/article/144/3/863/6214917 by Oslo and Akershus University College user on 13 April 2021
enrichment within brain tissue may also support the glym-
phatic concept, given that sleep-dependent molecular clear-
ance is a key part of the glymphatic concept (Xie et al.,
2013).
Independent the mechanisms behind brain molecular clear-
ance, the dural lymphatic vessels seem to represent the main
efflux route for solutes from intracranial CSF spaces
(Louveau et al., 2017). In humans, parasagittal dura serves
as a bridging link between subarachnoid CSF spaces and the
dural lymphatic vessels (Ringstad and Eide, 2020). It was re-
cently shown that lymphatic drainage was faster in awake
than anaesthetized mice (Ma et al., 2019), which might indi-
cate that glymphatic clearance of waste solutes occurs during
sleep while during the awake state lymphatic efflux to
extracranial lymph nodes is enhanced. On the other hand,
we found no evidence that sleep deprivation affects clearance
of tracer from CSF spaces (Fig. 4A and Supplementary
Table 1), suggesting that lymphatic molecular efflux routes
are less affected by sleep in humans. To what extent sleep
may be instrumental for lymphatic molecular efflux rate
needs to be addressed in future studies.
Some study limitations should be noted. Here, we added a
tracer to CSF that subsequently enriched the brain extravas-
cular compartment centripetally, from outside to inside.
There is an agreement that substances are cleared centrifu-
gally under physiological conditions (Weller et al., 2007; Iliff
et al., 2012). In its clearance phase from the brain, the tracer
is thus expected to move against a concentration gradient,
unlike endogenous byproducts of brain metabolism.
Furthermore, the limited temporal resolution of MRI scans
did not allow us to precisely assess the timing of peak brain
enrichment, or the exact time point when groups differed
most. Finally, the lack of EEG registrations during sleep de-
privation renders us unable to exclude the possibility of
Figure 4 One night of total sleep deprivation reduces micro-sleep. Any of these limitations may therefore have
clearance of tracer from the brain that lasts even after an- made us underestimate the impact of sleep on molecular
other night of sleep. Trend plots of percentage change in signal clearance.
unit ratio, indicative of tracer enrichment within brain tissue, are The present findings are in line with the hypothesis that
presented for different regions, including (A) CSF space at the cra- parenchymal CSF tracer movement is governed by the sleep-
niocervical junction, (B) cerebral cortex (grey matter), and (C) wake cycle, rather than the circadian rhythm per se. In mice,
cerebral white matter. While tracer levels were similar between the
adrenergic antagonists increased CSF tracer influx to paren-
groups in the CSF space (A), there were significant differences be-
chyma comparably with influx during sleep or anaesthesia
tween the sleep deprivation (red) and sleep (blue) groups in grey
matter of the cerebral cortex (B) and white matter (C) at 24 h (i.e.
(Xie et al., 2013). The authors proposed that locus coeruleus
after sleep intervention) and at 48 h (both groups were allowed to adrenergic-mediated shrinkage of cell volume reduced resist-
sleep freely from 24 to 48 h). *P 5 0.05, **P 5 0.01, ***P 5 0.001. ance to diffusion or bulk (convective) flow during sleep
Trend plots are presented with mean ± SE from linear mixed might enhance clearance of waste solutes such as amyloid-b
models. from brain parenchyma. It is well established that locus
coeruleus-derived noradrenergic signalling is instrumental in
regulating arousal and awake state (Carter et al., 2010;Sleep and cerebral molecular clearance BRAIN 2021: 144; 863–874 | 871
Downloaded from https://academic.oup.com/brain/article/144/3/863/6214917 by Oslo and Akershus University College user on 13 April 2021
Figure 5 Increased CSF tracer levels in a selection of brain regions indicative of reduced molecular clearance after total sleep
deprivation. Delayed molecular clearance after sleep deprivation is exemplified by trend plots of percentage change in signal unit ratio from a
selection of brain regions, including (A) gyrus triangularis in frontal cortex, (B) superior temporal gyrus in temporal cortex, (C) supramarginal
gyrus in parietal cortex, (D) insular cortex, (E) thalamus, and (F) amygdala. Significant differences between the sleep group (blue) and sleep
deprivation group (red) were determined at each individual time point. *P 5 0.05, **P 5 0.01, ***P 5 0.001. Trend plots are presented with
mean ± SE.
Constantinople and Bruno, 2011). The neurons from locus in these same regions following sleep deprivation. In
coeruleus project to the basal forebrain, pre-optic area, Alzheimer’s disease, there is degeneration of locus coeruleus
hypothalamus, thalamus and cortex (Akeju et al., 2014; and increased noradrenergic tone, reflected by increased CSF
Purdon et al., 2015). Here we noted evident clearance failure concentrations of norepinephrine (Elrod et al., 1997; Szot872 | BRAIN 2021: 144; 863–874 P. K. Eide et al.
et al., 2006, 2007). In this regard, it should be mentioned
that the anaesthetic agent dexmedetomidine is an a2 agonist
that hyperpolarizes locus coeruleus neurons and decreases
firing rate and norepinephrine release (Jorm and Stamford,
1993), and induces a state comparable to stage II sleep with
an increase in slow-wave activity (0.5 to 3.5 Hz) (Purdon
et al., 2015). This compound was found to enhance glym-
phatic clearance in rats (Benveniste et al., 2017), and to en-
Downloaded from https://academic.oup.com/brain/article/144/3/863/6214917 by Oslo and Akershus University College user on 13 April 2021
hance delivery of intrathecal drugs to the brain in rats (Lilius
et al., 2019). On this background, manipulation of noradre-
nergic tone may emerge as a method for modifying extravas-
cular (interstitial and perivascular) molecular transport in
the brain. The extracellular space constitutes 20% of the
overall brain volume (Sykova and Nicholson, 2008), and the
cortical interstitial volume fraction was 13–15% in mice in
the awake state compared to 22–24% in the sleeping or
anaesthetized state (Xie et al., 2013).
Conclusions
In conclusion, we provide in vivo evidence that one night of
total sleep deprivation impairs molecular clearance from the
human brain, an effect not compensated for by another
night’s sleep. The results support the hypothesis that the
interstitial space increases in the sleeping human brain, as
previously demonstrated in rodents. As such, the observa-
tions have implications for understanding the impact of dis-
turbed sleep in the evolvement of neurodegenerative disease,
and may point to avenues for enhancing endogenous mo-
lecular transport and delivery of intrathecal drugs.
Acknowledgements
We thank Dr Øivind Gjertsen, Dr Bård Nedregaard and Dr
Ruth Sletteberg from the Department of Radiology, Oslo
University Hospital – Rikshospitalet, who performed the
intrathecal gadobutrol injections in all study subjects. We
thank Lars Magnus Valnes, PhD, for providing scripts for
FreeSurfer analysis. We also sincerely thank the Intervention
Centre and Department of Neurosurgery at Oslo University
Hospital Rikshospitalet for providing valuable support with
MR scanning and care-taking of all study subjects through-
out the study. Finally, we sincerely thank the Nurse Staff and
Figure 6 Association between tracer enrichment in cere- Hydrocephalus outward clinic, Department of Neurosurgery
bral cortex and white matter. The association between Oslo University Hospital – Rikshospitalet for care-taking of
tracer enrichment (normalized T1 signal increase) within the all study subjects throughout the study.
cerebral cortex and cerebral white matter at different time
points, namely (A) 4.5–7 h, (B) 24 h and (C) 48 h after intra-
thecal CSF tracer administration. For all time points, there was
a highly significant correlation between tracer enrichment within
the cortical grey matter and cerebral white matter. The fit line
Funding
and the Pearson correlation coefficient (R) with significance Department of Neurosurgery, Oslo University Hospital –
P-value is presented for each plot. Rikshospitalet, Oslo, Norway.Sleep and cerebral molecular clearance BRAIN 2021: 144; 863–874 | 873
Kang JE, Lim MM, Bateman RJ, Lee JJ, Smyth LP, Cirrito JR, et al.
Competing interests Amyloid-beta dynamics are regulated by orexin and the sleep-wake
cycle. Science 2009; 326: 1005–7.
G.R. received a speaker fee from Bayer AG. Lilius TO, Blomqvist K, Hauglund NL, Liu G, Stæger FF, Bærentzen
S, et al. Dexmedetomidine enhances glymphatic brain delivery of
intrathecally administered drugs. J Control Release 2019; 304:
29–38.
Supplementary material Lim J, Dinges DF. A meta-analysis of the impact of short-term sleep
deprivation on cognitive variables. Psychol Bull 2010; 136: 375–89.
Louveau A, Plog BA, Antila S, Alitalo K, Nedergaard M, Kipnis J.
Downloaded from https://academic.oup.com/brain/article/144/3/863/6214917 by Oslo and Akershus University College user on 13 April 2021
Supplementary material is available at Brain online.
Understanding the functions and relationships of the
glymphatic system and meningeal lymphatics. J Clin Invest 2017;
127: 3210–9.
References Ma Q, Ries M, Decker Y, Müller A, Riner C, Bücker A, et al. Rapid
lymphatic efflux limits cerebrospinal fluid flow to the brain. Acta
Akeju O, Loggia ML, Catana C, Pavone KJ, Vazquez R, Rhee J, et al. Neuropathol 2019; 137: 151–65.
Disruption of thalamic functional connectivity is a neural correlate Mathias JL, Alvaro PK. Prevalence of sleep disturbances, disorders,
of dexmedetomidine-induced unconsciousness. eLife 2014; 3: and problems following traumatic brain injury: a meta-analysis.
e04499. Sleep Med 2012; 13: 898–905.
Bakker EN, Bacskai BJ, Arbel-Ornath M, Aldea R, Bedussi B, Morris Montagna P, Gambetti P, Cortelli P, Lugaresi E. Familial and sporadic
AW, et al. Lymphatic clearance of the brain: perivascular, paravas- fatal insomnia. Lancet Neurol 2003; 2: 167–76.
cular and significance for neurodegenerative diseases. Cell Mol Moore RY, Eichler VB. Loss of a circadian adrenal corticosterone
Neurobiol 2016; 36: 181–94. rhythm following suprachiasmatic lesions in the rat. Brain Res 1972;
Benveniste H, Lee H, Ding F, Sun Q, Al-Bizri E, Makaryus R, et al. 42: 201–6.
Anesthesia with dexmedetomidine and low-dose isoflurane increases Moran M, Lynch CA, Walsh C, Coen R, Coakley D, Lawlor BA.
solute transport via the glymphatic pathway in rat brain when com- Sleep disturbance in mild to moderate Alzheimer’s disease. Sleep
pared with high-dose isoflurane. Anesthesiology 2017; 127: 976–88. Med 2005; 6: 347–52.
Berson DM, Dunn FA, Takao M. Phototransduction by retinal gan- Ooms S, Overeem S, Besse K, Rikkert MO, Verbeek M, Claassen JA.
glion cells that set the circadian clock. Science 2002; 295: 1070–3. Effect of 1 night of total sleep deprivation on cerebrospinal fluid b-
Braak H, Braak E. Neuropathological stageing of Alzheimer-related amyloid 42 in healthy middle-aged men: a randomized clinical trial.
changes. Acta Neuropathol 1991; 82: 239–59. JAMA Neurol 2014; 71: 971–7.
Carter ME, Yizhar O, Chikahisa S, Nguyen H, Adamantidis A, Purdon PL, Sampson A, Pavone KJ, Brown EN. Clinical electroenceph-
Nishino S, et al. Tuning arousal with optogenetic modulation of alography for anesthesiologists: part i: background and basic signa-
locus coeruleus neurons. Nat Neurosci 2010; 13: 1526–33. tures. Anesthesiology 2015; 123: 937–60.
Constantinople CM, Bruno RM. Effects and mechanisms of wakeful- Rasch B, Born J. About sleep’s role in memory. Physiol Rev 2013; 93:
ness on local cortical networks. Neuron 2011; 69: 1061–8. 681–766.
Elrod R, Peskind ER, DiGiacomo L, Brodkin KI, Veith RC, Raskind Rechtschaffen A, Gilliland MA, Bergmann BM, Winter JB.
MA. Effects of Alzheimer’s disease severity on cerebrospinal fluid Physiological correlates of prolonged sleep deprivation in rats.
norepinephrine concentration. Am J Psychiatry 1997; 154: 25–30. Science 1983; 221: 182–4.
Fischl B. FreeSurfer. Neuroimage 2012; 62: 774–81. Reuter M, Schmansky NJ, Rosas HD, Fischl B. Within-subject tem-
Fischl B, Salat DH, Busa E, Albert M, Dieterich M, Haselgrove C, et plate estimation for unbiased longitudinal image analysis.
al. Whole brain segmentation: automated labeling of neuroanatom- Neuroimage 2012; 61: 1402–18.
ical structures in the human brain. Neuron 2002; 33: 341–55. Ringstad G, Eide PK. Cerebrospinal fluid tracer efflux to parasagittal
Fischl B, Salat DH, van der Kouwe AJ, Makris N, Segonne F, Quinn dura in humans. Nat Commun 2020; 11: 354.
Ringstad G, Valnes LM, Dale AM, Pripp AH, Vatnehol SS, Emblem
BT, et al. Sequence-independent segmentation of magnetic resonance
KE, et al. Brain-wide glymphatic enhancement and clearance in
images. Neuroimage 2004; 23: S69–84.
humans assessed with MRI. JCI Insight 2018; 3: e121537.
Fultz NE, Bonmassar G, Setsompop K, Stickgold RA, Rosen BR,
Ringstad G, Vatnehol SAS, Eide PK. Glymphatic MRI in idiopathic
Polimeni JR, et al. Coupled electrophysiological, hemodynamic, and
normal pressure hydrocephalus. Brain 2017; 140: 2691–705.
cerebrospinal fluid oscillations in human sleep. Science 2019; 366:
Roh JH, Huang Y, Bero AW, Kasten T, Stewart FR, Bateman RJ, et
628–31.
al. Disruption of the sleep-wake cycle and diurnal fluctuation of b-
Holter KE, Kehlet B, Devor A, Sejnowski TJ, Dale AM, Omholt SW,
amyloid in mice with Alzheimer’s disease pathology. Sci Transl Med
et al. Interstitial solute transport in 3D reconstructed neuropil occurs
2012; 4: 150ra122.
by diffusion rather than bulk flow. Proc Natl Acad Sci USA 2017; Segonne F, Dale AM, Busa E, Glessner M, Salat D, Hahn HK, et al. A
114: 9894–9. hybrid approach to the skull stripping problem in MRI. Neuroimage
Holth JK, Fritschi SK, Wang C, Pedersen NP, Cirrito JR, Mahan TE, 2004; 22: 1060–75.
et al. The sleep-wake cycle regulates brain interstitial fluid tau in Shaw PJ, Tononi G, Greenspan RJ, Robinson DF. Stress response
mice and CSF tau in humans. Science 2019; 363: 880–4. genes protect against lethal effects of sleep deprivation in
Iliff JJ, Wang M, Liao Y, Plogg BA, Peng W, Gundersen GA, et al. A Drosophila. Nature 2002; 417: 287–91.
paravascular pathway facilitates CSF flow through the brain paren- Shokri-Kojori E, Wang GJ, Wiers CE, Demiral SB, Guo M, Kim SW, et
chyma and the clearance of interstitial solutes, including amyloid al. b-Amyloid accumulation in the human brain after one night of sleep
beta. Sci Transl Med 2012; 4: 147ra111. deprivation. Proc Natl Acad Sci USA 2018; 115: 4483–8.
Johnson VE, Stewart W, Smith DH. Widespread s and amyloid-b Smith AJ, Verkman AS. The “glymphatic” mechanism for solute clear-
pathology many years after a single traumatic brain injury in ance in Alzheimer’s disease: game changer or unproven speculation?
humans. Brain Pathol 2012; 22: 142–9. Faseb J 2018; 32: 543–51.
Jorm CM, Stamford JA. Actions of the hypnotic anaesthetic, dexmede- Swaab DF, Fliers E, Partiman TS. The suprachiasmatic nucleus of the
tomidine, on noradrenaline release and cell firing in rat locus coeru- human brain in relation to sex, age and senile dementia. Brain Res
leus slices. Br J Anaesth 1993; 71: 447–9. 1985; 342: 37–44.874 | BRAIN 2021: 144; 863–874 P. K. Eide et al.
Sykova E, Nicholson C. Diffusion in brain extracellular space. Physiol Valnes LM, Mitusch SK, Ringstad G, Eide PK, Funke SW, Mardal
Rev 2008; 88: 1277–340. KA. Apparent diffusion coefficient estimates based on 24 hours
Szot P, White SS, Greenup JL, Leverenz JB, Peskind ER, Raskind MA. tracer movement support glymphatic transport in human cerebral
Compensatory changes in the noradrenergic nervous system in the cortex. Sci Rep 2020; 10: 9176.
locus ceruleus and hippocampus of postmortem subjects with Weller RO, Subash M, Preston SD, Mazanti I, Carare RO.
Alzheimer’s disease and dementia with Lewy bodies. J Neurosci Perivascular drainage of amyloid-beta peptides from the brain and
2006; 26: 467–78. its failure in cerebral amyloid angiopathy and Alzheimer’s disease.
Szot P, White SS, Greenup JL, Leverenz JB, Peskind ER, Raskind MA. Brain Pathol 2007; 18: 253–66.
Changes in adrenoreceptors in the prefrontal cortex of subjects with Xie L, Kang H, Xu Q, Chen MJ, Liao Y, Thiyagarajan M, et al. Sleep
dementia: evidence of compensatory changes. Neuroscience 2007; drives metabolite clearance from the adult brain. Science 2013; 342:
Downloaded from https://academic.oup.com/brain/article/144/3/863/6214917 by Oslo and Akershus University College user on 13 April 2021
146: 471–80. 373–7.You can also read