Associations between fecal short chain fatty acids and sleep continuity in older adults with insomnia symptoms
←
→
Page content transcription
If your browser does not render page correctly, please read the page content below
www.nature.com/scientificreports
OPEN Associations between fecal
short‑chain fatty acids and sleep
continuity in older adults
with insomnia symptoms
Faiga Magzal1,2*, Carmel Even2, Iris Haimov3, Maayan Agmon4, Kfir Asraf3,
Tamar Shochat4,5 & Snait Tamir1,2,5
Insomnia is a disorder characterized by difficulty falling asleep and poor sleep continuity and is
associated with increased risks for physical and cognitive decline. Insomnia with short sleep duration
is considered the most biologically severe phenotype of the disorder. Evidence suggests that short-
chain fatty acids (SCFAs), the main byproducts of fiber fermentation in the gut, may affect sleep via
gut–brain communications. This study explores associations between SCFAs and sleep continuity
and compares SCFA concentrations in short vs. normal sleep insomnia phenotypes in older adults.
Fifty-nine participants with insomnia symptoms (≥ 65 years), completed 2 weeks of objective sleep
monitoring (actigraphy), and were divided into short and normal sleep duration phenotypes via cluster
analysis. Sleep measures included total sleep time (TST), sleep onset latency (SOL), sleep efficiency
(SE), and wake after sleep onset (WASO). Stool samples were collected and fecal SCFA concentrations
were determined by gas-chromatography-mass-spectrometry (GCMS). Higher concentrations of
acetate, butyrate, and propionate, and total SCFAs, were associated with lower SE and longer SOL
after controlling for Body Mass Index (BMI). Concentrations were higher in the short sleep duration
phenotype. Age, BMI, TST, and SOL explained 40.7% of the variance in total SCFAs. Findings
contribute to understanding pathways along the gut–brain axis and may lead to the use of SCFAs as
biomarkers of insomnia phenotypes.
Insomnia is a common chronic health condition and the most common sleep disorder, with symptoms affecting
around 50% of the adult population over 65 years old1. It is defined by the Diagnostic and Statistical Manual of
Mental Disorders, 5th edition (DSM-5)2, as difficulty initiating sleep, difficulty maintaining sleep and/or early
morning awakening, at least 3 times per week, lasting > 3 months, and is associated with an impairment of day-
time functioning, e.g. impairment of attention, memory or m ood2. In older adults, insomnia is particularly associ-
ated with nighttime symptoms (i.e., SOL and WASO) and hyperarousal1. Its persistence over time is detrimental
to physical and psychological wellbeing and health-related quality of life2–4. Insomnia is positively associated with
systemic inflammation5 and all-cause m ortality6. Models proposed by I rwin7 (2019), demonstrate the complex
associations between sleep disturbances, operationalized as short sleep duration and reduced sleep continuity,
stress, and chronic inflammation. This sleep disturbance shifts the transcriptional profile towards increased
inflammatory activity, increasing inflammatory markers (IL-6 and C-reactive protein and Tumor Necrosis Fac-
tor) and inflammatory transcriptional activity7,8 (Nuclear Factor-κB and Activator Protein 1). Yet the metabolic
mechanisms underlying the relationship between insomnia and inflammation are still poorly understood.
Short-chain fatty acids (SCFAs) are produced by means of the fermentation of host-indigestible dietary fibers
by specific bacteria in the human gut9, and are involved in numerous physiological functions such as gastroin-
testinal functionality, host metabolism, blood pressure regulation, neuroimmune f unction10–13, and gut–brain
communication14,15. Acetate, propionate, and butyrate are the most abundant SCFAs present in the colon. They
affect systemic inflammation mainly by regulating the secretion of interleukins and by inducing T regulatory
cell differentiation16.
1
Laboratory of Human Health and Nutrition Sciences, MIGAL-Galilee Research Institute, Kiryat Shmona, Israel. 2Tel
Hai College, Upper Galilee, Israel. 3The Max Stern Yezreel Valley College, Emek Yezreel, Israel. 4University of Haifa,
Haifa, Israel. 5These authors contributed equally: Tamar Shochat and Snait Tamir. *email: faigam@migal.org.il
Scientific Reports | (2021) 11:4052 | https://doi.org/10.1038/s41598-021-83389-5 1
Vol.:(0123456789)www.nature.com/scientificreports/
In human feces, higher SCFA concentrations are associated with increased gut permeability, metabolic dys-
regulation, and hypertension17, all of which are increased in older age18–20. Reduced absorption of circulating
SCFAs has been proposed as an explanation for the increased cardiometabolic risk associated with a higher
concentration of fecal S CFAs17. Indeed, an inverse association has been shown between acetate concentrations
in feces and colonic acetate a bsorption21.
SCFAs exert widespread effects on neurological and behavioral processes via the gut–brain axis. By crossing
the blood–brain barrier (BBB), they have been shown to increase neurogenesis, improve neuronal homeostasis
and function and contribute to serotonin b iosynthesis22. While associations between serotonin and depression
have been widely acknowledged for d ecades23,24, a large body of literature has established the role of serotonin
in sleep–wake r egulation25,26.
Furthermore, recent evidence suggests that SCFAs may function as mediators linking gut bacteria and sleep
mechanisms in the b rain27,28, but findings are scarce and inconsistent. Acetate has been shown to be involved in
appetite regulation by altering levels of inhibitory GABA and excitatory glutamate and glutamine neurotransmit-
ypothalamus29. Reduced GABA levels30–32 and elevated glutamate and g lutamine33 are implicated
ters in the h
in increased hyperarousal that characterizes individuals with insomnia. In addition, there is some evidence to
suggest that reduced GABA levels are correlated with shorter sleep d uration30. Also, butyrate treatment in vitro
and in vivo has been shown to inhibit depression-like behavior in rodents34. One study showed that oral admin-
istration or direct intraportal injection of butyrate and tributyrin, a butyrate-yielding pro-drug, elicited an
almost 50% increase in non-rapid-eye movement in young mice for 4 h after t reatment27. A recent animal study
found increased concentrations of butyrate in mice demonstrating increased sleep duration and reduced sleep
onset latency after receiving high-dose GABA fermented m ilk35. In human infants, increased fecal propionate,
but not acetate or butyrate, was associated with longer sleep d uration28. However, in young fruit flies, dietary
administration of medium- and long-chain fatty acids, but not short-chain fatty acids, increased sleep duration
in a dose-dependent manner36. These associations have yet to be observed in older human adults with insomnia,
which represents a chronic condition of disturbed and inadequate sleep.
Growing evidence supports a distinction between two phenotypes of insomnia based on objective sleep
duration: short and n ormal37. Insomnia with objective short sleep duration, typically defined as ≤ 6 h38,39, is
the most biologically severe phenotype and is associated with physiological hyperarousal and increased risk
of cardiometabolic morbidity and m ortality38,40,41. In contrast, the normal sleep duration phenotype (typically
defined as > 6 h) is associated with an overall lower risk of cardiometabolic o utcomes38,39. As insomnia with short
39
sleep duration is considered biologically b ased , the potential underlying biological mechanisms of these two
insomnia prototypes are likely to be different.
Our research focuses on older adults as a vantage point in our aim to understand relationships between two
distinct physiological functions that typically show accelerated decline throughout the aging process; i.e., sleep
(represented by the high prevalence of insomnia symptoms in older adults) and metabolism (represented by
declined absorption of SCFAs, which is associated with age-related cardiometabolic disturbances). Given the
importance of SCFAs in systemic inflammation and brain function, and given the evidence that they promote
sleep, we aimed to investigate associations between fecal SCFA concentrations and sleep duration and continuity
measures assessed by actigraphy in older adults with insomnia symptoms, comparing short and normal sleep
insomnia phenotypes. As fecal SCFA concentrations indicate low absorption and negative metabolic outcomes,
we hypothesized that increased fecal SCFA concentrations would be associated with longer sleep onset latency,
poorer sleep continuity (i.e., increased wake after sleep onset, and lower sleep efficiency) and with the short sleep
duration insomnia phenotype.
Materials and methods
The institutional review board (IRB) of the Faculty of Social Welfare and Health Sciences at the University of
Haifa approved this study and all its methods, conforming to relevant guidelines and regulations (approval
number 026/17). All study participants signed informed consent.
Participants. Two hundred and twenty-four potential participants, ages 65 and older, responded to adver-
tisements and activities in community centers for older adults, calling for volunteers with an insomnia complaint
and/or sleep dissatisfaction lasting several months at least. Eighty participants were eligible. The presence of
insomnia symptoms was based on self-report and supplemented by 2 weeks of actigraphic recordings. Partici-
pants underwent a short clinical interview conducted by a trained interviewer by telephone, during which they
were asked about medical condition(s), medication(s) or other substance use, and responded to questions about
specific nighttime sleep problems (see questions below). Eligible participants reported that they experienced
insomnia symptoms at least 3 nights per week, and on those nights reported > 30 min falling asleep, and/or
> 30 min awakenings. Based on actigraphy, inclusion criteria for insomnia symptoms were comprised of the
following commonly used benchmarks for poor sleep continuity:42,43 (a) sleep onset latency (SOL) or wake after
sleep onset (WASO) of > 30 min; and (b) less than 85% sleep efficiency (SE, percentage of total sleep time after
initial sleep onset out of total time in bed) for at least three out of seven nights each week. Exclusion criteria
included any significant visual or hearing impairments; chronic pain; substantial and unstable medical, neuro-
logical, or psychiatric illness; alcohol or drug use; psychiatric medication use; sleep apnea syndrome (SAS); and
periodic limb movement disorder during sleep (PLMD), based on self-report. Participants were tested on the
Mini-Mental State Examination (MMSE)44, using a cutoff > 26 to exclude participants with cognitive impair-
ment. All participants were Jewish and highly educated, 60% were married and 65% lived with their spouse.
All study participants were scheduled a home visit during which registered dietitians administered question-
naires on demographics, anthropometrics and nutritional data and medical history and collected stool samples.
Scientific Reports | (2021) 11:4052 | https://doi.org/10.1038/s41598-021-83389-5 2
Vol:.(1234567890)www.nature.com/scientificreports/
BMI was calculated based on participants weight and height measurements taken by the dietitian and calculated
using the equation: Weight/(Height)2. SCFA analysis was performed on fifty-nine participants (11 males, 48
females) that were included in the present study.
Sleep assessment measurements. Clinical interview. Specific sleep complaints included the following
items: (1) How many times a week do you experience insomnia, i.e., have difficulty falling asleep or difficulty staying
asleep (waking up at night and have difficulty falling back to sleep)? (2) On nights with insomnia: (2a) how long does
it take you to fall asleep? (2b) how long are you awake due to nighttime awakenings?
Two additional yes/no questions were asked regarding sleep apnea (“Have you been diagnosed with sleep
apnea?”) and periodic limb movements disorder (“have you been diagnosed with periodic limb movements dis-
order in sleep?”).
Actigraphy. Participants wore an Actiwatch (Phillips Respironics), activity wrist monitor for a 2-week
period. Recordings were performed in one-minute epochs with the Actiware 6.0.9 algorithm. Sleep onset and
offset were set to the first and last epoch of ten consecutive immobile minutes, respectively. To establish and
mark the timing of rest intervals, participants were instructed (1) to press on the event marker, a built-in feature
of the Actiwatch, at bedtime and at final awakening, and (2) to complete a sleep diary each morning upon awak-
ening (on paper). Rest intervals were based primarily on event markers and were verified by sleep diary records.
Participants wore an Actiwatch (Phillips Respironics) activity wrist monitor for a 2-week period. Derived meas-
ures included total sleep time (TST, minutes of sleep from intended bedtime to final wake time), sleep onset
latency (SOL, minutes to fall asleep from bedtime), sleep efficiency (SE, percentage of total sleep time after initial
sleep onset), and wake time after sleep onset (WASO, total wake minutes after sleep onset).
Stool sampling. Participants were asked to collect a stool sample during the morning hours into a screw-
capped collection container using a plastic holder and containing an RNase inhibitor solution (DNA/RNA
Shield Fecal Collection Tube, Zymo Research, CA, USA). Stool specimens were taken to the laboratory and
stored at − 20 °C until the time of analysis.
SCFAs extraction and analysis. SCFAs were extracted and analyzed according to a modified version of
the method described by Zhao et al.45. Briefly, each sample was thoroughly mixed using a vortex for 5 min. An
aliquot of 0.5 ml of the mixed fecal solution was taken. Its pH was adjusted to 2–3 by adding 150 μl of orthophos-
phoric acid (16% v/v), after which it was kept at room temperature for 10 min with occasional shaking. The
suspension was transferred into a polypropylene tube and centrifuged at 4 °C for 5 min at 10,000 rpm. The
supernatant was transferred to a chromatographic vial for gas chromatography analyses, and 2-methyl-butyric-
acid (#109959, Sigma-Aldrich, USA) was added to each vial in order to reach a final concentration of 0.001 M.
2-methyl-butyric-acid was added as an internal standard (IS) to correct for injection variability between samples
and minor changes in the instrument response. All vials were stored at − 20 °C before GC analysis. The feces
sediment was dried at 60 °C for 5–7 days, and its weight determined.
Gas chromatography analysis. The GCMS system consisted of an Agilent 7890A (Agilent Technolo-
gies, Palo Alto, CA, USA), equipped with an automatic liquid sampler (MPS2) (Gerstel, Mulheim, Germany)
and coupled to an Agilent 5975C mass selective detector. Results were acquired using the Chemstation software
(Hewlett-Packard, Palo Alto, CA, USA). The column used was a fused-silica capillary column with a free fatty
acid phase (DB-FFAP 122-3232, J&W Scientific, Agilent Technologies Inc., USA) of 0.25 mm × 30 m × 0.25 μm.
We used Helium as the carrier gas at a flow rate of 60.453 mL/min. The initial oven temperature was 70 °C, held
for 0.75 min, raised to 160 °C at 5 °C/min, raised to 230 °C at 20 °C/min, and held for 5.0 min. To avoid the
contamination with nonvolatile fecal material, a glass liner with a glass wool plug at the lower end of the GC
column. The injected sample volume for GC analysis was 1 μl, and the run time for each analysis was 27.25 min.
The detector was operated in the selection ionization mode (SIM). Ion selection of the SCFAs was based on the
retention time of standard compounds (WSFA-4, #47056, Sigma-Aldrich, USA).
Statistical analysis. We divided participants into insomnia phenotypes by the SPSS K-means cluster test,
using sleep efficiency and sleep duration derived from actigraphy as two distinguishing features of sleep. This
method looks at variation in specific variables and creates 2 or more groups with maximal variance between
them. Two clusters emerged, with no differences in sleep efficiency but significant differences in sleep dura-
tion. Based on differences in sleep duration, we labeled the first cluster “normal sleep duration” (normal group;
TST = 7.33 ± 0.62 h, n = 36) and the second cluster “short sleep duration” (short group; TST = 5.64 ± 0.67 h, n = 23).
Mann–Whitney, Pearson’s Chi-square and Fisher’s exact tests were performed to determine differences in
demographic and clinical features, sleep measures, and SCFA levels between clusters. Partial Spearman correla-
tion tests, controlling for BMI (as BMI was significantly different between groups), were performed to detect
associations between SCFA concentrations and actigraphy-derived sleep measures: TST, SOL, SE, and WASO.
To test whether two correlations were significantly different between groups, we performed Fisher r-to-z trans-
formations (https://www.psychometrica.de/correlation.html).
A multiple linear regression model was used to assess the associations between sleep measures and total
SCFAs, controlling for age and BMI. All statistical tests were performed using SPSS software, version 26.
Scientific Reports | (2021) 11:4052 | https://doi.org/10.1038/s41598-021-83389-5 3
Vol.:(0123456789)www.nature.com/scientificreports/
Combined sample Normal sleep Short sleep duration P (normal vs.
Parameter (n = 59) duration (n = 36) (n = 23) U (Z)/χ2 (df) short)
Age (years) 73.3 ± 4.8 73.7 ± 5.5 72.7 ± 3.4 384.5 (Z = − 0.10) 0.916
Sex (%)
Female 81.4 80.6 82.6
^ > 0.999
Male 18.6 19.4 17.4
Education (years) 16.09 ± 3.69 16.38 ± 4.37 15.66 ± 2.39 314 (Z = − 1.26) 0.206
Marital status (%)
Married 61.4 57.1 68.2
0.69 (df = 1) 0.405
Other 38.6 42.9 31.8
Living status (%)
Lives alone 34.5 37.1 30.4
0.27 (df = 1) 0.599
Lives with a partner/s 65.5 62.9 69.6
BMI (kg/m ) 2
29.6 ± 6.6 26.1 ± 4.0 32.6 ± 7.9 205.5 (Z = − 3.24) 0.001
Dietary intake
Protein (g/day) 92.3 ± 31.0 98.4 ± 32.6 82.9 ± 26.4 199 (Z = − 1.61) 0.107
Dietary fiber (g/day) 38.2 ± 13.2 41.5 ± 14.7 33.1 ± 8.7 186 (Z = − 1.88) 0.059
Metabolic diseases (%)
Hypertension 49.2 41.7 60.9 2.07 (df = 1) 0.150
Diabetes 22 16.7 30.4 1.54 (df = 1) 0.213
Hypercholesterolemia 42.4 50.0 30.4 2.20 (df = 1) 0.138
Use of medications (%)
Sleep medications 14.6 16.7 11.1 ^ 0.696
Depression medica-
12.2 12.9 11.1 ^ > 0.999
tions
Anti-cholinergic
19.1 16.7 23.5 ^ 0.704
medication
Sleep parameters
TST (h) 6.7 ± 1.0 7.32 ± 0.61 5.64 ± 0.66 0 (Z = − 6.43)www.nature.com/scientificreports/
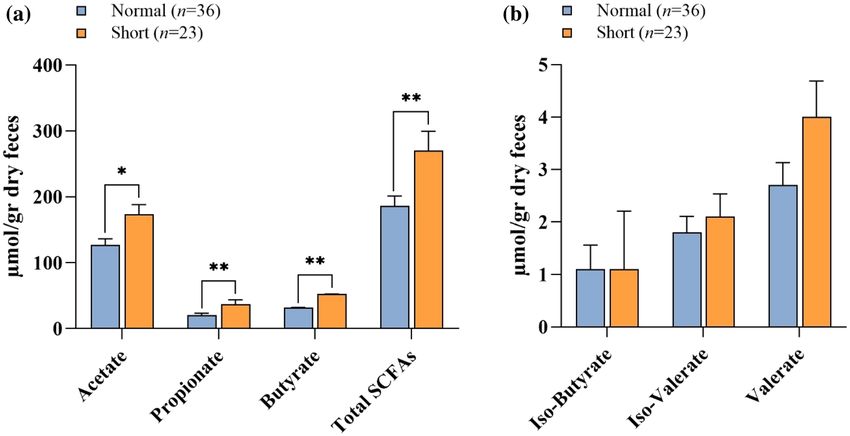
Figure 1. Differences in SCFA concentrations in the Normal and Short groups. The SCFAs measured are
acetate, propionate, and butyrate (a), and iso-butyrate, iso-valerate, and valerate (b). Results are shown as
mean ± SE. A Mann–Whitney test was used to compare differences between groups. *p < 0.05, **p < 0.01.
All participants (n = 59) Normal sleep duration participants (n = 36) Short sleep duration participants (n = 23)
Adjusted for BMI Adjusted for BMI Adjusted for BMI
TST (h) SOL SE WASO TST SOL SE WASO TST SOL SE WASO
0.522 − 0.511 0.142 − 0.121 0.524 − 0.402 0.129 − 0.263 0.565 − 0.685 0.352
Acetate − 0.275 (0.037)
(www.nature.com/scientificreports/
Semi-partial Explained variance
Dependent Variable Predictor B t p correlation (%)
Constant 290.321 1.352 0.182
Age − 0.842 − 0.324 0.747 − 0.03 0.11
F(5, 51) = 8.71, BMI 5.966 2.995 0.004 0.30 9.49
Total SCFAs p < 0.001
Adjusted R2 = 0.407 TST − 0.627 − 2.929 0.005 − 0.30 9.07
SOL 3.449 3.389 0.001 0.34 12.15
WASO 0.163 0.278 0.782 0.02 0.08
Table 3. Results of a multiple linear regression analysis predicting total SCFA concentration by age, BMI, TST,
SOL, and SE. p-value in bold indicates a significant predictor.
Regression results. We performed multiple linear regression analysis to predict total SCFA concentrations
by age, BMI, TST, SOL, and WASO (Table 3). The model was significant and explained 40.7% of the variance in
total SCFA. Higher BMI, shorter TST and longer SOL significantly predicted higher fecal SCFA concentrations.
Discussion
Our main findings are that in older adults, insomnia symptoms with short sleep duration are associated with
significantly higher fecal SCFA concentrations than insomnia symptoms with normal sleep duration, and that
these metabolites (specifically acetate, propionate, and butyrate) are significantly correlated with poorer sleep
continuity outcomes, above and beyond the effect of BMI. Overall, these findings support our study hypothesis.
Specifically, higher levels of acetate, butyrate, propionate and total SCFAs were significantly associated with lower
SE and longer SOL, and higher butyrate levels were significantly associated with shorter TST in the entire sample.
All associations with SE and SOL remained significant in the short sleep duration group, but not in the normal
sleep duration group (except for acetate and total SCFAs and SOL). The regression model showed that total SCFAs
were significantly predicted by TST, SOL and BMI. No associations were found with WASO. Levels of isobutyrate,
isovalerate, and valerate were similar in both groups and were not correlated with sleep continuity measures.
Studies examining the role of SCFAs in sleep disturbance in animals and humans are scarce and
inconsistent27,28,36,46,47. Nevertheless, evidence indicates that SCFAs may serve as key mediators in a range of
neurological conditions via microbiota–gut–brain communication15. One plausible pathway linking SCFAs and
sleep disturbance may be related to their binding to specific receptors in gut Enterochromaffin cells (ECCs),
promoting serotonin synthesis48. Serotonin, a key neurotransmitter involved in sleep and mood, affects the brain
through ECCs interaction with afferent nerve fibers through synapse-like connections between neuropod-like
extensions and afferent nerve t erminals48.
Another plausible pathway linking SCFAs and sleep disturbances may be related to another main neuro-
transmitter, noradrenaline. The SCFA propionate activates the Free Fatty Acid Transporter 3 (FFAR3), which
is abundantly expressed in sympathetic g anglia49. Propionate-induced FFAR3 directly promotes noradrenaline
release50,51, which is associated with increases in arousal52. Indeed, insomnia patients showed increased noc-
turnal levels of circulating noradrenaline, which was negatively correlated with sleep e fficiency53. Furthermore,
physiological hyperarousal has been implicated as a mechanism explaining the increased risk of hypertension
in insomnia with objective short sleep duration54,55.
Our findings show that BMI average in the short sleep duration group was significantly higher than in the
normal sleep duration group. These results are consistent with cross-sectional and prospective studies, dem-
onstrating an association between sleep duration and body mass index (BMI) in both children and adults56–59.
Higher BMI in the short sleep duration group may also indicate unidentified sleep apnea60. Indeed, both age and
obesity are significant risk factors for sleep a pnea61. Furthermore, the association between elevated fecal SCFAs
and obesity has been demonstrated in human s tudies62,63. Higher SCFA excretion has been associated with gut
microbiome dysbiosis, obesity, hypertension, and cardiometabolic disease risk factors17. These findings suggest
that SCFAs may play a mediating role in the association between sleep and obesity. High levels of fecal SCFAs
observed in older adults with high BMI and insomnia symptoms may be explained by low SCFA absorption in
epithelial cells in the gut and chronic inflammation. These mechanisms warrant further investigation.
This study has potential limitations. Diagnosis of insomnia focused on nighttime symptoms but did not
include assessment of daytime functioning; thus it does not meet full criteria for insomnia disorder, thereby
limiting generalizability of the findings. However, it has been shown that the negative impact of nighttime sleep
problems on daytime functioning declines with a ge64, suggesting that older adults learn to adapt to their poor
sleep condition and experience less of an impact on their daytime functioning. As this investigation was part of
a major study on insomnia symptoms in older adults, we could not compare SCFA concentrations with a non-
insomnia control group. In addition, the study findings cannot be generalized to younger adults, since aging
may play a role in SCFA concentrations. Moreover, as this was a cross sectional investigation, causality cannot
be inferred. Inflammation parameters, which would allow a better understanding of the mechanisms underly-
ing the observed associations between SCFA concentrations and sleep disturbances, were not assessed. Finally,
volunteers were excluded if they reported sleep apnea and/or PLMS, yet these sleep disorders are underdiagnosed
and thus we cannot rule out their presence in the study sample.
In summary, our results show that short sleep duration in insomnia is associated with an increase in SCFA
concentrations in feces. These results are consistent with the idea that severe insomnia in older adults is
Scientific Reports | (2021) 11:4052 | https://doi.org/10.1038/s41598-021-83389-5 6
Vol:.(1234567890)www.nature.com/scientificreports/
accompanied by a chronic inflammation state, which may affect epithelial cells in the gut and decreased SCFA
uptake. Since SCFAs are essential to gut cell function and brain signaling via neurotransmitters such as seroto-
nin, reduction of SCFA absorption by the gut cells is expected to negatively affect sleep duration and continuity.
Further research is needed to explore this theoretical framework.
Moreover, as SCFAs are products of dietary fiber fermentation in the gut, the development of dietary inter-
ventions based on specific fibers, aimed to ameliorate insomnia and other neurobiological diseases, may prove
to be an interesting and rewarding area of research.
Data availability
The raw data are available from the corresponding author upon request.
Received: 18 August 2020; Accepted: 2 February 2021
References
1. Shochat, T. & Ancoli-Israel, S. Insomnia in Older Adults. In Principles and Practice of Sleep Medicine 6th edn (eds Kryger, M. H.,
Roth, T. & Dement, W. C.) 1544–1550 (Elsevier, St. Louis, 2016).
2. American Psychiatric Association. Diagnostic and Statistical Manual of Mental Disorders (American Psychiatric Association, 2013).
https://doi.org/10.1176/appi.books.9780890425596.
3. Karlson, C. W., Gallagher, M. W., Olson, C. A. & Hamilton, N. A. Insomnia symptoms and well-being: Longitudinal follow-up.
Health Psychol. 32, 311–319 (2013).
4. Zaslavsky, O., LaCroix, A. Z., Hale, L., Tindle, H. & Shochat, T. Longitudinal changes in insomnia status and incidence of physical,
emotional, or mixed impairment in postmenopausal women participating in the Women’s Health Initiative (WHI) study. Sleep
Med. 16, 364–371 (2015).
5. Fernandez-Mendoza, J. et al. Insomnia symptoms with objective short sleep duration are associated with systemic inflammation
in adolescents. Brain Behav. Immun. 61, 110–116 (2017).
6. Vgontzas, A. N. et al. Insomnia with short sleep duration and mortality: The Penn State cohort. Sleep 33, 1159–1164 (2010).
7. Irwin, M. R. Sleep and inflammation: Partners in sickness and in health. Nat. Rev. Immunol. 19, 702–715 (2019).
8. Irwin, M. R., Olmstead, R. & Carroll, J. E. Sleep disturbance, sleep duration, and inflammation: A systematic review and meta-
analysis of cohort studies and experimental sleep deprivation. Biol. Psychiatry 80, 40–52 (2016).
9. Ríos-Covián, D. et al. Intestinal short chain fatty acids and their link with diet and human health. Front. Microbiol. 7, 185 (2016).
10. Koh, A., De Vadder, F., Kovatcheva-Datchary, P. & Bäckhed, F. From dietary fiber to host physiology: Short-chain fatty acids as
key bacterial metabolites. Cell 165, 1332–1345 (2016).
11. Tahara, Y. et al. Gut microbiota-derived short chain fatty acids induce circadian clock entrainment in mouse peripheral tissue. Sci.
Rep. 8, 1395 (2018).
12. Erny, D., Hrabě de Angelis, A. L. & Prinz, M. Communicating systems in the body: How microbiota and microglia cooperate.
Immunology 150, 7–15 (2017).
13. Pluznick, J. L. Microbial short-chain fatty acids and blood pressure regulation. Curr. Hypertens. Rep. 19, 25 (2017).
14. Stilling, R. M. et al. The neuropharmacology of butyrate: The bread and butter of the microbiota–gut–brain axis?. Neurochem. Int.
99, 110–132 (2016).
15. Dalile, B., Van Oudenhove, L., Vervliet, B. & Verbeke, K. The role of short-chain fatty acids in microbiota–gut–brain communica-
tion. Nat. Rev. Gastroenterol. Hepatol. 16, 461–478 (2019).
16. Smith, P. M. et al. The microbial metabolites, short-chain fatty acids, regulate colonic Treg cell homeostasis. Science (New York,
N.Y.) 341, 569–573 (2013).
17. de la Cuesta-Zuluaga, J. et al. Higher fecal short-chain fatty acid levels are associated with gut microbiome dysbiosis, obesity,
hypertension and cardiometabolic disease risk factors. Nutrients 11, 51 (2018).
18. Ferrucci, L. & Fabbri, E. Inflammageing: Chronic inflammation in ageing, cardiovascular disease, and frailty. Nat. Rev. Cardiol.
15, 505–522 (2018).
19. Müller, L., Di Benedetto, S. & Pawelec, G. The immune system and its dysregulation with aging. Subcell Biochem. 91, 21–43 (2019).
20. Buford, T. W. Hypertension and aging. Ageing Res. Rev. 26, 96–111 (2016).
21. Vogt, J. A. & Wolever, T. M. S. Fecal acetate is inversely related to acetate absorption from the human rectum and distal colon. J.
Nutr. 133, 3145–3148 (2003).
22. Silva, Y. P., Bernardi, A. & Frozza, R. L. The role of short-chain fatty acids from gut microbiota in gut–brain communication. Front.
Endocrinol. 11, 25 (2020).
23. Nautiyal, K. M. & Hen, R. Serotonin receptors in depression: From A to B. F1000Research 6, 123 (2017).
24. Gibson, E. L. Tryptophan supplementation and serotonin function: Genetic variations in behavioural effects. Proc. Nutr. Soc. 77,
174–188 (2018).
25. Jouvet, M. Sleep and serotonin: An unfinished story. Neuropsychopharmacology 21, 24S-27S (1999).
26. Monti, J. M. Serotonin control of sleep–wake behavior. Sleep Med. Rev. 15, 269–281 (2011).
27. Szentirmai, É., Millican, N. S., Massie, A. R. & Kapás, L. Butyrate, a metabolite of intestinal bacteria, enhances sleep. Sci. Rep. 9,
7035 (2019).
28. Heath, A.-L.M. et al. Association between the faecal short-chain fatty acid propionate and infant sleep. Eur. J. Clin. Nutr. 74,
1362–1365 (2020).
29. Frost, G. et al. The short-chain fatty acid acetate reduces appetite via a central homeostatic mechanism. Nat. Commun. 5, 3611
(2014).
30. Spiegelhalder, K. et al. Magnetic resonance spectroscopy in patients with insomnia: A repeated measurement study. PLoS ONE
11, e0156771 (2016).
31. Riemann, D. et al. The hyperarousal model of insomnia: A review of the concept and its evidence. Sleep Med. Rev. 14, 19–31 (2010).
32. Plante, D. T., Jensen, J. E., Schoerning, L. & Winkelman, J. W. Reduced γ-aminobutyric acid in occipital and anterior cingulate
cortices in primary insomnia: A link to major depressive disorder?. Neuropsychopharmacology 37, 1548–1557 (2012).
33. Meyerhoff, D. J., Mon, A., Metzler, T. & Neylan, T. C. Cortical gamma-aminobutyric acid and glutamate in posttraumatic stress
disorder and their relationships to self-reported sleep quality. Sleep 37, 893–900 (2014).
34. Yamawaki, Y. et al. Sodium butyrate abolishes lipopolysaccharide-induced depression-like behaviors and hippocampal microglial
activation in mice. Brain Res. 1680, 13–38 (2018).
35. Yu, L. et al. Beneficial effect of GABA-rich fermented milk on insomnia involving regulation of gut microbiota. Microbiol. Res.
233, 126409 (2020).
36. Pamboro, E. L. S., Brown, E. B. & Keene, A. C. Dietary fatty acids promote sleep through a taste-independent mechanism. Genes
Brain Behav. 19, e12629 (2020).
Scientific Reports | (2021) 11:4052 | https://doi.org/10.1038/s41598-021-83389-5 7
Vol.:(0123456789)www.nature.com/scientificreports/
37. Fernandez-Mendoza, J. & Vgontzas, A. N. Insomnia and its impact on physical and mental health. Curr. Psychiatry Rep. 15, 418
(2013).
38. Kalmbach, D. A., Pillai, V., Arnedt, J. T. & Drake, C. L. DSM-5 insomnia and short sleep: Comorbidity landscape and racial dispari-
ties. Sleep 39, 2101–2111 (2016).
39. Vgontzas, A. N., Fernandez-Mendoza, J., Liao, D. & Bixler, E. O. Insomnia with objective short sleep duration: The most biologi-
cally severe phenotype of the disorder. Sleep Med. Rev. 17, 241–254 (2013).
40. Jarrin, D. C. et al. Cardiovascular autonomic dysfunction in insomnia patients with objective short sleep duration. J. Sleep Res. 27,
e12663 (2018).
41. Fernandez-Mendoza, J. et al. Insomnia with objective short sleep duration is associated with cognitive impairment: A first look at
cardiometabolic contributors to brain health. Sleep https://doi.org/10.1093/sleep/zsaa150 (2020).
42. Lichstein, K. L., Durrence, H. H., Taylor, D. J., Bush, A. J. & Riedel, B. W. Quantitative criteria for insomnia. Behav. Res. Ther. 41,
427–445 (2003).
43. Buysse, D. J., Ancoli-Israel, S., Edinger, J. D., Lichstein, K. L. & Morin, C. M. Recommendations for a standard research assessment
of insomnia. Sleep 29, 1155–1173 (2006).
44. Kukull, W. A. et al. The Mini-Mental State Examination score and the clinical diagnosis of dementia. J. Clin. Epidemiol. 47,
1061–1067 (1994).
45. Zhao, G., Nyman, M. & Jönsson, J. A. Rapid determination of short-chain fatty acids in colonic contents and faeces of humans and
rats by acidified water-extraction and direct-injection gas chromatography. Biomed. Chromatogr. 20, 674–682 (2006).
46. Samson, F. E. & White, R. P. Effects of fatty acid anions on the electroencephalogram of unanesthetized rabbits. Am. J. Physiol.
186, 271–274 (1956).
47. Matsuzaki, M. & Takagi, H. Sleep induced by sodium butyrate in the cat. Brain Res. 4, 206–222 (1967).
48. Bohórquez, D. V. & Liddle, R. A. The gut connectome: Making sense of what you eat. J. Clin. Investig. 125, 888–890 (2015).
49. Kimura, I. et al. The gut microbiota suppresses insulin-mediated fat accumulation via the short-chain fatty acid receptor GPR43.
Nat. Commun. 4, 1829 (2013).
50. Inoue, D. et al. Short-chain fatty acid receptor GPR41-mediated activation of sympathetic neurons involves synapsin 2b phospho-
rylation. FEBS Lett. 586, 1547–1554 (2012).
51. Ichimura, A., Hasegawa, S., Kasubuchi, M. & Kimura, I. Free fatty acid receptors as therapeutic targets for the treatment of diabetes.
Front. Pharmacol. 5, 236 (2014).
52. Berridge, C. W. Noradrenergic modulation of arousal. Brain Res. Rev. 58, 1–17 (2008).
53. Irwin, M., Clark, C., Kennedy, B., Christian Gillin, J. & Ziegler, M. Nocturnal catecholamines and immune function in insomniacs,
depressed patients, and control subjects. Brain Behav. Immun. 17, 365–372 (2003).
54. Bathgate, C. J. & Fernandez-Mendoza, J. Insomnia, short sleep duration, and high blood pressure: Recent evidence and future
directions for the prevention and management of hypertension. Curr. Hypertens. Rep. 20, 52 (2018).
55. Bathgate, C. J., Edinger, J. D., Wyatt, J. K. & Krystal, A. D. Objective but not subjective short sleep duration associated with increased
risk for hypertension in individuals with insomnia. Sleep 39, 1037–1045 (2016).
56. Vorona, R. D. et al. Overweight and obese patients in a primary care population report less sleep than patients with a normal body
mass index. Arch. Intern. Med. 165, 25–30 (2005).
57. Hasler, G. et al. The association between short sleep duration and obesity in young adults: A 13-year prospective study. Sleep 27,
661–666 (2004).
58. Gupta, N. K., Mueller, W. H., Chan, W. & Meininger, J. C. Is obesity associated with poor sleep quality in adolescents?. Am. J. Hum.
Biol. 14, 762–768 (2002).
59. López-García, E. et al. Sleep duration, general and abdominal obesity, and weight change among the older adult population of
Spain. Am. J. Clin. Nutr. 87, 310–316 (2008).
60. Pillar, G. & Shehadeh, N. Abdominal fat and sleep apnea: The chicken or the egg?. Diabetes Care 31(Suppl 2), S303–S309 (2008).
61. Senaratna, C. V. et al. Prevalence of obstructive sleep apnea in the general population: A systematic review. Sleep Med. Rev. 34,
70–81 (2017).
62. Schwiertz, A. et al. Microbiota and SCFA in lean and overweight healthy subjects. Obesity (Silver Spring, Md.) 18, 190–195 (2010).
63. Teixeira, T. F. S. et al. Higher level of faecal SCFA in women correlates with metabolic syndrome risk factors. Br. J. Nutr. 109,
914–919 (2013).
64. Kierlin, L., Olmstead, R., Yokomizo, M., Nicassio, P. & Irwin, M. R. Diagnostic and Statistical Manual criteria for insomnia related
impairment in daytime functioning: Polysomnographic correlates in older adults. Sleep Med. 13, 958–960 (2012).
Author contributions
Conceptualization: T.S., S.T., I.H., M.A. Methodology and formal analysis: F.M., C.E., K.A., T.S., S.T. Writing
(original draft): F.M., T.S., K.A., S.T. Writing (review and editing): F.M., T.S., S.T., I.H., M.A.
Competing interests
The authors declare no competing interests.
Additional information
Correspondence and requests for materials should be addressed to F.M.
Reprints and permissions information is available at www.nature.com/reprints.
Publisher’s note Springer Nature remains neutral with regard to jurisdictional claims in published maps and
institutional affiliations.
Open Access This article is licensed under a Creative Commons Attribution 4.0 International
License, which permits use, sharing, adaptation, distribution and reproduction in any medium or
format, as long as you give appropriate credit to the original author(s) and the source, provide a link to the
Creative Commons licence, and indicate if changes were made. The images or other third party material in this
article are included in the article’s Creative Commons licence, unless indicated otherwise in a credit line to the
material. If material is not included in the article’s Creative Commons licence and your intended use is not
permitted by statutory regulation or exceeds the permitted use, you will need to obtain permission directly from
the copyright holder. To view a copy of this licence, visit http://creativecommons.org/licenses/by/4.0/.
© The Author(s) 2021
Scientific Reports | (2021) 11:4052 | https://doi.org/10.1038/s41598-021-83389-5 8
Vol:.(1234567890)You can also read