SMALL AND MEDIUM-SIZED ENTERPRISES - MARKET INTELLIGENCE REPORT Q3 2021 - ABC Business
←
→
Page content transcription
If your browser does not render page correctly, please read the page content below
Licensed REA 2008

SMALL AND MEDIUM-SIZED
ENTERPRISES

MARKET INTELLIGENCE REPORT
Q3 - 2021
EXECUTIVE SUMMARY

This is our fourth Market Intelligence Report (1st was
Oct-20) and the same trends have held true for the last
twelve months. The business sales market is continuing to
experience a significant gap between supply and demand
and this has remained the case in the last six months.

Demand data points, such as signed confidentiality
agreements by prospective buyers and website traffic
patterns, are showing significant increases (>25%) compared
to the same period last year.

Supply data points, such as new businesses listed for sale,
are showing material decreases (10%-15%) both at a total
market level and ABC level. This is evidenced in this report
by the following tables and graphs.

The excess demand and reduced supply characteristics
of the current market have resulted in elevated prices for
businesses in all industries.

Latest lockdown effects and 2022 Projections for Business Sales

                        This report includes numbers up to October-21 and hence reflects only two months
                        of the current lockdown so the results have not been heavily skewed by this
                        recent event. History has shown us that the majority of businesses and financial
                        markets bounce back following a sustained period of below normal economic
                        activity driven by lockdowns. We are expecting the same pattern to be evident
                        post this lockdown with pent up demand fueling increased economic activity in
                        December-21 and beyond.

                        With a high probability of lockdowns no longer being part of the NZ in 2022
                        and overseas travel likely to be possible by the first quarter of 2022 we believe
                        many business owners will take the opportunity to sell their businesses. Increased
                        certainty will provide investors more confidence to invest in business ownership
                        and vendors will have more motivation to sell given the increased travel & leisure
                        options available to them, this is particularly relevant to the baby boomers who
                        currently own the majority of NZ’s privately owned businesses. We believe 2022
                        has the potential to be a record year for business sales given an element of pent-up
                        supply caused by business owners who weren’t comfortable selling their business
                        in a COVID environment. The bounce back to more normal economic settings in
                        2022 will provide more confidence & certainty to both sellers and purchasers and
ABC Business Sales,
                        in our view result in more transactions occurring.
we’ll take you there.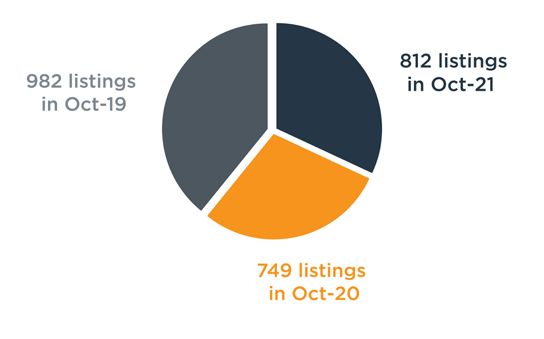
Signed Confidentiality Agreements
              Per Month
                                               DEMAND DATA POINTS
 Month      2019/20   2020/21   % Change

November     1047      1334       27%                 SIGNED CONFIDENTIALITY
December      757      1267       67%                           AGREEMENTS
 January     943       1653       75%
                                           Signed confidentiality agreements completed by potential
February     1190      1379       16%
                                           purchasers have increased by 26% when comparing the
  March       861      1493       73%      twelve months to October-21.
  April      684       1212       77%
                                           Enquiry levels accelerated to exceed the previous year and
  May        1127      1473       31%
                                           this is driven by the four key demand factors at play:
  June       1285      1542       20%
                                           • Returning expats
  July       1392      1432       3%       • High amounts of domestic and international capital
 August      1287      1254       -3%       circulating in the system looking for attractive yields and
                                            returns
September    1160       1111      -4%
                                           • COVID has made many people re-think their working and
 October     1315      1235       -6%
                                            living situation and has resulted in business ownership
  Total     13,048    16,385      26%       becoming a popular alternative to the standard salary/
                                            employee option.
                                           • Low interest rates have made business ownership a more
                                            attractive investment
DEMAND STILL
CURRENTLY
OUTWEIGHS
SUPPLY
Increase in domestic Business ownership
& international capital becoming more popularDEMAND DATA POINTS
MONTHLY WEBSITE
TRAFFIC - ABC WEBSITE
This chart shows the monthly website traffic to the ABC
website - a measure of people investigating business
ownership.
The twelve months to October-21 shows a 50% increase in
visitor traffic to our ABC Business Sales website compared
to last year.
The ABC website had a total of 327,466 visitors for the
last twelve months - up from 217,895 for the same period
in the last financial year.SUPPLY DATA POINTS BUSINESSES LISTED FOR SALE - TRADEME This chart looks at the trend of businesses listed for sale across New Zealand via TradeMe. As you can see, there is a negative trend which shows a decline in businesses coming to market which started in April-20 post-COVID-19. For the 12 months to October-20, the average listings on the website were 4,805 this has declined by 11% as the average listings were 4,256 for the 12 months to October-21.
SUPPLY DATA POINTS
                                NEW LISTINGS

ABC has experienced a 17% decrease in new business listings
for the 12 months to October 2021 when compared to
October-19.

In total, we have had 812 new businesses listed for sale for
the twelve months to July 2021 vs 982 new listings for the
October-19 period.

We believe a comparison to Oct-19 is a more accurate picture
of current market conditions given the Oct-20 period was
heavily influenced by COVID particularly April/May-20 when
the country and all business activity ground to a halt.
ABC COMPLETED BUSINESS SALES VOLUMES PER LOCATION As per the graph, completed business sales volumes for 12 months to October 2021 are up 42% compared to October-20 and 21% compared to October-19. This is the result of a very strong market where the majority of businesses listed for sale are being sold. A number of businesses are being sold at above asking price and getting multiple offers before the full marketing campaign takes place. There is no doubt we are currently in a “Seller Market” given the dynamics at play and it is following very similar trend to the housing market which shows listings are at all-time lows. For the twelve months to October 2021, ABC sold 461 vs total listings of 821 equating to a conversion rate of 57%, this is a record rate given historically conversion rates have been in the region of 35-40%. The high conversion rate, reiterates the trend we are in a sellers market with the majority of businesses coming to market being sold.
BUSINESS                                    Divisions            Oct-19        Oct-20           Oct-21       Oct-21 vs Oct-20   Oct-21 vs Oct-19

PRICE
                                     General Business Avge
                                                                $628,491      $653,834         $749,729            15%                19%
                                             Price

TRENDS
                                    Hospitality Business Avge
                                                                $192,821       $196,635        $243,952            24%                27%
                                               Price

 Here’s what this table tells us:

 Overall, the average price for SME businesses ($0-$5m) excluding Hospitality has increased by 15% for the 12 months to October 2021. The
 15% price increase has been driven by a buoyant market with demand exceeding supply for quality businesses and forcing purchasers to
 pay higher prices. A number of other data sources (Recent PWC M&A Report) endorse this trend of business assets increasing in value
 and are all driven by the same factors; increased buyer demand chasing a scarcity in supply of quality businesses. The increased demand is
 driven by investors chasing higher yields and an abundance of capital in the hands of retail and wholesale investors.

 The average price for Hospitality businesses ($0-$5m) has seen a 24% increase for the 12 months to October 2021. It has been well
 documented the adverse effects COVID has caused this industry in the initial lockdowns which form part of the October-20 numbers. It
 must also be taken into account that this data is for the period up to October-21 and hence is not materially affected by the latest lock
 down. The 2021 year up to August had shown a material pick up for hospitality revenues and profits and this has been reflected in the
 business sales numbers. We believe Hospitality will bounce back strongly in December-21 when the sector is likely to re-open.

 The data set used for the average price calculations are all the transactions completed by the ABC Group in the $0-$5m price range. It
 should be noted the ABC Group has approximately 35%-40% market share of this segment and hence this data is regarded as accurate and
 meaningful.

 The proportion of NZ businesses in the $0-$5m segment is approximately 89% of all businesses in New Zealand. As per Stats NZ, 189,384
 entities have 1 employee or more and 167,790 of these entities have between 1 - 19 employees; the majority of the businesses with 1-19
 employees would be valued between $0-$5m.
Bank Term Deposit Rates vs
Privately Owned Business Returns
Segment Oct-21 Avge Return % Return
General Business Avge
$749,729 $214,208 29%
Price (NZ)
Cash invested in
$749,729 $14,995 2%
Bank Term Deposits
The average business price is currently $749,729 and based on an EBITDA market average multiplier of 3.5x the pre-tax yield equates to 29%.
The average term deposit rate with one of New Zealand’s major banks for one year is currently 2.0% and if interest rates continue to increase, this rate
is forecasted to be at 3.0% by the end of 2022.
Clearly, there is a material difference in the annual yields, with private business ownership returns being 14.3 times higher than current term deposit
rates. This analysis excludes any capital gains for business ownership. The pre-tax profit for business ownership is based on the company being fully
managed with limited input from the investor.
It needs to be acknowledged that private business ownership has a higher risk profile than investing in bank term deposits, but we don’t believe the
risk premium for investing in a private business should be 1,430% higher than term deposits.
Based on this data we expect business values to continue growing and more investors to realize this asset class can be extremely rewarding and
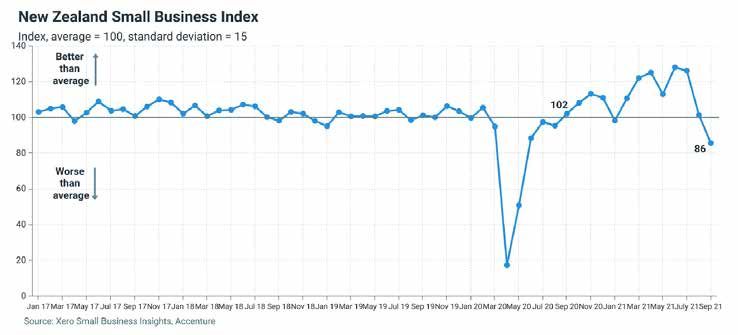
lucrative.Xero Small Business Index
NZ Monthly Update Sept 2021
The New Zealand Small Business Index, part of Xero Small Business Insights, fell 16 points Small business sales fell 7.1% y/y, the weakest result since May 2020.
in September to 86 points. This is the third consecutive monthly fall, the lowest level
since May 2020 and the first time the Index has been below 100 (representing average The decline was led by Auckland, where sales fell 18.4% y/y. This was the weakest result
conditions) since January 2021. The decline was led by Auckland, which spent most of the since April 2020 for the region, although considerably better than the 44.4% y/y fall in
month under strict Level 4 lockdown. Alert Levels eased during September for the rest of sales in April 2020. This was partially offset by rises in other major cities, less impacted by
New Zealand, which helped sales and jobs outside Auckland. But this was not enough to restrictions, such as Canterbury (+3.3% y/y) and Wellington (+2.1% y/y).
counter the impact of the strict conditions in the country’s largest city.
Most industries recorded a fall in sales, led by hospitality (-16.8% y/y) and construction
The drop in the Index in September was driven by a 7.1% y/y decline in sales. Jobs growth (-12.9% y/y). Only professional services recorded positive growth of +0.3% y/y - reflecting
also slowed during the month, to be 3.3% y/y after being above 5% y/y for the previous its work-from-home capability.
four months. Time to be paid also dragged on the Index, rising 1.8 days to 26.2 days.
Auckland, which is almost 40% of the national economy, was the weakest region. Sales
fell 18.4% y/y, jobs rose just 0.7% y/y and time to be paid increased by 4.4 days. Looking
ahead, Auckland’s move to Alert Level 3 on September 21 should provide some modest
relief for those small businesses able to re-open in October.
* Data taken from Xero Small Business Index New Zealand Monthly Update September 2021Jobs growth slowest since February
Jobs rose just 3.3% y/y in September, the slowest pace of growth since February 2021. This
follows four months of national jobs gains above 5% y/y. Auckland was the softest region,
where jobs rose just 0.7% y/y. In contrast, other regions continued to record above average
rises - such as Wellington (+7.0% y/y), Waikato (+6.1% y/y) and Canterbury (+5.4% y/y).
There were also differences across industries. Hospitality jobs fell 7.9% y/y. But this was
offset by still strong results for professional services (+10.8% y/y), manufacturing (+8.1%
y/y) and retail trade (+5.6% y/y).
Wages growth around
recent highs
Wages rose 4.5% y/y, up marginally
from 3.8% y/y in August (last
month was still adjusted for base
effects). Wages growth was still
soft in September 2020, at just
Time to be paid longest since June 2020 2.2% y/y, so this latest result is still
slightly inflated due to base effects.
New Zealand small businesses waited an average of 26.2 days to be paid in September. Nevertheless, wages growth has
This is 1.8 days longer than in August and 2.7 days longer than in July. This metrics is now clearly been accelerating in 2021 and
at its highest level since June 2020, although it is still below the peak of 30.7 days set in is above its long term average of
April 2020. The rise in wait times was again driven by Auckland small businesses, which 3.9% y/y.
saw an increase of 4.4 days to 29.6 days. In contrast, Wellington small businesses were
the quickest to be paid at 23.3 days, a rise of 0.9 days. The late payments measure, which
tracks the average number of days late that invoices are paid, pushed out to 8.2 days
which is also the longest since June 2020.
* Data taken from Xero Small Business Index New Zealand Monthly Update September 2021AUSTRALIA
CURRENT ACTIVITY IN THE
SMALL BUSINESS SECTOR
The current activity in the small business sector in Australia has bounced back more quickly than New Zealand in regards to listings with an annual growth rate of 5.62%. Australian
business brokers have stated the increased listings are largely due to a recovering economy that has translated to improved financial performances for many business owners.
Business owners are now more willing to enter a sales process given their most recent financials are showing a stronger performance (this was not the case twelve months ago).
Businesses in Demand Difficult to Sell
Number of Australian • Accountancy Practices • General Retail
Businesses Listed For Sale • Larger GP and Dental Practices • Clothing Boutiques
(in states not impacted by COVID-19 lockdowns) • Bookstores
Sep 20 Sep 21 % Change
• Caravan Parks (Large, profits over $400,000) • News Agencies
NSW 3335 3397 1.31%
• Service (5 Days) • Lotto Kiosks
VIC 4771 4931 3.35% • Travel Agencies
• Online businesses / work from home
SA 244 277 13.52% • Information Technology Businesses • Non- Franchise Bakery
TAS 96 128 33.33% (with strong maintenance contracts) • Profits less than $100,000
QLD 2067 2270 9.82% • Manufacturing – selected sectors • Business types that were forced to shut down
• Labour Hire due to the Coronavirus.
WA 544 680 25%
• Supermarkets
NT 36 56 55.56%
• Service Stations
ACT 79 80 1.27%
• Business types that have been resilient to COVID-19
Australia 11,190 11,819 5.62%
* Data taken from Jarot Business Valuations / Business Values NewsletterAUTHORS CHRIS SMALL Managing Director • Former Head of ASB Regional Corporate Banking • Completed over 100 M&A deals in the corporate and commercial banking market • Twenty years of experience in the banking sector 021 996 834 chriss@abcbusiness.co.nz STEVE SMITH Chief Executive Officer • Founder and CEO of ABC Business Sales • An associate of the Real Estate Institute of New Zealand 021 940 779 steves@abcbusiness.co.nz
You can also read