Small and Mid-Cap Resources - March 2017 Review The Momentum Continues - 2017 to be a Good Year
←
→
Page content transcription
If your browser does not render page correctly, please read the page content below
Small and Mid-Cap Resources
                  March 2017 Review

              The Momentum Continues
                - 2017 to be a Good Year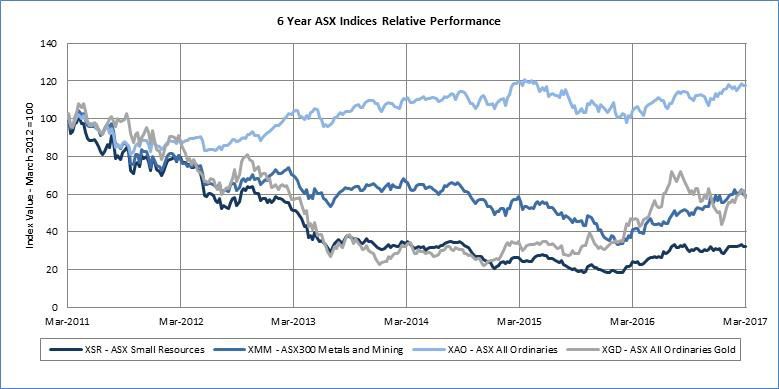
WHO IS IIR?
   Independent Investment Research, “IIR”, is an independent investment research house based in Australia and the United States. IIR specialises in the analysis of high quality commissioned research for
   Brokers, Family Offices and Fund Managers. IIR distributes its research in Asia, United States and the Americas. IIR does not participate in any corporate or capital raising activity and therefore it does
   not have any inherent bias that may result from research that is linked to any corporate/ capital raising activity.
   IIR was established in 2004 under Aegis Equities Research Group of companies to provide investment research to a select group of retail and wholesale clients. Since March 2010, IIR (the Aegis Equities
   business was sold to Morningstar) has operated independently from Aegis by former Aegis senior executives/shareholders to provide clients with unparalleled research that covers listed and unlisted
   managed investments, listed companies, structured products, and IPOs.
   IIR takes great pride in the quality and independence of our analysis, underpinned by high caliber staff and a transparent, proven and rigorous research methodology.

INDEPENDENCE OF RESEARCH ANALYSTS
Research analysts are not directly supervised by personnel from other areas of the Firm whose interests or functions may conflict with those of the research analysts. The evaluation and appraisal of research
analysts for purposes of career advancement, remuneration and promotion is structured so that non-research personnel do not exert inappropriate influence over analysts.
Supervision and reporting lines: Analysts who publish research reports are supervised by, and report to, Research Management. Research analysts do not report to, and are not supervised by, any sales personnel
nor do they have dealings with Sales personnel
Evaluation and remuneration: The remuneration of research analysts is determined on the basis of a number of factors, including quality, accuracy and value of research, productivity, experience, individual
reputation, and evaluations by investor clients.

INDEPENDENCE – ACTIVITIES OF ANALYSTS
IIR restricts research analysts from performing roles that could prejudice, or appear to prejudice, the independence of their research.
Pitches: Research analysts are not permitted to participate in sales pitches for corporate mandates on behalf of a Broker and are not permitted to prepare or review materials for those pitches. Pitch materials
by investor clients may not contain the promise of research coverage by IIR.
No promotion of issuers’ transactions: Research analysts may not be involved in promotional or marketing activities of an issuer of a relevant investment that would reasonably be construed as representing
the issuer. For this reason, analysts are not permitted to attend “road show” presentations by issuers that are corporate clients of the Firm relating to offerings of securities or any other investment banking
transaction from that our clients may undertake from time to time. Analysts may, however, observe road shows remotely, without asking questions, by video link or telephone in order to help ensure that they
have access to the same information as their investor clients.
Widely-attended conferences: Analysts are permitted to attend and speak at widely-attended conferences at which our firm has been invited to present our views. These widely-attended conferences may
include investor presentations by corporate clients of the Firm.
Other permitted activities: Analysts may be consulted by Firm sales personnel on matters such as market and industry trends, conditions and developments and the structuring, pricing and expected market
reception of securities offerings or other market operations. Analysts may also carry out preliminary due diligence and vetting of issuers that may be prospective research clients of ours.

INDUCEMENTS AND INAPPROPRIATE INFLUENCES
IIR prohibits research analysts from soliciting or receiving any inducement in respect of their publication of research and restricts certain communications between research analysts and personnel from other
business areas within the Firm including management, which might be perceived to result in inappropriate influence on analysts’ views.
Remuneration and other benefits: IIR procedures prohibit analysts from accepting any remuneration or other benefit from an issuer or any other party in respect of the publication of research and from offering
or accepting any inducement (including the selective disclosure by an issuer of material information not generally available) for the publication of favourable research. These restrictions do not preclude the
acceptance of reasonable hospitality in accordance with the Firm’s general policies on entertainment, gifts and corporate hospitality.

DISCLAIMER
This publication has been prepared by Independent Investment Research (Aust) Pty Limited trading as Independent Investment Research (“IIR”) (ABN 11 152 172 079), an corporate authorised representative of
Australian Financial Services Licensee (AFSL no. 410381. IIR has been commissioned to prepare this independent research report (the “Report”) and will receive fees for its preparation. Each company specified
in the Report (the “Participants”) has provided IIR with information about its current activities. While the information contained in this publication has been prepared with all reasonable care from sources that IIR
believes are reliable, no responsibility or liability is accepted by IIR for any errors, omissions or misstatements however caused. In the event that updated or additional information is issued by the “Participants”,
subsequent to this publication, IIR is under no obligation to provide further research unless commissioned to do so. Any opinions, forecasts or recommendations reflects the judgment and assumptions of IIR as
at the date of publication and may change without notice. IIR and each Participant in the Report, their officers, agents and employees exclude all liability whatsoever, in negligence or otherwise, for any loss
or damage relating to this document to the full extent permitted by law. This publication is not and should not be construed as, an offer to sell or the solicitation of an offer to purchase or subscribe for any
investment. Any opinion contained in the Report is unsolicited general information only. Neither IIR nor the Participants are aware that any recipient intends to rely on this Report or of the manner in which a
recipient intends to use it. In preparing our information, it is not possible to take into consideration the investment objectives, financial situation or particular needs of any individual recipient. Investors should
obtain individual financial advice from their investment advisor to determine whether opinions or recommendations (if any) contained in this publication are appropriate to their investment objectives, financial
situation or particular needs before acting on such opinions or recommendations. This report is intended for the residents of Australia. It is not intended for any person(s) who is resident of any other country. This
document does not constitute an offer of services in jurisdictions where IIR or its affiliates do not have the necessary licenses. IIR and/or the Participant, their officers, employees or its related bodies corporate
may, from time to time hold positions in any securities included in this Report and may buy or sell such securities or engage in other transactions involving such securities. IIR and the Participant, their directors
and associates declare that from time to time they may hold interests in and/or earn brokerage, fees or other benefits from the securities mentioned in this publication.
IIR, its officers, employees and its related bodies corporate have not and will not receive, whether directly or indirectly, any commission, fee, benefit or advantage, whether pecuniary or otherwise in connection
with making any statements and/or recommendation (if any), contained in this Report. IIR discloses that from time to time it or its officers, employees and related bodies corporate may have an interest in the
securities, directly or indirectly, which are the subject of these statements and/or recommendations (if any) and may buy or sell securities in the companies mentioned in this publication; may affect transactions
which may not be consistent with the statements and/or recommendations (if any) in this publication; may have directorships in the companies mentioned in this publication; and/or may perform paid services
for the companies that are the subject of such statements and/or recommendations (if any).

However, under no circumstances has IIR been influenced, either directly or indirectly, in making any statements and/or recommendations (if any) contained in this Report. The information contained in this
publication must be read in conjunction with the Legal Notice that can be located at http://www.independentresearch.com.au/Public/Disclaimer.aspx.

THIS IS A THIS IS NOT A COMMISSIONED RESEARCH REPORT. NO FEES OR COMMISSIONS WERE PAID TO IIR FOR THE PREPARATION OF THIS REPORT INCLUDING COMPANY PROFILES. THIS REPORT
WAS PUBLISHED WITH THE ASSISTANCE OF THE 121 GROUP COMMISSIONED RESEARCH REPORT.
IIR Resources Blue Book Series

Contents
   Introduction ...........................................................................1   Kibaran Resources Limited .................................................34
   So What Does 2017 Hold?.....................................................1               Kodal Minerals Plc...............................................................35
   The Resources Sector............................................................1           Kore Potash Limited.............................................................36
   Gold and Silver.......................................................................3     Lithium Australia..................................................................37
   Base Metals...........................................................................4     Lucapa Diamond Company Limited......................................38
   Other Commodities................................................................5          Manas Resources Limited....................................................39
   Bulk Commodities..................................................................6         Metallon Corporation...........................................................40
   Jurisdictions...........................................................................6   Mariana Resources..............................................................41
   In Conclusion..........................................................................6    Minbos Resources Limited...................................................42
                                                                                               MOD Resources Limited......................................................43
   Resources Companies
                                                                                               Nevsun Resources................................................................44
   Aeris Resources Limited .......................................................7
                                                                                               New Age Metals..................................................................45
   African Energy Resources Limited ........................................8
                                                                                               Nzuri Copper Limited............................................................46
   Anova Metals Limited............................................................9
                                                                                               Oklo Resources Limited........................................................47
   Apollo Consolidated.............................................................10
                                                                                               OreCorp Limited...................................................................48
   Ariana Resources PLC..........................................................11
                                                                                               Orion Gold............................................................................49
   Auroch Minerals...................................................................12
                                                                                               Perseus Mining Limited.......................................................50
   Base Resources....................................................................13
                                                                                               Petra Diamonds....................................................................51
   Battery Minerals Limited.....................................................14
                                                                                               Plateau Uranium...................................................................52
   Berkeley Energia..................................................................15
                                                                                               Plymouth Minerals...............................................................53
   Bezant Resources Plc...........................................................16
                                                                                               Predictive Discovery Limited................................................54
   Black Rock Mining................................................................17
                                                                                               Premier African Minerals Limited........................................55
   Bushveld Minerals...............................................................18
                                                                                               Resolute Mining Limited......................................................56
   Caledonia Mining Corporation.............................................19
                                                                                               Sarama Resources Ltd. .......................................................57
   Cardinal Resources Limited.................................................20
                                                                                               Shanta Gold Limited ............................................................58
   Centamin plc........................................................................21
                                                                                               Sipa Resources Limited........................................................59
   CopperZone Resources/Kalahari Copper.............................22
                                                                                               Sovereign Metals Limited....................................................60
   Endeavour Mining................................................................23
                                                                                               Stonewall Resources Limited..............................................61
   Energizer Resources Inc. .....................................................24
                                                                                               Strandline Resources Limited..............................................62
   GB Minerals Ltd...................................................................25
                                                                                               Strongbow Exploration Inc. .................................................63
   Gem Diamonds Limited........................................................26
                                                                                               Teranga Gold Corporation....................................................64
   Gemfields PLC......................................................................27
                                                                                               Thani Stratex Resources Ltd................................................65
   Geopacific Resources Limited..............................................28
                                                                                               Tharisa plc............................................................................66
   Graphex Mining Limited.......................................................29
                                                                                               Volcanic Gold Mines Inc (TSE VG).......................................67
   Gryphon Melanesia Pty Ltd .................................................30
                                                                                               Walkabout Resources Ltd (ASX: WKT)................................68
   Harvest Minerals..................................................................31
                                                                                               West African Resources Ltd (ASX: WAF; TSE WAF)...........69
   Hummingbird Resources Plc................................................32
   Jinchuan Group International Resources Co. Ltd ...............33

                                                                                                                                                                                  iii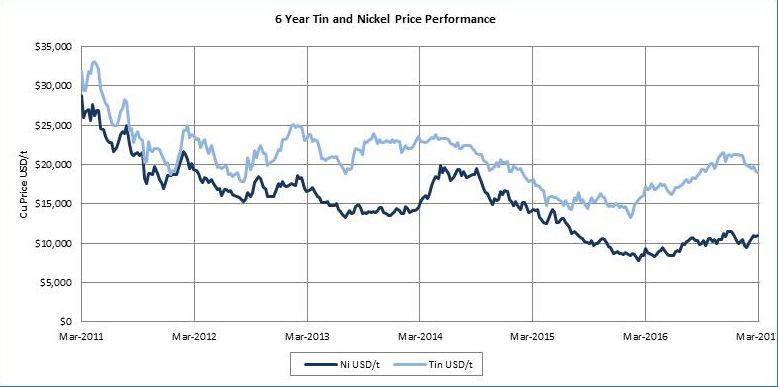
IIR Resources Blue Book Series
Introduction
Welcome to IIR’s second “Blue Book” for Junior Resource Companies. This publication covers over 60 resource companies that
were present at the 121 Group’s 2017 Cape Town Conference, held at Welgemeende in the Gardens district on February 6-7, 2016.
The summaries in the book have been prepared with the assistance of the 121 Group based in London/ Hong Kong and Gavin
Wendt from Minelife in Sydney, with the introduction being prepared by Mark Gordon and Gavin Wendt. The company information
is accurate as at the time of the conference – and further information on the companies can be provided upon request.
The aim of this volume is to present a portfolio of companies that we consider to have merit and are worthy of further
consideration by prospective investors. We do not provide recommendations, nor do we rank companies.
As with the first book, released after the 121 Group’s 2016 Hong Kong Conference, the companies included in this edition cover
the spectrum from explorers to operators in a number of commodities and jurisdictions, and thus offer different risk profiles
– not all of which will be suitable for all investors. We ourselves are commodity, and to an extent jurisdiction-agnostic – given
the right management and the right project in a manageable jurisdiction, good returns can be made no matter the commodity.
Our experience over the years has shown that competent management is the key factor to a company achieving its goals for
shareholders.
The portfolio also includes past and present IIR clients - some of the companies that we profile in this Blue Book series have full
research coverage by our firm.
Some of the comments below may seem ASX-centric, however given that over 50% of these companies are listed on the ASX
(~75% are ASX or TSX-listed and with both exchanges having a strong resources focus), we feel this is appropriate and generally
representative of the sector as a whole. The LSE main and AIM boards were also well represented, with 14 companies attending.
So What Does 2017 Hold?
Although we discuss this in more detail below, what does 2017 hold for the markets and metals following a very positive
2016? In our view the resources sector, particularly in the non-bulks and junior sectors, will continue to remain strong,
with metals prices and sentiment remaining robust.
We saw the post-election “Trump Effect” giving a spur to base metals prices and weighing on gold prices, however
gold has now recovered, as well as copper recovering after a correction following the election spike. What needs to be
remembered are that markets and metals prices are also dependent on a number of factors (particularly China), other than
what may potentially happen in the USA.
Key commodities to watch in 2017 include gold, lithium, graphite, nickel and zinc; however the other base and precious
metals, including copper, tin and silver are not to be discounted given solid gains in the prices of these metals.
On forecasting medium term prices for the major base and precious metals, our view is that gold will trade above
US$1,200/oz, and possibly up to US$1,500/oz, around or up from the current price of US$1,250/oz. We have revised
our view and see copper trading at or above US$5,800/tonne (with our floor forecast down from the current price of
US$6,000/tonne, but up from our previous US$5,500/tonne) and zinc conservatively trading around US$2,200-US$2,400/
tonne (again down from the current US$2,800/tonne) through 2017.
On the battery/specialty metals side we see lithium trading at around US$8,000 to US$10,000/tonne LCE – this may in
fact be conservative, with both demand and supply side influences operating here.
The Resources Sector
The resources space, especially the junior sector, has seen a significant resurgence over the last 12-15 months, following around
five years of GFC-inspired pain. Given the magnitude of the 2003-2011 China-led boom (which was only interrupted by the GFC),
any downturn was bound to be hard and protracted. The first half of the recent recovery was largely driven by the increase in the
gold price and resultant stellar increases in the price of a number of gold stocks. However we subsequently saw a retreat in the
gold price in the second half of 2016, before prices recovered once again.
Money made in this sector has triggered investors’ appetite for risk and an increasing allocation of speculative capital, which has
not been seen for some years. A notable recipient of this ‘risk money’ have been those companies operating in the lithium space,
which has been a ‘market darling’ over recent times; however with some degree of rationality now returning to the space (possibly
with greater investor understanding).
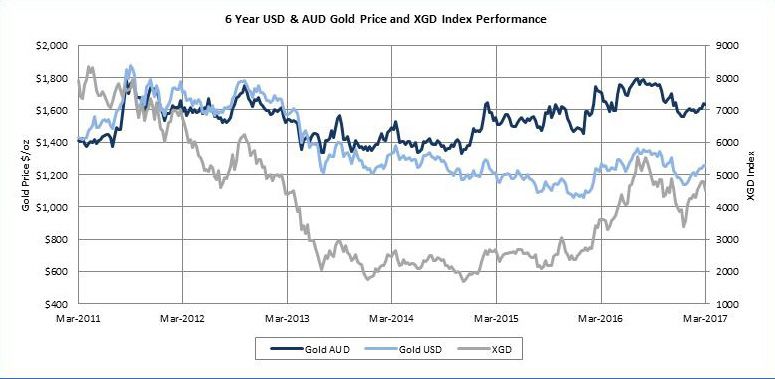
The graph below shows the comparative performance of a number of ASX indices over the last six years – this clearly shows
the relative pickup over the last 12 months in the resources indices compared to the benchmark All Ordinaries. We have chosen
this six year time frame given that the junior resource market reached its peak in February 2011 – the graph therefore shows the
magnitude of the falls from 2011 to 2016 – the junior resources and gold sectors lost 80% of their value over this period.
We note the flattening off of the XSR index over the last six months or so – this is not unexpected given that this is overweight in
gold stocks, and considering the behaviour of the gold price and thus the XGD index over this period.
The XMM index, which represents the mining sector as a whole continues to perform strongly – this is not surprising given the
performance of the majors, including BHP Billiton, Rio and Fortescue amongst others. This has been on the back of big increases
in the bulk commodities over the past year or so – this includes iron ore (up 100%), thermal coal (up 70%, although it has retreated
1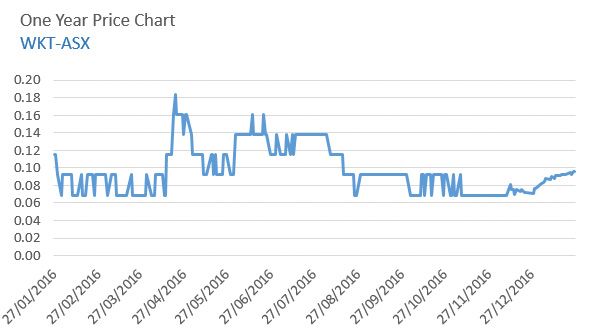
IIR Resources Blue Book Series

from being up 100%) and metallurgical coal (up 120%, although it is retreating from being up 300% in December/January). Crude
oil is also up 80% over the same period. The other commodity majors are heavily exposed to is copper (up 34%).

Source: IRESS

Even though the recovery has been on now for over a year, investors remain very discerning with where they put their money
in the current market. Company management understands this and we are not seeing the number of ‘spivs’ and ‘fly-by-nighters’
that we saw during the boom. This is borne out by shareholders in recent times demanding more cost and project management
discipline from company management and as such we are seeing better managed companies presenting at conferences. With very
few exceptions they all have a good product to sell, and are run by quality personnel.
Although the companies in this book represent a broad range of commodities, not surprisingly, given the current market, a large
proportion (~50%) have gold in their commodity mix, Other target commodities include base metals, dominated by copper and
zinc (~25% of included companies have either a primary or secondary interest in base metals) with lithium, bauxite, diamonds,
graphite, specialty metals, mineral sands and fertiliser minerals making up the rest. In addition some of the companies’ main focus
is on energy and innovative mineral processing technologies.
Many commodity sectors bottomed sequentially from late 2015 (precious metals) through to early 2016 (base metals, energy and
agriculture). This outperformance resulted essentially from a rebalancing of the supply/demand equation - as producers curtailed
supply simultaneously with resilient demand - in a low-price environment. Historically, industrial metals-led commodity rallies are
synonymous with global economic growth and inflation. It can be argued that 2016 was the year that commodity prices bottomed.
The dollar is the benchmark pricing mechanism for most raw materials and there has been a historical negative correlation between
the currency and the price of raw materials. However, even as the dollar regained strength since November, commodities have
been able to move contrary to this historical relation on the back of two key events - the OPEC and Non-OPEC oil production cut
agreement and the election of Donald Trump in the US election with a pro-growth agenda.
It’s fair to say that a significant resource sector rejuvenation is underway. Quality junior companies are once again able to raise
funding for exploration, appraisal and development activities, markets are reacting positively to favourable company news, and
share prices are continuing to move in the right direction..
Smaller companies, in contrast to the majors boast management with significant ‘hurt money’ invested, meaning they are often
run on the smell of an oily rag. Smaller independent resource companies are also much more leveraged to the strongly-performing
commodities of 2016/2017. These include gold (up 20%), copper (up 34%), silver (up 30%), nickel (up 38%), cobalt (up 28%),
lead (up 40%), tin (up 40%) and the star performer amongst the base and precious metals zinc (up 85%) - along with lithium and
graphite. 2016 was an an outstanding year for commodities and there’s every indication that this positive momentum will continue
through 2017.
The key theme in the resource space for 2017 will be volatility – amidst an overall improving tone in terms of demand and supply
fundamentals. One of the biggest drivers will be ‘The Trump Effect’ – how will the US economy and the world economy function
during 2017, given Donald Trump’s ascendancy to the White House? Certainly there’s been a lot of near-term enthusiasm generated
in commodity markets as speculators gamble on an infrastructure-led spending spree; however we think this is at least to some
significant degree overblown. The biggest factor in the resource sector is still China – as it is far and away the biggest single
consumer of commodities in the world economy.
Our view, as presented in the last Blue Book, are that the key commodities to keep an eye on are gold, lithium, graphite, nickel and
zinc. Interestingly, the world’s major mining houses have relatively little exposure to these commodities and are still heavily reliant
on iron ore, coal and copper for the bulk of their earnings. We believe the hard-won recent gains for bulk commodities like iron ore

                                                                                                                                      2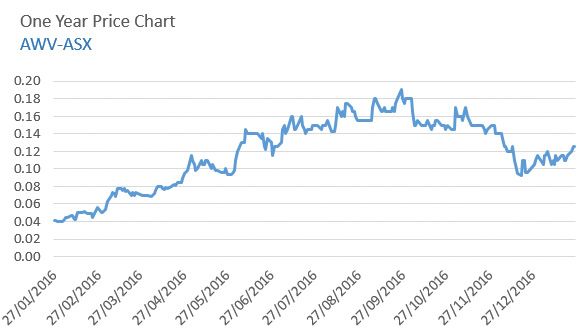
IIR Resources Blue Book Series

and coal will subside during 2017, particularly during the second half of the year. Supply is abundant and there have been temporary
factors within China that have sucked in imports and supported price increases, but Chinese authorities will continue to implement
measures to temper further price rises.
On the other hand, solidly-performing commodities this year like gold, zinc, lithium, graphite and nickel are set to outperform again
during 2017. Australian miners should also continue to benefit from strong commodity prices in A$ terms.

Gold and Silver
Gold and silver focussed companies have performed strongly over the past 12 months, coincident with the rise in the price of the
metals that commenced late in 2015. We anticipate gold prices to trade in a range between $1200 and $1500 during 2017.
We believe gold could be the surprise packet of 2017, as we believe that market fears of lower prices on the back of rising rates and
a stronger US dollar might not eventuate.
There’s also an overwhelming sense of déjà vu as far as the gold market is concerned. During late 2015, we witnessed the first
US Federal Reserve rate hike since the GFC – a 25-basis point increase. This followed years of promises, threats and jawboning by
the Fed with respect to rates. Gold therefore closed 2015 in limp fashion, with markets expecting the Fed to follow through on its
commitment of 3 – 4 rate increases during 2016.
Gold however surged out of the blocks during early 2016, as it became increasingly obvious that the Fed’s rate talk was exactly that
– all talk and no action. Similarly during late 2016 we saw a further 25-basis point rate rise, with markets once again anticipating
multiple rate rises during the course of this year. The reality however could be very different, as we believe markets are paying too
much attention to the Fed’s jawboning on rates.
Furthermore we believe markets have failed to take into account the broader impact that rising interest rates would have on the US
economy in general, particularly in respect of servicing the enormous level of debt that has been accumulated - with federal debt
currently sitting at around US$20 trillion. As a guide, a rate rise on this debt of just 1% would boost the annual federal deficit by
$190 billion. So the US economy requires a continuation of low interest rates in order to keep debt servicing to a minimum.
Furthermore, it’s not about rising rates per se – it’s all about the underlying real interest rate (i.e. the interest rate after accounting
for inflation). Gold has often enjoyed its biggest gains during periods of negative interest rates. The real interest rate in the US has
been in negative territory since 2008 (well below the inflation rate) and even if multiple consecutive rate rises were implemented
(unlikely, given we’ve only seen two since the GFC), the real interest rate in the US will still remain in negative territory.
Another key factor is the US dollar and contrary to the expectations of many, we believe the US currency’s gains will be capped
during 2017. The simple reason is that the US economy cannot afford a rapidly rising currency, as it will decimate President Trump’s
plans to grow exports – a fact he has already acknowledged.

Source: IRESS

What the above graphic shows, in the case of Australia, is that interest started coming back into the sector in late 2014 with
increasing devaluation of the AUD resulting in an increase in the AUD-denominated gold price, and then accelerated in late 2015
with a reversal of the four year down trend in USD prices. The gold price is also the antithesis of paper money. The last few
years have seen gold reaching record levels measured in most emerging economies’ currencies, but languishing against the US
dollar. However, growing economic and political uncertainty could well result in a strong rise in gold against all paper currencies –
including the US dollar. Remember that central banks can print more money, but they can’t print more gold.

                                                                                                                                        3
IIR Resources Blue Book Series
So if gains in both interest rates and the US dollar are restrained, we can see a very promising outlook for gold during 2017.
Investors will also look to gold as an insurance policy on the Trump presidency, where volatility will be a key theme. Accordingly,
we maintain confidence in our base-case gold price target range for the yellow metal during 2017 of between $1,200 and
$1,500/oz.
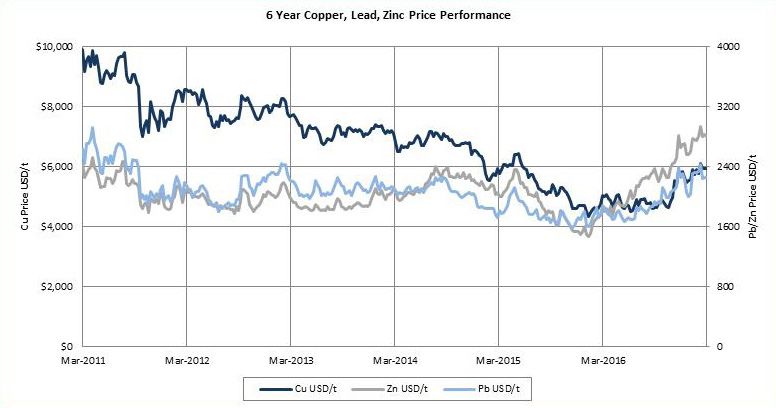
Base Metals
We have now seen sustained recoveries in the three main base metals over the past fifteen months, with the charts for copper,
lead and zinc shown below (please note the different axis that have been used). We have included nickel and tin on the following
chart – nickel remains relatively subdued; however recent events in the Philippines are putting some interest back into the metal
with it up 38% albeit from a very low base. The 2012 Nova-Bollinger discovery also continues to drive interest in the Fraser Range
area of Western Australia for explorers.
Tin has also recovered, despite the retreats over recent months.
Source: IRESS
Source: IRESS
What the graph above clearly shows is that zinc continues to outperformance both copper and lead, although prices for all have
now increased in parallel over the last six months.
4
IIR Resources Blue Book Series

Copper is the bellwether metal of the global economy and prices are in in part driven by sentiment. Like gold, we have seen a
strong reaction in copper prices (but in the opposite direction) in response to Trump’s election win, which has in effect “picked it
off the floor”. The protracted fall in prices from early 2011 to late 2015 was followed by a period where the price hung around the
US$4,800/tonne mark, which is close to the marginal cost of production, and generally signalling uncertainty about the global
economy.
The Trump victory saw the metal surge 25% briefly to over US$6,000/tonne on anticipation of major infrastructure projects in the
US, followed by a retreat to ~$5,600/tonne, however it has now recovered to ~US$6,000/tonne where it seems to be stabilising –
we may expect it to remain around these levels. It needs to be said that China currently consumes 5x as much copper as the US
(10mtpa vs 2mtpa), and hence China should have a larger effect on the copper price. There is also uncertainty regarding how much
of the metal is in “hidden” stockpiles in addition to that quoted by the major exchanges, such as Shanghai and the LME. We expect
copper prices to be relatively static during 2017 due to abundant supply and at best a modest supply deficit.
One of the reasons behind the rally in zinc is capacity coming out of the market through mine closures – these include Century
(~450,000tpa Zn in concentrate) and Lisheen (~165,000tpa Zn in concentrate) – this is ~4% of global supply, on top of Glencore in
late 2015 also reducing production by ~500,000tpa in response to falling prices.
The zinc supply crunch is therefore very real and after almost a decade of false hope, it’s arrived. We’re seeing closure after closure
in the zinc mining space as aging mines reach the end of their useful lives. At the same time, there has been relatively little spent
on exploration and development of new mines over the past decade, meaning higher prices are a reality. There’s a very strong
window of opportunity for investors and companies that can bring new operations on stream over the next few years. With the
exception of Glencore, many of the majors don’t have much exposure to zinc
What of the future? Our view is that the key drivers for zinc prices will include restarts of any of Glencore’s operations and China’s
steel production rate – China is the largest consumer and a net importer of zinc, consuming some 46% of global mine supply of
~13.4Mt in 2014. There is no new production on the horizon outside of China, and thus we would expect zinc prices to remain
relatively strong in the medium to long term, trading in the range of US$2,200 – US$2,400 per tonne, although short term prices
may be considerably higher – given the recent price history this view may actually be conservative.

Other Commodities
Last but not least are those companies looking at a suite of resources other than the major base and precious metals as discussed
above.
Two commodities that are not necessarily part of the mainstream as far as the world’s major mining houses are concerned - in
fact the big miners collectively have very little to these commodities that have a growing role to play in high-tech applications- are
lithium and graphite.
Of particular recent market interest has been lithium, with a number of hopefuls entering the market, particularly on the ASX
and TSX over the last year or so, and companies with lithium in their mix being well represented here. This has been a market
darling, being driven by expectations of strongly increasing demand of 5% - 10% CAGR over the coming 8 years (largely due to
batteries), which has made serious speculative money for investors in a number of companies – this has seen the return of the
entrepreneurial spirit to the market.
A lot of this has been driven by sentiment, however there is substance behind the hype – the forecast increases in demand
appears realistic, and we have seen lithium carbonate prices in China surge very strongly – the Chinese battery producers are
clamouring for the high quality battery product that is hard to get in China, which has seen spot prices for battery grade lithium
carbonate more than triple over the past year to over US$20,000/tonne. We would expect this to be unsustainable, and our view
is that prices will trade at around US$8,000 to US$10,000 over the longer term, equating to ~US$500-US$700/tonne of 6.5%
spodumene concentrate.
The price increases for lithium carbonate have also been reflected in the South American brine producers – these have increased
from ~$US4,500/tonne in 2014 to ~US$10,000/tonne in late 2017 – producers are using US$10,000/tonne in their current guidance.
Any future market dynamics may be considerably affected by what the “Big 4” producers (SQM, Tianqui Group, FMC Corp and
Albemarle) now do. In addition to forecast supply from new or restarted operations (Mt. Cattlin and Mt. Marion amongst others)
production from the Greenbushes Mine in Western Australia (owned by Albermarle and Tanqui) is forecast to double from the
existing 65,000tpa LCE to 130,000tpa LCE In addition Albemarle now has approval to increase production from its Salar de
Atacama from 50,00tpa LCE to 80,000tpa LCE.
Any increases in production from the existing hard rock mines especially will have considerably shorter lead times than new
developments. This is even harder for brine operations, with these taking a considerably longer time to ramp up production,
although once in operation they are a very high margin business, and will be more able than hard rock operations to maintain
production with falling prices. However we are seeing examples of where new supply is not coming into the market in the
signalled timeframes, which should keep upward pressure on prices.
This is not to say that some of the hopefuls won’t get up – a number will; however there will be attrition along the way. The sector
has cooled a bit, but still remains relatively strong, with increasing investor understanding.

                                                                                                                                       5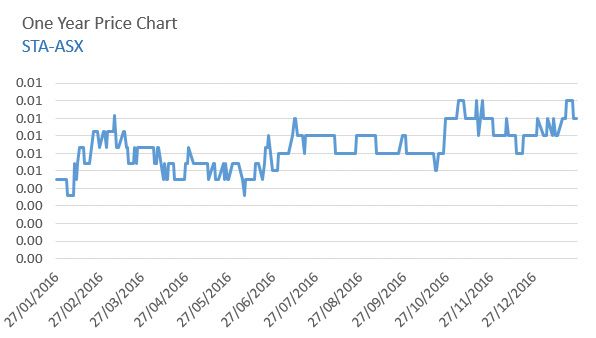
IIR Resources Blue Book Series

Graphite is another commodity that investors have a growing understanding of, however one of the issues with graphite is that
there are reportedly 140 projects all vying for the same pot of money – naturally there will be attrition in the sector. Like lithium,
most of the projects we have seen have merit, and it is a matter of a company differentiating its project against the others to attract
funding.

Bulk Commodities
The recent price recovery in respect of both coal and iron ore is not expected to last, as shown be recent falls in both metallurgical
and thermal coal prices. Prices have come off a very low base, supply is abundant and there have been temporary factors within
China that have sucked in imports and driven price increases – however Chinese authorities are already implementing measures to
temper price increases.
Recent times have been mixed for the other commodities represented here, however for a number of them we are seeing
renewed interest which is resulting in gains in share prices, and all commodities are worthy of consideration – as we mentioned
before we are commodity agnostic, and will judge each project on its individual merits.

Jurisdictions
Naturally, given the conference’s location in Cape Town, ~80% of companies presenting have projects somewhere in Africa. All
parts of Africa are represented including some areas that have only seen little exploration.
West Africa, with a focus on gold is well represented, with investor interest returning in a significant way after the region being in
the wilderness so to speak for a while. The return of interest has been rewarded with excellent exploration results from a number
of companies, with these providing strong returns for investors. These include new discoveries, in areas with little or no previous
exploration – this does show the huge potential of the region, which hosts the Birimian greenstone belts.
Still in Africa, we see South Africa as an emerging exploration and development destination. Although there are still significant
challenges in the country, including corruption, high mining cost inflation, labour unrest and a less than reliable power supply,
anecdotal evidence is that things are improving (especially in the latter, and things now seem to be under control), and with the
change from Apartheid now almost a generation ago, politics are changing with a strengthening democracy and more discerning
electorate.
Also, do not only think of the deep Witwatersrand gold mines when looking at the country – it is also highly prospective for a range
of commodities, including specialty and base metals, as well as for gold in settings other than the deep Witwatersrand.
Junior companies are finding it hard to source funding, particularly out of Australia, for work in South Africa however my time in the
country (which included the conference) included visits to various operations and exploration projects throughout the county, and
talks with a lot of people. This reinforced my view that the country is highly prospective for a number of minerals with little modern
exploration, and has a highly skilled work force given its long mining history. The main issue spooking investors is the uncertainty
with politics and BEE requirements, however there seems to be a growing groundswell of opinion and action against the
corruption, and that there is now a growing middle class who yearn for a comfortable and stable existence that should hopefully
act to settle things down and let the country progress towards its true potential as the African powerhouse.
There is continuing interest in other parts of Africa, including North and East Africa, with some of these areas having a long history
of exploration and mining and with companies running successful operations and thus rewarding investors, and areas, such as
Uganda and Kenya that have seen little exploration, but with recent activities showing the great potential of these countries.
Africa has traditionally been the domain of London-listed companies given historical factors and time zones, and these companies
still have a major presence on the continent, however Africa is well represented on the other major Exchanges. For example 24 of
the 34 ASX-listed companies have interests in Africa, with these involved in a wide range of commodities and 5 of the 10 Canadian
listed companies.
Europe, Australia, the SW Pacific and South America were also represented, albeit by only a few companies for each region.

In Conclusion
As mentioned earlier, the purpose of this book is to present a number of diverse resource companies that we believe have merit
and are worthy of further consideration. The companies cover a diverse range of commodities, jurisdictions and project stages, and
should thus appeal to a wide range of potential investors with differing appetites for risk.
We are now into the next resources boom; albeit a lot more restrained than the early 2000’s China led boom, which was, I believe
a one in a career event. However, as an old colleague said “it’s back on”!

Mark Gordon
Senior Analyst, Sydney.

                                                                                                                                    6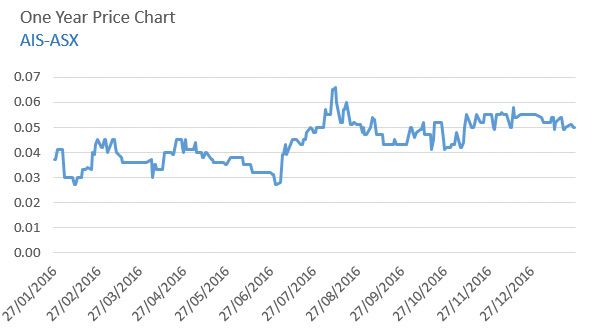
IIR Resources Blue Book Series

Aeris Resources Limited (ASX: AIS)
Commodity Exposure: Copper

RATIONALE FOR ATTENDING                                                              COMPANY DATA
Aeris Resources is attending 121 Mining Investment to share its company              Share Price          : A$0.055
strategies and growth plans with investors.                                          Issued Capital : 140 million
                                                                                                       (934M fully diluted)
COMPANY SUMMARY
                                                                                     Market Cap           : A$7.7m (51.3m fully diluted)
Aeris Resources Limited (ASX: AIS) is an established copper miner and
producer with multiple mines and a 1.8 Mtpa processing plant at its Tritton          Year high/low        : $A0.066/0.027
Operations in New South Wales, Australia. In FY16 Aeris’ Tritton Operations                                  (12 months to 28/11/16)
achieved record production of 30,425 tonnes of copper metal – its third              Cash                 : A$7.8 million (30/09/16)
consecutive year of record production. Aeris has a clear vision to become a
                                                                                     Debt                 : A$50 million (Senior Debt)
mid-tier, multi-operation company through its two-pronged strategy of organic
growth through exploration and project development as well as the evaluation         MAJOR SHAREHOLDERS
of suitable merger and acquisition opportunities. The Company has an extensive       •   Citicorp Nominees Pty Limited 21.70%
portfolio of highly prospective exploration projects within its 1,800km2
                                                                                     •   HSBC Custody Nominees (Australia) Limited
tenement package surrounding the Tritton Operations, including a number of
                                                                                         16.28%
advanced brownfields projects. Aeris has also committed $7.5 million over the
next two years to greenfields exploration within its substantial landholding to      •   Glencore Finance (Bermuda) Ltd 9.39%
further bolster its project pipeline.                                                •   National Nominees Limited 4.69%
                                                                                     •   Ning Laurenson Holdings Pty Ltd 2.00%
MANAGEMENT PROFILE
          Andre Labuschagne – Executive Chairman                                     1 Year Price Chart

          Mr Labuschagne is a experienced mining executive with a career
          spanning more than 25 years in the industry. Previously as the
          Managing Director of ASX-listed gold company Norton Gold Fields
Limited, Mr Labuschagne led the company’s growth to a significant Australian
gold producer, prior to its sale to a major Chinese gold company in 2012. He has
also held various management roles in South Africa, Papua New Guinea, Fiji
and Australia for a number of leading gold companies including Emperor Gold
Mines, DRD Gold and AngloGold Ashanti. Mr Labuschagne holds a Bachelor of
Commerce degree from Potchefstroom University in South Africa.

RECENT NEWS
18/11/2016: FY16 Annual General Meeting presentation
18/11/2016: Aeris reinvigorates exploration in search for next Tritton
03/08/2016: Updated Ore Reserve Estimate – Tritton deposit
28/07/2016: Approval of Tritton Deeps development
04/07/2016: Tritton exceeds guidance with record annual production

 ANALYST INSIGHT
 Following a successful corporate, debt and operational restructure, Aeris Resources is looking to the future at its central New
 South Wales copper operations in Australia and is in a strong position to take advantage of forecast increases in the copper price
 over the coming years.
 As part of the strategy to extend the life of the Tritton Operations out to 2023, the Company has approved the start-up of the
 Murrawombie underground mine, just 25km to the south west, to supplement feed to the processing plant from the existing
 Tritton underground mine. Work is also underway to extend the life of the Tritton underground mine, including the installation
 of an 880m deep ventilation shaft, which will allow mining to transition to Tritton Deeps, with mineralisation still open at depth
 below the current mine plan.
 As part of an overall growth strategy the Company has embarked on an aggressive $7.5 million, two-year exploration programme
 over its 1,800km2 tenement holding around the Tritton Operations. This will include higher power, deep electromagnetic
 surveying, which is a proven exploration tool for the interpreted Besshi style of VMS mineralisation found in the district. Previous
 EM surveys have looked only to around 250m depth, due to previous constraints in technology, but have been responsible for
 the discovery of a number of blind systems including Tritton. Given the style of mineralisation and the regional geology there is
 good potential for more discoveries down to 500 metres.
 Now the Company’s turnaround is complete and the Tritton Operations have a clear path forward, the focus is wholly on growth,
 including through the evaluation of suitable mergers and acquisition opportunities to deliver on the strategy of transforming
 Aeris into a mid-size, multi-operation resources company.

                                                                                                                                         7
IIR Resources Blue Book Series
African Energy Resources Limited (ASX: AFR)
Commodity Exposure: Coal, uranium
RATIONALE FOR ATTENDING COMPANY DATA
We are looking to meet investors with a long term view and who understand Share Price : A$0.033
utility/infrastructure projects and their return profiles, and who may also have Issued Capital : 608 million
an understanding of the southern African power sector. We are less interested
Market Cap : A$ 0 million
in meeting resource focussed funds who have a less developed understanding
of infrastructure projects and utility styles returns. Year high/low : A$0.03/0.06
Cash : A$4.6M
COMPANY SUMMARY
Debt : Nil
African Energy Resources is developing three major power projects in
Botswana to supply electricity into the undersupplied regional power pool. MAJOR SHAREHOLDERS
The Company’s three projects include the Sese Joint Venture in which First
• The Sentient Group 23%
Quantum Minerals Ltd has committed an initial investment of AS $20M for a
• First Quantum Minerals Ltd 11%
75% stake, with AFR’s 25% interest loan carried to cash flow from a major
power station to be built at Sese. African Energy is also currently the lead • Management 10%
developer for the 600MW Mmamabula West power project, and has executed 1 Year Price Chart
a binding Agreement to sell its interest in the 600MW Mmamantswe coal and
power project to a South African Developer for $20M.
MANAGEMENT PROFILE
Dr Frazer Tabeart – Managing Director
Dr Frazer Tabeart is the Managing Director of African Energy
Resources. Frazer is a geologist by profession, having graduated
from the Royal School of Mines, London with an honours degree
in Mining Geology in 2005, and a Ph.D in 2008. Frazer worked for WMC
Resources for 16 years in a variety of senior global exploration roles, before
he joined African Energy in 2005. Under Frazer’s leadership the Company
discovered the Name and Gwabe uranium deposits in southern Zambia in
2006, and the massive Sese coal deposit in 2010. Since then he has led the
company through the acquisitions of the Mmamantswe and Mmamabula West
coal and power projects, and their subsequent development as major power
projects.
RECENT NEWS
Strong momentum in the Sese JV with First Quantum Minerals which is close
to finalising its permits for an open pit coal mine and ~300MW power station.
ANALYST INSIGHT
African Energy’s strategy is to have a stake in the development of integrated coal mines and 300-600MW power stations to
be a key part in regional plans to alleviate Sub-Saharan Africa’s (“SSA”) current chronic power shortages and to develop energy
security in this rapidly growing region, with population and power usage forecast to double by 2050. One such programme is
South Africa’s Integrated Resource Programme (“IRP”), which is looking to source energy from Independent Power Providers
(“IPP’s”), with 2,500MW of the total 9,000MW planned expansions to the existing Government owned 44GW generation
capacity to be sourced from coal-fired generation.
Once thought stranded, the Company’s three coal assets Sese, Mmamabula West and Mmamantswe, which between them
host resources of 8.6BT of thermal coal, should now be considered as valuable assets, ideally located in eastern Botswana and
close to transmission infrastructure to become a part of the IRP as well as supplying power to Zambia and other SSA countries.
African Energy has entered into agreements on two of the projects (Sese and Mmamantswe) and is in negotiations on
Mmamabula West – a key part of the strategy is for the partners to fund activities thus creating value for African Energy without
the need to dilute shareholders through large capital raisings.
Agreements include a JV with First Quantum Minerals Ltd (“FQML”) at Sese, in which FQML is earning 75% with African
Energy loan carried to production – here FQML is looking at energy security for southern Zambia where it has a number of
copper operations. At Mmamantswe the Company has a sales agreement and will receive US$20 million for the project should
its South African partner come to financial close in a power station development. Finally, at Mmamabula West the Company is
negotiating an agreement whereby significant equity is retained, with the partner carrying costs with the resource having the
capacity to support a number of 600MW projects.
8IIR Resources Blue Book Series
Anova Metals Limited (ASX: AWV)
Commodity Exposure: Gold
RATIONALE FOR ATTENDING COMPANY DATA
Meeting institutional and private investors. Share Price : A$0.115
Raising awareness of the Company and its soon to commence mining
operations. Issued Capital : 451,900,292
Market Cap : A$52m
COMPANY SUMMARY
Year high/low : A$0.192/0.038
Anova Metals Limited (ASX:AWV) is a gold company focused on the 100%
owned Big Springs Project in north eastern Nevada, USA. The Company is Cash : A$9m
soon to re-commence mining operations at Big Springs with its environmental Debt : Nil
approval expected very shortly. Once permits are received, the Company will
seek to mobilise a contract miner and commence open pit operations with the MAJOR SHAREHOLDERS
ore to be toll treated at a nearby (~40km) mill.
• Phoenix Gold Fund 8%
The Company is also undertaking a large scale exploration program to increase • Lujeta 7%
its resource from the existing 1.03 Million oz’s
• Alasdair Cooke 6%
MANAGEMENT PROFILE • Rex Harbour 5%
Bill Fry – Executive Director • Lomacott 5%
Bill Fry has more than 20 years corporate experience in the mining 1 Year Price Chart
and resources industry, specialising in accounting, management,
business development and general corporate activities. He has vast
experience in project evaluation and development, project funding,
management, finance and operations.
Alasdair Cooke is a qualified geologist and has been involved throughout his
career in mineral exploration and corporate development, including eight years
spent with BHP Minerals Business Development Group and over fifteen years
managing public resource companies. During this period he has established a
number of successful mining projects and resources companies, developing
greenfield mines in Australia, Africa and South America.
RECENT NEWS
Anova Metals has recently completed an exploration drilling program at its Big
Springs Project.
Highlights include an intersection of 10.7m @ 30.9 g/t Au, including 3.0m
@ 60.4 g/t Au and 9.1m @ 7.5 g/t Au, including 4.6m @ 10.9 g/t Au. This
exceptional intersections are outside the limits of the currently modelled
resource envelopes and extends the high-grade zone.
Additionally, the Company has recently received its draft Environmental
Assessment Notification, the Big Springs Project was determined to not have
a significant impact on the environment and the United States Forest Service
issued a Finding of No Significant Impact.
ANALYST INSIGHT
Anova Metals is focused on its flagship Big Springs Gold Project in northern Nevada, USA. Big Springs is located within
the Carlin district, a world-class gold producing area that provides access to all essential mining services. Carlin produces
approximately 75% of the USA’s annual gold output, having produced more than 150Moz of gold – largely over the past 30
years.
Big Springs produced around 386koz (from 510koz mined) in six open-pits from 1987 until production ceased in 1993 (due to low
gold prices). It is situated 20km north of the operating Jerritt Canyon Mine.
The company plans to mine already-identified gold resources and to utilize existing neighbouring production infrastructure – thus
minimizing both start-up costs and overall investment risk. The project is now fully permitted for commencement of open pit and
underground mining operations at the South Sammy deposits. The capital cost to commence mining is very low due to the use
of a contract miner and processing via toll treatment of the ore. Initial access to the underground operations will be paid out of
cashflow from open pit operations.
The mineralisation including metallurgy, is well understood, and hence will help mitigate start-up risk. Ore from Big Springs was
previously processed through a 1,000 tpd trial roaster located at Big Springs, which was the pre-cursor to the much larger 6,000
tpd Jerritt Canyon facility. Recoveries averaged 86% through the trial roaster. Jerritt Canyon has been treating similar ores for
over 30 years, with good metallurgical recoveries of 85 – 90% expected. Geologically the mineralisation is well-understood and
defined.
Anova had previously reached a toll-treatment agreement with Veris Gold Corp., the previous owner of the Jerritt Canyon
mill, situated some 42km by road from Big Springs. The plant, including a roaster, in recent times has undergone a US$250m
upgrade and refurbishment, and is one of only three roasters in the state. Anova is currently in negotiations with the current
owner, Jerritt Canyon Gold, to toll treat ore from the Big Springs Gold Project.
9IIR Resources Blue Book Series
Apollo Consolidated (ASX: AOP)
Commodity Exposure: Gold, Nickel
RATIONALE FOR ATTENDING COMPANY DATA
An opportunity to meet gold focussed funds and private equity investors, Share Price : A$0.075
including some that are existing shareholders. We see PE funding as continuing Issued Capital : 160.6m
to be a major contributor to the 2016 exploration activity, particularly in
Market Cap : A$12.05 million
gold where the investment value of new resources is quantifiable, capex
requirements reasonable & offering a sensible timeline to commercialisation. Year high/low : A$0.175/0.05
Cash : A$5.3 million (plus A$4.4
COMPANY SUMMARY
million receivables)
Apollo Consolidated Ltd (ASX: AOP) is a gold and nickel sulphide exploration
Debt : Nil
company based in Perth, Western Australia. Its exploration focus is in West
Africa and in particular the under-explored but highly-prospective country MAJOR SHAREHOLDERS
of Cote d’Ivoire where it has over 1,000km of granted exploration tenure, • Mr Yi Weng 17%
including the advanced Seguela Project and strong early stage gold prospects
• Mr Geoff Harris 10%
on the Korhogo and Boundiali permits. In Western Australia the Company has
wholly-owned gold exploration properties at Rebecca, Yindi and Larkin, and • 1832 Asset Management 9.5%
nickel sulphide prospects at Rebecca and Louisa. • Board & Management 14%
MANAGEMENT PROFILE 1 Year Price Chart
Nick Castleden – Executive Director
Nick is a geologist with 21 years of experience in the mineral
exploration and development industry. He has worked with Australian
mining companies including Mt Isa Mines, Perilya Mines, MPI Mines,
LionOre and Breakaway Resources in various exploration, geological and
management capacities and has had operational experience in Africa, North and
South America and across Australia. He has particular experience in the gold,
nickel and base metal exploration business and has participated in the discovery
and delineation of new gold and nickel sulphide systems that have progressed
through feasibility studies to successful mining.
RECENT NEWS
16/01/2017 Aircore Drilling Reveals More Gold at Antoinette
03/01/2017 Drilling Update Antoinette Prospect Download
30/11/16 Apollo Hits 17m @ 22.52g/t Au in RC Drilling at Antoinette
ANALYST INSIGHT
Recent high grade gold intersections at Apollo’s exciting Antoinette discovery in the Cote D’Ivoire highlight the potential of the
Neoproterozoic Birimian system of West Africa, which remains underexplored in a number of regions, and which hosts close to
200Moz of gold resources.
Antoinette is within the company’s Boundiali tenement, located in northern Cote D’Ivoire, some 100km south along strike on
the same greenstone belt as Resolute Mining’s 6.7Moz Syama deposit in southern Mali. The prospect was originally identified
by soil sampling, with initial aircore drilling in early 2016 testing the main 2.8km x 1.0km anomaly. This has been followed up by
further aircore and two reverse circulation programmes, with the latest testing the 700m long Trench Zone.
Intersections to date at the Trench Zone include 17m @ 22.62g/t Au and 11m @ 6.69g/t Au amongst a number of others, and
have defined both oxide and primary mineralisation. Primary mineralisation occurs in a number of parallel vertical to steeply east
dipping zones that are open at depth with true widths of up to 10-15m, with oxide mineralisation forming a broader blanked up
to 40 m thick. Additional areas remain to be tested at Antoinette.
Encouraging aircore results have also been received from the Korhogo Permit just south of Boundiali, in which 12
reconnaissance aircore lines over a 20km strike length gold trend have all recorded anomalous gold values – this tenement is
located over a major shear zone 60km from Randgold’s 4.3Moz Tongon Gold Mine. The Company’s third project in the country,
Seguela, is under option to Newcrest, with an initial payment of US$3.5 million (US$2.8 net to Apollo) due shortly.
Apollo also has interests in Eastern Goldfields of Western Australia, with these returning very positive results.
10You can also read