SMALL-SCALE WATER PROVIDERS IN KENYA: PIONEERS OR PREDATORS? - POVER T Y REDUC TION A N D ENVIR ONMENT AND ENER GY
←
→
Page content transcription
If your browser does not render page correctly, please read the page content below
Empowered lives.
                                                                Resilient nations.

United Nations Development Programme

poverty reduction              and     Environment and Energy

Small-Scale Water Providers in Kenya:
Pioneers or Predators?
Empowered lives.
                         Resilient nations.

   Small-Scale Water
  Providers in Kenya:
Pioneers or Predators?

        August 2011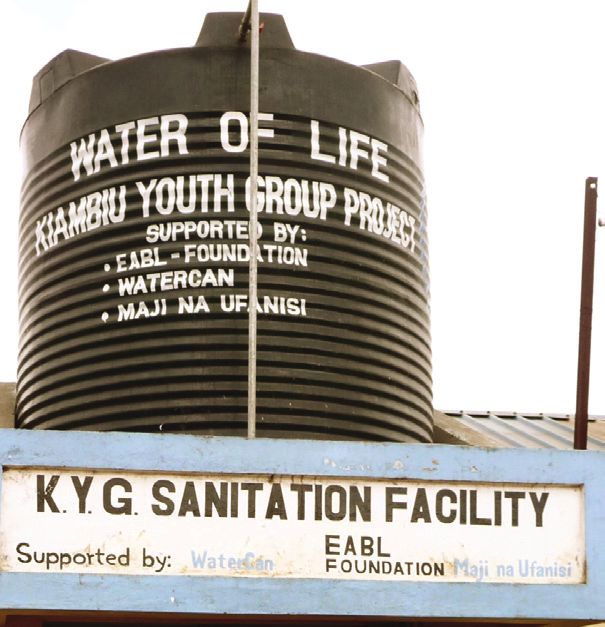
Copyright © August 2011

United Nations Development Programme
One United Nations Plaza
New York, NY 10017
USA

E-mail: poverty.reduction@undp.org or environmentandenergy@undp.org
Web Site: www.undp.org/poverty or www.undp.org/water

Acknowledgments

This paper was authored by Degol Hailu, Sara Rendtorff-Smith and Raquel Tsukada. Comments are welcome
to Degol Hailu (degol.hailu@undp.org), Sara Rendtorff-Smith (sara.rendtorff-smith@undp.org) and Raquel
Tsukada (pereira-de-sousa-tsukada.1@osu.edu).

We would like to thank Alastair Morrison, Edward Kairu, Gonzalo Pizarro and Kate Bayliss for their valuable
comments. Andrew Hudson deserves special mention for supporting this project and for his guidance
throughout. Thanks also go to Jane Fulton for her comments and edits. We received important support from
the UNDP country office in Nairobi. Christopher Gakahu and John Gathuya deserve particular mention. We are
also extremely grateful for the time committed by community members, representatives of the Government
of Kenya and, not least, by a team of diligent young enumerators. Without their contributions, writing this
report would not have been possible. Finally, we would like to acknowledge the comments from participants
in the World Water Day Seminar, organised by UNDP and held in New York on 22 March 2011.

Disclaimer

The views expressed in this publication are those of the authors and do not necessarily represent those of the
United Nations, including UNDP, or their Member States.
Contents

List of Acronyms and Abbreviations                                            iv

Executive Summary                                                             1

1.	Introduction                                                               2

2.	Conceptual Framework: The Poverty Penalty in the Urban Market for Water    6

3.	The Data and Methodology                                                   8

4. Water Supply and Distribution                                              9
     4.1 Small-Scale Water Providers                                          9
     4.2 Water Pricing                                                        14
5.	Demand for Water and Consumption                                           18

6.	The Regulatory Framework: Ensuring Affordability, Safety and Reliability   28

7.	Conclusion and Policy Implications                                         32

Annex 1. Profiles of the Communities Surveyed                                 34

Annex 2. Key Water Sector Institutions                                        36

Annex 3. Rising Block Tariff Scheme, NCWSC	                                   37

References                                                                    39
List of Acronyms and Abbreviations

AWSB	Athi Water Services Board
CBO 	Community-based organisation
CDF           Kenyan government’s Community Development Fund
CESR 	Center for Economic and Social Rights
GoK	Government of Kenya
GPOBA 	Global Partnership on Output-Based Aid
ICEFI 	Central American Institute for Fiscal Studies
ISD	Informal Settlements Department
JMP	          WHO/UNICEF Joint Monitoring Programme for Water Supply and Sanitation
KENSUP	       Kenya Slum Upgrading Programme
Kshs          Kenyan Shillings
KWTP          Kinoo Water Trust Project
MWI	          Kenyan Ministry of Water and Irrigation
NCWCS	Nairobi City Water and Sewerage Company
NGO 	Non-governmental organisation
OBA	Output-based aid
PPIP	Pro-Poor Implementation Plan
UfW	Unaccounted-for-water
UNDP	United Nations Development Programme
UNICEF	United Nations Children’s Fund
UN OHCHR	Office of the United Nations High Commissioner for Human Rights
WASREB        Water Services Regulatory Board
WHO	          World Health Organization
WSBs          Water Services Boards
WSP	          World Bank’s Water and Sanitation Program
WSPs          Water Service Providers
W&S           Water and Sanitation
WSTF          Water Services Trust Fund
Executive Summary

Executive Summary
There are two main schools of thought about the role of small-scale private water providers. Proponents view
them as pioneers and gap-fillers, supplying water where utilities are not providing it adequately. Sceptics
argue that they are predators who charge high prices and supply poor quality water. This study examines
which argument holds true in the urban and peri-urban areas of Kenya. The study is based on household and
provider surveys, as well as topical interviews with government officials and stakeholders. We find that small-
scale providers increase water supply coverage and reduce time poverty.

As predicted by the “poverty penalty” concept, however, low-income households pay high prices for water of
questionable quality. For two-thirds of households, expenditure on water is above the affordability threshold.
And 57 percent of households consume below the water poverty line. Water is also exposed to contamination
by external toxic residuals, mainly during transportation and as a result of pipe leakages. Given their inability
to store water, low-income households suffer disproportionally in times of scarcity and rationing.

As regards policy intervention, piped water connections on premises remain the most affordable and safe
system of water provision. In the meantime, supporting fixed-point water suppliers such as public taps and
water kiosks represents a second-best solution. Strengthening capacity within regulatory institutions is
required to ensure affordability and quality of the water provided.

                                                    Small-Scale Water Providers in Kenya: Pioneers or Predators?    1
Introduction
1. Introduction
Kenya faces challenges in realizing its “2030 Vision” for the water and sanitation sector “to ensure that
improved water and sanitation are available and accessible to all” (GoK, 2007, p. 18). The 2010 constitution
made access to water and sanitation the right of citizens. 1 This is in line with the United Nations stipulation of
access to water and sanitation as a human right that requires member states to take “deliberate, concrete and
targeted steps” to ensure the progressive realisation of this right (UN OHCHR, 1990). 2 Despite these ambitious
objectives, the proportion of people with access to an improved water source remains low (MWI, 2007). As
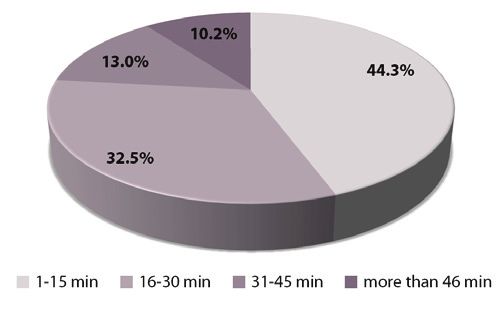
shown in Figure 1, in 2008 only 59 percent of Kenyans had access to safe drinking water, although the share
had increased from 44 percent in 1990. In urban areas the figure is 83 percent, down from 91 percent in 1990.
This gradual deterioration in urban water access is mainly due to rapid population growth, especially in the
informal settlements.
Figure 1: Improved water source (% of population
with access), Kenya 1990–2008
Source: World Bank (2011).
Kenya is undergoing rapid urbanisation. It is estimated that more than half of the population will be living in
cities by 2020, compared to only a third in 2000 (UN HABITAT, 2003b). Nairobi’s population alone is projected
to grow by 3.9 percent between 2006 and 2020 (City Mayors Statistics, 2011). 3 In addition, natural population
1 The right to water falls under the category of economic, social and cultural rights. The principle of “progressive
realisation” follows from the recognition that the full realisation of such rights generally may not be possible in a
short time period. Rather, it is contingent on the availability of resources. The obligation thus differs significantly from
that contained in article 2 of the International Covenant on Civil and Political Rights, which embodies an immediate
obligation to respect and ensure all of the relevant rights (UN OHCHR, 1990).
2 The right to water is protected by articles 11 and 12 of the International Covenant on Economic, Social and Cultural
Rights (UN CESCR, 1966). The “Guidelines for the Realization of the Right to Drinking Water Supply and Sanitation” of
the UN Sub-Commission on the Promotion and Protection of Human Rights also recognizes these essential services as
rights.
3 This development is partly the result of mechanical population growth caused by rural-urban migration.
2 Small-Scale Water Providers in Kenya: Pioneers or Predators?Introduction
growth in the city’s current 200 informal settlements surpasses that of planned urbanised areas (UN HABITAT,
2010). In 2003, some 71 percent of Kenya’s urban population, or 7.6 million people, lived in informal urban
settlements (UN HABITAT, 2003a). These settlements are often associated with high levels of poverty and
inadequate provision of basic services.
The growth of informal settlements poses serious challenges to the provision of water. On the supply side,
since residents do not hold formal land titles, there is a constant risk of eviction. According to the public
utility, the Nairobi City Water and Sewerage Company (NCWSC), the perceived risk of — and sometimes
actual — removal of dwellings in urban informal settlements hinders investments in water infrastructure. For
instance, pipe laying requires negotiations with community members over the possible removal of structures
to make way for construction. In the Waruku settlement, the removal of dwellings by the Nairobi City Council
involved the demolition of a community water and sanitation block. The block had a formal piped water
connection to the utility provider and had been inaugurated by the Minister of Water and Irrigation in 2008.
This did not prevent its demolition. In addition, the perceived and real threats facing metre readers who seek
to enter informal settlements are also seen as impediments to revenue collection, making service delivery to
settlements appear unprofitable.
On the demand side, even if the utility company is willing to extend its network to cover informal settlements,
the cost of a connection alone — 40,000 Kenyan shillings (Kshs) — is unaffordable for most households. 4 This
is exacerbated by the fact that the NCWSC, unlike the Kenya Power and Lighting Company (KPLC), offers
no gradual repayment schemes. Only recently has NCWSC adopted a billing system similar to KPLC’s PayBill
service, which enables metered users to submit their bill payments via the mobile money transfer system
M-Pesa. Unmetered customers, who account for about 12 percent of NCWSC connections, still have to settle
their bills directly at one of the company’s payment locations across Nairobi. 5 Here, people often wait in long
queues, especially at peak times. In addition, only a minority of households can meet the requirements to
obtain an individual metered connection, namely an applicant’s plot number, a landlord’s certification of
residence, and a certificate of employment. (NCWSC, 2011).
The abovementioned demand and supply-side factors have exacerbated inequalities in access to water and
have left gaps in public service provision. Small-scale water providers have entered the market to fill the gaps.
Small-scale provision takes various forms, including independent small piped systems; fixed-point resale
businesses such as borehole water vendors, tap water vendors and water kiosks; and mobile delivery services
offered by pushcart vendors and tanker trucks. 6
According to Kariuki and Schwarz (2005, p. 6) small-scale providers “play an important role in service
provision, compensating for — or supplementing — the limited financial and human resources of the public
4 The cost of connections covers NCWSC fees as well as the cost of construction material.
5 In 2008, the number of NCWSC bill-payment locations increased significantly. In addition to existing NCWSC business
centres and regional offices, banks and post offices country-wide now offer NCWSC bill-payment services (NCWSC,
2008).
6 In October 2009, NCWSC launched the Informal Settlements Department (ISD) with a mandate to deal with water and
sanitation supply in informal settlements. According to ISD, sabotage of NCWSC infrastructure is common, both by
small-scale water vendors, who see NCWSC as a competitor to their lucrative business, and by land owners, whose land
has been grabbed by the slum dwellers and who thus consider the installation of public water supply infrastructure a
“formalisation” of the status quo, benefitting what they consider to be land grabbers.
Small-Scale Water Providers in Kenya: Pioneers or Predators? 3Introduction
sector”. These providers play three basic roles. First, in acting as “gap fillers” they help ensure high coverage
levels, albeit at a lower quality. Second, they are “pioneers” extending water access to areas where there is no
infrastructure and no system of delivery. Third, small-scale providers act as “sub-concessionaires” buying from
the utility and reselling to customers. Schaub-Jones (2008, pp. 271–273) adds that these providers are:
“outperforming larger formal providers in meeting demand for household connections, usually without
any external subsidies. This achievement relies on their ability to innovate, using appropriate standards
to lower the costs of delivery. Investment and operational risks are passed through to the user and the
local relationships built to provide security.”
Sceptics, however, argue that small-scale provision is associated with higher prices, in the range of five to
twenty times higher than prices charged by utilities (Sansom, 2006). Since services are usually unregulated,
quality and labour standards are not maintained (Kjellén and McGranahan, 2006). There have been reports of
water vendors illegally extracting water from the piped system for resale, deliberately creating a shortage and
thereby raising demand for private water supply. Water cartels, through collusive price setting, are increasingly
prevalent in poor communities (WSP, 2009). These are the negative aspects of unregulated private provision,
challenging the benign view of small-scale providers.
This paper looks at whether small-scale providers in Kenya are innovative gap fillers, as proponents claim, or
predators, as the sceptics argue. The findings are that the water utility (NCWSC) is unable to extend adequate
water-supply services to the majority of urban and peri-urban communities, resulting in small-scale private
providers filling the service gap. This study examines what role these providers play in ensuring affordable,
safe and reliable water supply. The main findings are outlined below.
First, there is a significant incidence of water deprivation: 57 percent of the low-income households surveyed
consume less than the water poverty line of 20 litres per capita per day. About 63 percent of households
spend well above the affordability threshold on water. Mobile vendors, such as those using pushcarts and
tanker trucks, charge the highest unit prices for water.
Second, about 53 percent of the water provided by small-scale providers comes from “other improved
sources”. The ability of mobile vendors, such as pushcarts and tanker trucks, to obtain water from a variety of
sources allows them to supply water in times of shortage. This, however, also introduces an information gap
regarding the quality of water sold, as end users have little means of verifying the safety of the water they
purchase. Inferior quality pipes used by illegal connections break easily, and initially safe water can thus be
contaminated by garbage, other toxic residuals, and impure external water flows.
Third, water supply is unreliable, mainly because of extensive rationing by the utility company. Rationing, in
turn, is partly the result of high unaccounted-for water use. All communities surveyed suffer from unreliable
water provision on the part of the utility provider. In the short run, water rationing leads to expectations
of future water shortages, and households respond by storing water. This pushes up the demand for water
beyond immediate consumption levels, further exacerbating water shortages.
As regards policy interventions, key water-sector institutions need capacity strengthening for several reasons.
The first is to ensure the safety of water. A recent report by the Water Services Regulatory Board (2010)
identifies institutional weaknesses in the quality assurance system. Government officials, for example, inspect
4 Small-Scale Water Providers in Kenya: Pioneers or Predators?Introduction
boreholes only once at the time of granting licenses. The second reason is to expand connections to fixed-
point water suppliers such as public taps and water kiosks. This would allow more households to shift from
a reliance on mobile water vendors to buying water from fixed-point water sources that are safer and more
affordable. And the third reason is to tackle water rationing by repairing decaying infrastructure to reduce
leaks, and by investing in the expansion of catchment capacity to increase supply.
The study is organised as follows: Section 2 locates the paper within the conceptual framework of the “poverty
penalty” literature. Section 3 outlines the methodology and the data used in the analysis. Section 4 describes
the water distribution and supply chain. Section 5 presents the findings on the demand for and consumption
of water. Section 6 explores the extent to which the regulatory framework adequately addresses the
challenges to ensuring affordable, safe and reliable water supply in informal settlements. Section 7 concludes
with policy recommendations.
Small-Scale Water Providers in Kenya: Pioneers or Predators? 5Conceptual Framework: The Poverty Penalty
in the Urban Market for Water
2. Conceptual Framework: The Poverty Penalty in
the Urban Market for Water
The concept of the poverty penalty refers to “the relatively higher cost shouldered by the poor, when
compared to the non-poor, in their participation in certain markets” (Mendoza, 2008, p. 2). This may apply
to low-income households as consumers and as producers. 7 Depending on the specific context, the poverty
penalty can take at least four possible forms.
First, the poor may be disadvantaged and marginalised in markets by a quality-related poverty penalty. Examples
of commodities offered to the poor that have a quality-related poverty penalty include expired medicines, spoiled
or contaminated foodstuffs, faulty electrical and mechanical devices and products, and water from unimproved
sources. In some cases, poorer quality products may be offered at the same price as better quality products.
Second, a price-related poverty penalty exists in markets where lack of competition often results in higher
prices. In this type of market, poor customers pay a higher price per unit of a specific product. 8 This type of
poverty penalty can be measured quantitatively, for example by calculating the ratio of the price paid by the
poor relative to the non-poor. This is called “the poverty premium”. 9
Third, stronger forms of price-related market exclusion also lead to catastrophic expenditure burdens.
Catastrophic spending refers to a situation in which the spending burden of a particular commodity or service
forces a household to “reduce its basic expenditure over a period of time” (Xu et al., 2003, pp. 111–112). Such
a scenario is likely when non-consumption of the commodity or service is not an option for the household.
Examples include spending on energy, health and water. Researchers have identified a “catastrophic spending
threshold” of 10 percent of household income to best approximate the level, which implies giving up other
basic needs, disposing of productive assets, incurring debt or becoming (more) impoverished (Van Doorslaer
et al., 2007; Xu et al., 2003).
Finally, non-usage refers to a situation in which demand-related factors cause the poor to opt out of the
market, even though they can afford the commodity or service in question. Reasons for non-usage can include
the provider’s insensitivity to cultural beliefs and practices, and a lack of adequate awareness among users
(Houweling et al., 2007). 10 A study by Fotso et al. (2008) found that even where quality health services were
7 This paper adopts a focus on the poor as consumers. The poverty penalty facing the poor as producers refers, for
example, to lower wages paid to poor labourers. One reason is that the poor disproportionately tend to find
employment in the informal sector.
8 The law of one price predicts that a homogenous good trades at one price no matter who buys it or which firm sells it.
Market failures, however, distort the assumptions underpinning this law.
9 Mendoza (2008) proposes calculating this “poverty premium” as the ratio of the highest price offered to the poor by
informal lenders (credit), small-scale private providers (water) etc., and the price offered by large-scale providers, such
as formal financial institutions, utilities etc., minus 1.
10 While low income is the root cause of the poverty penalty, other reasons relate to the broader market environment.
First, the poor tend to live either in remote and geographically dispersed areas or in informal urban environments.
Investments in infrastructure and supplying services in these areas and settlements tend to be costly. Second, regressive
price structures may be the result of store and size effects. The store effect refers to differences in pricing between
large and small stores for the same size and quality item. The size effect, on the other hand, refers to differences in
prices per unit of measure for various sizes offered for a particular product within any given store (Mendoza, 2008). A
third source is that of market failures that includes imperfect information and high transaction costs.
6 Small-Scale Water Providers in Kenya: Pioneers or Predators?Conceptual Framework: The Poverty Penalty
in the Urban Market for Water
made available to poor populations in urban informal settlements, usage only improved when affordability
and physical accessibility were combined with health education. This shows the importance of enhancing
non-users’ awareness, skills and knowledge of health-related consequences of their decisions. A similar
seeming paradox of non-usage of professional health services has been reported in Guatemala. Efforts to
reduce maternal mortality among indigenous women, in particular, have been compromised by the cultural
inappropriateness of reproductive health services. The women report derogatory treatment and disregard
for their language and cultural traditions, such as a preference for vertical childbirth (CESR and ICEFI, 2009).
While the poor in general shoulder a poverty penalty in markets for water, health, credit and
telecommunications, there is evidence to suggest that the urban poor suffer an additional urban penalty.
The urban penalty is related to the fact that “cities concentrate poor people and expose them to unhealthy
physical and social environments” (Freudenberg et al., 2005, p. 2). UN HABITAT’s (2006) flagship publication,
State of the World’s Cities Report, reveals that outcomes in the areas of health, education, employment and
other key development indicators are significantly below average in urban informal settlements. Among
the main reasons are substandard housing and inadequate or non-existent essential services in informal
settlements.
In water markets, the poverty penalties discussed above are applicable to low-income households in urban
informal settlements. First, there is a combined quality- and price-related poverty penalty when the poor
are not connected to the utility’s piped network. This leaves households dependent on various forms of
formal and informal small-scale private provision. Households have little means of verifying the quality of
water supplied by mobile vendors. Sometimes, even fixed-point vendors may be offering water that has been
diverted illegally from the piped network via substandard pipes. 11 But the price charged by these small-scale
providers is much higher than that charged by the utility. The price-related poverty penalty is exacerbated
by the fact that slum dwellers lack space to store large quantities of water, and thus tend to purchase water
in smaller units (20-litre jerry cans). Furthermore, the expense of bulk water storage tanks makes them
unaffordable to the poor, and the tenure insecurity of semi-permanent dwellings discourages the installation
of infrastructure such as large water tanks.
Since water is essential to sustaining life, non-usage of available water supply is generally unlikely. This is
what economists call perfectly inelastic demand. The poor’s disadvantaged position in the market for water,
therefore, is likely to expose them to catastrophic expenditure burdens. When the cost burden becomes too
great, however, households may have little choice but to opt out of the market. They may choose instead to
rely on unprotected water sources at no monetary cost. But, this carries severe health risks. Where households
access water by means of illegal feeds off the water mains, leaks may jeopardize the safety of the piped water
supply.
11 Leakages due to low-quality plastic piping and improper fittings expose the water to contamination.
Small-Scale Water Providers in Kenya: Pioneers or Predators? 7The Data and Methodology
3. The Data and Methodology
Primary data for this study was collected through a representative household survey as well as structured
and topical interviews. Structured interviews with small-scale providers consisted of open-response
questionnaires to gather information on the water supply chain and the business model of small-scale water
vending. To understand the constraints in the water sector, as well as regulatory issues, we conducted topical
interviews with government officials and other key stakeholders. We also interviewed operators of tanker
trucks at Dagoretti Corner, a central convening point for privately owned water tankers operating in the
Nairobi city area.
The surveys were conducted in September 2010 in peri-urban and urban areas within Nairobi city. The sample
consists of 576 households and about 159 small-scale water providers interviewed in Dam, Kangemi Village,
Kaptagat, Kiambiu, Kinoo, Olepolos, Soweto East (Kibera) and Waruku. 12 For each location, the representative
sample for the household survey was decided on the basis of the approximate size of the population residing
in the community. The size of the sampling area, covered by a single enumerator, therefore varies with
population density. Less populated communities were divided into larger sampling area units, while highly
populated ones were subdivided into smaller area units.
Household randomisation was applied by distributing the enumerators across these non-overlapping
sampling area units that spanned the entire community. Because dwellings are located in a disorderly fashion
inside the informal settlements, no further systematic randomisation was possible beyond the geographical
sub-delineations. During the household data collection, a separate group of enumerators covered larger pre-
specified geographical areas, often spanning a couple or more household sampling area units. 13
12 The two OBA communities in our sample (Kinoo and Olepolos) were chosen according to the following criteria:
(i) characterised as urban or peri-urban locations (not rural); (ii) had participated in an OBA financing scheme; and
(iii) had completed at least one output assessment after project implementation. The other communities were chosen
on the basis of their not having received OBA and having similar demand for water to the OBA communities, proxied
by population size and similar demographic characteristics. As expected, OBA recipient communities have a relatively
lower number of private providers. This is because the water projects themselves offer in-dwelling piped connections
as well as water kiosk services to a large population.
13 This methodology holds a potential bias leading to a higher proportion of fixed-point vendors, relative to mobile
vendors, in our sample, than is the case in reality.
8 Small-Scale Water Providers in Kenya: Pioneers or Predators?Water Supply and Distribution
4. Water Supply and Distribution
4.1 Small-Scale Water Providers
As shown in Table 1, the fixed-point water suppliers (tap water vendors and water kiosks) make up 62 percent
of the small-scale water providers in our sample. The mobile suppliers (pushcart vendors and tanker tracks),
make up 20 percent of providers. These are followed by borehole water vendors, which make up 18 percent.
Table 1: Types of small-scale water providers
Type of providers Sample: Share (%)
number of providers
Tap water vendors 62 39
Water kiosks (including CBOs) a 37 23
Borehole water vendors 28 18
Pushcart vendors 17 11
Tanker trucks 15 9
Total 159 100
Source: authors’ survey.
a
CBO = community-based organisation.
Fixed-point vendors (tap water vendors and water kiosks): The services offered by the tap water vendors
and water kiosks are very similar. Tap water vendors are private entrepreneurs relying on a single piped
connection, usually selling water from their dwellings or from a separate legal connection in a strategic
location within the community. Households that engage in water reselling are another type of tap water
vendor. These vendors are unregulated and consist mainly of landlords supplying tenants, sometimes through
a small piped network.
Water kiosks tend to be formally licensed providers and are distinguished by their better infrastructure (a
cabin or small office). They are distributed across the community and offer services in official opening hours.
On average, vendors operate at least six days a week. Kiosks can usually serve more than one customer at a
time from two or more taps, thus speeding up the service rate. All these attributes contribute to the ability of
water kiosks to sell significantly more water than tap water vendors. While tap vendors in our sample sell on
average 94 20-litre jerry cans of water a day, the kiosks, on average, sell 238 jerry cans. Costumers walk to the
vending points to fill their own containers for a fixed rate per unit. 14
The typical tap water vendor or operator of a water kiosk is a woman. Water is a profitable business compared
to selling vegetables, cooking or cleaning. For both types of vendor, the average monthly per capita income
at the household level is Kshs 6,046.5 (US$2.43) per day. 15
14 About 69.2 percent of the tap and kiosk vendors reveal that a typical customer purchases water from them on a daily
basis, or on all days when the water vendor operates, since some vendors do not open seven days a week.
15 Conversion rate as of December 2010; US$1.00 = Kshs 80.5.
Small-Scale Water Providers in Kenya: Pioneers or Predators? 9Water Supply and Distribution
For both tap water vendors and water kiosks, the coverage area is localised: 87 percent of respondents report
selling water to residents within a few streets of the water point. Some vendors even have overlapping
geographic markets, implying high coverage levels for fixed-point vendors. These findings further indicate
that the distance between the household and the water source is relatively short, suggesting low levels of
time poverty.
In our sample, about 62 percent of fixed-point vendors declared that they have a legal connection to the
water utility network. About 35 percent seem to be reselling water from illegal connections: 24 percent are
illegally connected to someone else’s formal piped connection, and 11 percent declared “another piped
connection” that we assume consists chiefly of illegal connections to the main water grid, given the exclusion
of other legal alternatives presented in the survey questionnaire. Two percent sell water from a borehole and
one percent of vendors did not reveal the water source.
Most fixed vendors depend on the reliability of supply from the utility. They complain of supply disruptions
caused by rationing by the utility company. Water kiosk operators also complain of weak water pressure and
its negative impact on the service rate and the time spent in line by consumers.
Most fixed-point vendors operate between 12 and 15.5 hours a day, six or seven days a week. This schedule
is interrupted when pipes run dry as a result of rationing by the utility company. Where lighting is absent
because of the unavailability of electricity, business hours are further restricted due to security concerns.
CBO-run water projects (kiosks): Water and sanitation services are also provided by community-based
organisations (CBOs) or “Usafi Groups”. 16 These are groups of residents who together manage, operate and
maintain a number of sanitation blocks and associated water kiosks. CBO-managed water projects are usually
funded by the government’s Community Development Fund (CDF) or by non-governmental organisations
(NGOs). CBOs rely on a formal connection to the utility’s (NCWSC) piped network, paying a subsidised water
tariff of Kshs 15 (US$0.19) per m3. This rate is lower than the company’s commercial and residential rates. The
price charged per jerry can of water by the CBO is set by the utility at a uniform rate of Kshs 2 per 20-litre
jerry can. 17
The group of residents running the water and sanitation blocks are called “members”. They hold frequent
meetings that serve as forums for elections and decision making on all matters related to block operation and
the general welfare of community members. 18 Having discounted the monthly operational and bulk water
costs, the profit is reinvested or saved. Dividends are shared periodically among the members according
to a set formula. CBO-managed projects are good examples of participatory management and community
empowerment.
16 “Usafi” means “sanitation” in Kiswahili.
17 In all the settlements surveyed, CBO-managed sanitation blocks operate according to similar mechanisms, offering
water resale from a water kiosk as well as latrine and shower services at “social fees”. The sanitation blocks operate
according to a pay-as-you go scheme, with some CBOs offering monthly pre-paid family cards for unlimited use of
latrine and shower services.
18 Most water and sanitation blocks have an office within the block structure, where they archive the bookkeeping files. In
some cases, this office has also been used for the instalment of electricity metres associated with individual electricity
connections to the power utility, for which a group of households has applied collectively.
10 Small-Scale Water Providers in Kenya: Pioneers or Predators?Water Supply and Distribution
Borehole water vendors: The typical borehole vendor operates as a family business. Initially, the borehole
may have been constructed to serve the household and possibly a cluster of tenants. However, in the face of
mounting community demands, it has been transformed into a water vending business. A number of privately
owned boreholes, in the vicinity of Dagoretti Corner in Nairobi, supply a fleet of tanker trucks. Boreholes
comprise an essential water source for households not connected to the utility’s network. 19
Borehole construction is expensive and involves sunk costs associated with digging and construction, as well
as the purchase of pumps and storage tanks. Some vendors are able to finance construction through revolving
fund schemes. 20 Before construction can begin, an official authorisation is required. This may explain why
boreholes are found only in the formalised settlements of Kangemi Village, Kinoo and Olepolos. Concerns over
water quality and quantity are decisive factors in the regulator’s decisions to authorise borehole construction.
But quality testing is carried out only at the time of licensing, with no subsequent monitoring. This, as we shall
see later, has serious implications for the quality of the water distributed.
In contrast to the fixed-point vendors discussed above, who are dependent on a reliable supply provided by
the utility company’s piped network, borehole vendors are better positioned to take advantage of negative
water supply shocks in the network. Our interviews indicate that these vendors violate their tariff obligations
by inflating prices during dry spells. Borehole supply, however, also suffers from supply disruptions, caused
by power outages. 21
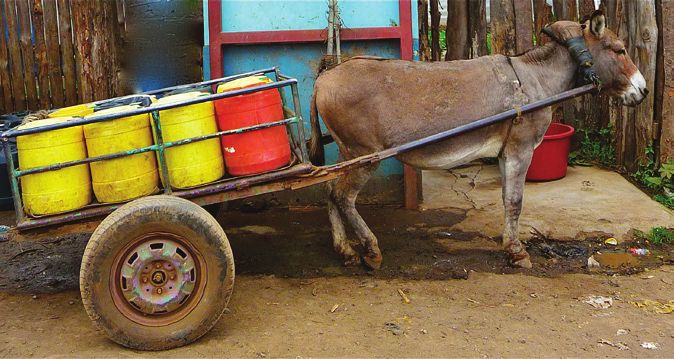
Pushcart vendors: Operators of manual and donkey-pulled pushcarts obtain water mostly from boreholes,
water kiosks or through an illegal connection to the piped network. They resell water to end users in 20-litre
jerry cans. Less than half of the providers surveyed said that they were subject to regulation.
A typical pushcart water vendor is a man in his mid-thirties with two family dependants, earning an average
monthly per capita household income of Kshs 9,948 (US$4.12 per day). This amount is well above the US$2.43
per day income received by fixed-source water providers, who supply quality water because they are directly
connected to the utility’s network. Pushcart vendors deliver water to households in urban informal settlements
by manual pushcarts or by donkey-pulled carts in peri-urban areas. The initial investment cost consists of
buying 15 to 30 jerry can containers at Kshs 200 per unit, and acquiring the pushcart (about Kshs 5,000) or
renting it. Operating costs include cart maintenance as well as animal feed and care.
Our survey indicates that the competitive advantage of mobile vendors lies primarily in their ability to reduce
the time cost for households associated with obtaining water by offering door-to-door vending. These vendors
also play a larger role where kiosks and tap vendors either are absent or are too few to provide an adequate
supply of water. About 64 percent of pushcart vendors serve households located far from any fixed-point
water source. They may either walk house to house offering services or, more efficiently, deliver in response
19 A large borehole has been built on the main highway (Embulbul) to service an apartment building that is under
construction, but it now serves a mix of private households, pushcart vendors and tanker trucks. Another borehole,
initially constructed to provide water supply to a church facility, now supplies the community and mobile vendors at a
price that is competitive compared to that offered by water kiosks in the area.
20 Also known as “merry-go-round”.
21 For instance, the Kinoo Water Project’s network is supplied in part by water from two boreholes. The central transformer
supplying the community with electricity has been vandalised. Since then, the project’s water kiosks have been closed.
Small-Scale Water Providers in Kenya: Pioneers or Predators? 11Water Supply and Distribution
to mobile phone orders. Some vendors also have a number of regular customers, who receive a daily supply
and therefore may qualify for a lower rate. A single mobile vendor serves, on average, 16 customers per day.
Tanker trucks: Privately operated tanker trucks supply water in bulk to end users who can afford storage
tanks. Tanker trucks obtain water either from private boreholes or directly from the utility company. Borehole
water vendors supply water to mobile vendors for resale, but also sell water directly to end users. A fleet of
tanker trucks and exhauster vehicles gathers daily at Dagoretti Corner, a location on the outskirts of Nairobi
city that has strategic access to a number of borehole water vendors. 22 Exhauster vehicles service households
that are not connected to a sewer line and empty pit latrines when they are full. Tanker trucks deliver water
to private homes or firms, where they replenish storage tanks. They do so in response to mobile phone calls,
covering all of Nairobi. Some tanker trucks operate 24 hours a day.
The average truck operator is a male in his mid-thirties. The business is typically operated as a family business,
passed from father to son. Some vendors purchase their own truck, while others rent a vehicle from the
Nairobi City Council (NCC). All tanker truck operators require a business permit, issued by NCC for a fee. Truck
operators incur recurrent costs associated with truck maintenance, parking fees, and operational equipment
such as gloves, piping and pumps.
Some government officials allege that the truck operators at Dagoretti Corner are sometimes involved in
disrupting the piped supply network in order to boost demand. There are also stories of exhauster vehicles
being refurbished into water tankers in response to soaring demand at the peak of the 2009 drought.
CBOs receiving output-based aid: Kinoo and Olepolos are two peri-urban areas in Nairobi city that qualified
for output-based aid (OBA) funding in the pilot phase of the Global Partnership on Output-Based Aid
(GPOBA). 23 OBA is an aid modality based on ex-post grant disbursements that partially cover the original
costs of an investment project. 24 Aid is granted to the recipient project via debt cancellation upon successful
achievement of pre-determined output targets. These projects have been licensed to finance, build, own and
operate their own small piped water systems. 25 OBA-funded projects have thus replaced the municipal utility
company as primary water providers.
The OBA funding scheme has two financing components. First, the water project must qualify for a bank
loan with the financial partner, K-Rep Bank. Within a year of the loan’s disbursement, the project has to meet
the targets set out in the loan agreement in order to release a World Bank subsidy worth 40 percent of total
project costs towards repayment of the bank loan. 26 The remaining 60 percent of the project costs are to be
covered partly by a 20 percent community contribution.
22 Some borehole owners have their own tanker truck.
23 Because the governance structure of the water sector in Kenya is organised according to catchment areas, Kinoo and
Olepolos — while being part of Nairobi City — fall under the authority of the Tanathi Water Services Board rather than
Athi Water Services Board, which covers downtown Nairobi.
24 Most of the funding comes from the World Bank.
25 See K-Rep Bank (2010).
26 Five annual targets are usually set for the years following the end of the project, but the first is decisive as to whether
the water project will receive the entire 40 percent subsidy of the full project cost.
12 Small-Scale Water Providers in Kenya: Pioneers or Predators?Water Supply and Distribution
The project in Olepolos serves about 600 households through individual piped connections and two water
kiosks. The network is supplied by two boreholes, from which water is pumped into a single tank and then
distributed by gravity flow to individual households. The OBA loan agreement specifies two project outputs:
(i) increased coverage (minimum 50 individual connections annually over the five-year implementation
period); and (ii) higher revenue by increasing the metering ratio and the number of connections (average
Kshs 600,000 per month). 27 Coverage increased from 557 to 619 individual household connections between
March 2009 and September 2010. 28 Infrastructure improvements have reduced the average unaccounted-for
water rate from 42 percent to 23 percent.
The project mobilised the required 20 percent down payment (Kshs 2 million) by charging Kshs 3,000 (about
US$37.27) per connected household. In addition to the cost of the water consumed, households paid a one-
time membership fee of Kshs 30,000 (US$373) to join the household distribution system plus an additional
Kshs 5,000–10,000 (US$62 to US$124) to finance the cost of the pipe extension to the household. Households
were responsible for purchasing their own metre. Given its satisfactory compliance with the achievement
targets, the Olepolos Water Project has been deemed eligible to receive the full OBA amount equivalent to
40 percent of the investment.
Despite the successful increase in connections, and the construction of a second water kiosk in 2007, the
Olepolos water project currently meets only 60 percent of water demand. At the time of this study, households
still received water for only a couple of days a week, in line with a set rota involving seven distribution zones.
Households therefore continue to depend on large water tanks of 6,500-litre storage capacity. The remaining
service gap is filled by other small-scale providers. 29
The Kinoo Water Trust Project (KWTP) started in 1974 when about 50 community members got together to dig
a borehole on a self-help basis. Today, the project operates a piped distribution system serving 389 individual
households and two water kiosks. 30 Water is extracted from a spring and then pumped into a central storage
tank from which it is redistributed via the gravity-flow piped distribution network. 31 Households are required
to pay a membership fee of Kshs 100 per month towards the purchase of pumps. The initial connection/
registration fee is Kshs 1,000 and the project charges a flat rate of Kshs 350 (US$4.35) per month, irrespective
of the level of consumption. 32
In 2006/2007 the KWTP was deemed eligible to participate in a five-year OBA scheme to finance the
construction of a second water catchment source (a spring); the installation of metres in all existing
connections; the building of three water kiosks; and a new pump and tanks for the existing borehole. At a
27 See Tertiary Engineers Consulting Ltd. (2009).
28 See PricewaterhouseCoopers (2010b).
29 The project managers argue that the community needs another borehole in order to increase water supply. Boreholes,
however, cannot be financed through an OBA scheme because borehole construction is a risky investment (the water
could be of poor quality or the borehole could dry out).
30 See PricewaterhouseCoopers (2010a).
31 There are currently seven supply lines, or “distributional zones”, in operation - one of them still accepting new
connections.
32 In the 1990s, developers built a large number of houses, increasing the village’s population by about 10,000. The new
houses applied for connections to the Kinoo Community Water Project but applications were rejected due to the
project’s limited water-supply capacity. Instead, developers were given licenses to dig boreholes.
Small-Scale Water Providers in Kenya: Pioneers or Predators? 13Water Supply and Distribution
cost of Kshs 4.8 million (US$59,627), the project’s expansion led to an increase in water-supply frequency from
once a week to approximately twice a week.
At the time of the Output Verification Report, which was produced by the independent auditing company,
PricewaterhouseCoopers, the project had increased the number of household connections from 350 to 500 and
had completed the construction of one kiosk. But KWTP failed to meet the household metering targets for the
first year. 33 Consequently, the community received only 35 percent of the loan repayment from the donor. 34
Figure 2 captures the water-supply system in Nairobi city. It shows the utility as the main provider, supplying
individual households as well as fixed-point formal vendors such as water kiosks and tap water vendors via
piped connections. It also shows the many types of informal water provision and the many transactions that
some water goes through before reaching the end user. For example, a pushcart vendor may be selling water
by the jerry can, having obtained the water from a kiosk supplied by NCWSC’s piped network.
4.2 Water Pricing
The price-setting behaviour of small-scale providers indicates substantial levels of extraction in response
to excess demand. Among the small-scale providers surveyed for this study, the majority of water kiosks
(59.5 percent), pushcart vendors (47.1 percent) and tap water vendors (36.1 percent) set water prices on the
basis of the price charged by competitors (see Table 2). About a third of tap water vendors and pushcart
vendors declared that they set prices on the basis of a cost mark-up. Another indication of the significant
extraction levels is the relatively high share of tap water vendors (23 percent) and borehole water vendors
(22 percent) who set prices on the basis of what they believe the costumer is able to pay.
Kiosk, tap and borehole operators also admitted to pushing up prices in times of limited supply and
excess demand. Still, kiosks, on average, offer the lowest price with the lowest variance (see Table 3). One
explanation for their lower price may be the higher degree of official tariff compliance by fixed-point vendors,
and especially by licensed kiosks buying water at the subsidised bulk water rate from the utility company.
The presence of water kiosks generally seems to be putting downward pressure on the prices charged by
individual tap water vendors, the competitor most similar to water kiosks. The declared price setting strategy
of tanker trucks could be taken to suggest a high degree of market competition, with prices being based
mainly on the cost of provision (operational and bulk water costs) and distance (transport costs). With tanker
trucks operating from a single gathering point in the city, however, price collusion can easily occur. 35
33 Within the first year of OBA funding, the Kinoo Water Project had installed only 150 of the output target of 170 metres.
The project managers argue that the budget was exhausted before they could install all the required metres because
of unexpected expenses associated with a land dispute at the location of the water spring.
34 After the metres were installed, the project needed to improve the distribution system further, but lack of funds
impeded this improvement.
35 The formally licensed kiosks, linked to the utility, charge water at a fixed rate of Kshs 2 per jerry can. The same applies
to CBO-managed kiosks supplied via a piped connection to the utility network. As for kiosks supplied by OBA financed
water projects, they also operate under a transparent tariff scheme. Tariffs are listed on a board affixed to the kiosk
structure. However, while NCWSC-provided kiosks operate under the utility’s annual tariff agreement with the
regulator, OBA kiosks are bound under the loan agreement to contribute to revenue generation. Thus, in the case
of Kinoo for instance, prices were recently increased following a rise in the cost of electricity, an essential input for
running the borehole pumps.
14 Small-Scale Water Providers in Kenya: Pioneers or Predators?Water Supply and Distribution
Figure 2: The water supply chain in Nairobi city
Utility (NCWSC)
Household and OBA-funded
resellers community
water projects
Water kiosks
(incl. CBO-run)
End Tanker
trucks
and public taps
users
Pushcart Borehole
vendors water vendors
Mode of transportation: Regulation:
Piped water connection Regulated providers
Transported water (tanker truck)
Unregulated providers
Transported water (jerry can)
Water fron non-improved or illegal sources
Table 2: Price determination across different private providers
How do you decide what to charge? Tap water Water kiosk Borehole Pushcart Tanker
vendor (%) (%) water vendor (%) truck (%)
vendor (%)
Cost of service provision 34.4 27.0 66.7 35.3 53.3
Your income needs 6.6 5.4 11.1 - -
Prices charged by competitors 36.1 59.5 - 47.1 6.7
What you think the customer can pay 23.0 8.1 22.2 5.9 6.7
Distance from the water source - - - 11.7 33.3
Total observations 61 37 9 17 15
Source: authors’ survey.
Note: the survey asked providers to list all responses that apply.
Small-Scale Water Providers in Kenya: Pioneers or Predators? 15Water Supply and Distribution
Table 3: Price of water across vendors in Kshs (20 litres, jerry can unit)
Type of provision Mean Standard Minimum Maximum Mean Poverty Poverty
deviation price in premium premium
US$ (mean) a (max)
Pushcart vendor 12.15 5.73 3.00 21.00 0.15 30.28 51.5
Tanker truck 7.90 5.47 3.00 22.50 0.10 18.75 55.25
Borehole 6.11 3.50 2.00 15.00 0.07 14.28 36.50
Tap water vendor 3.18 1.68 2.00 15.00 0.04 6.95 36.50
Water kiosk 2.81 0.98 1.00 5.00 0.03 6.03 11.50
Average 6.43 3.47 2.20 15.70 0.08 15.26 38.25
Official NCWSC water kiosk rate 2.00 0.00 2.00 2.00 0.02 4.00 4.00
Source: authors’ survey.
Note: conversion rate: US$1 = Kshs 80.5.
a
This is calculated using the poverty premium formula proposed by Mendoza (2008):
Pushcart vendors and tanker trucks charge the highest average unit prices for water, at Kshs 12.15 and
Kshs 7.90 per 20-litre jerry can, respectively (see Table 3). Service providers in these categories also present
the highest degree of price differentiation among vendors. The larger price variance may be a result of the
discretion with which mobile vendors are able to set prices. Mobile vendors also rely on several different
water sources. This allows them to take advantage of excess demand during dry spells, when the piped
supply suffers severe interruptions. Tariff regulation can more easily be exercised over fixed-point vendors,
mainly because they are licensed and registered with the utility. Mobile vendors, on the other hand, largely
remain unregulated in terms of the price and safety of water.
The poverty premium on water in Nairobi is calculated by comparing prices charged by small-scale providers
with the official rate of Kshs 0.40 per 20 litres charged by the utility for water provided by individual piped
connection. 36 For instance, our survey found that the mean price charged by pushcart vendors is Kshs 12.15
per 20 litres of water. This price level translates into a poverty premium of 30.28 (see Table 3). In other words,
low-income households who obtain water from pushcart vendors are paying 30.28 times the price charged
by the utility through a piped connection. Our data also shows that some households are paying as much
as 51.5 times the price charged by the utility. This is the maximum premium indicated in the last column of
Table 3. For all small-scale providers we find that low-income households pay, on average, about 15 times the
price charged by the utility.
We further illustrate the findings in Table 3 using the simple graphical presentation in Figure 3. The highest
poverty premium is related to water provided by pushcart vendors, followed by tanker trucks and boreholes.
It is interesting to note that the poverty premiums associated with fixed-point water vendors — the tap water
vendors and water kiosks — are the lowest. Short of extending piped connections to all households, therefore,
36 Following Mendoza (2008), we calculate the poverty premium associated with private water provision as: . We
use the official NCWSC rate of Kshs 0.40 per 20 litres, charged for consumption of a maximum of 10m3 per month, as
our baseline (see Annex 3). This is the equivalent of 333 litres per household per day, or 95 litres per person per day,
assuming an average household size of 3.5 persons (the figure for our sample is 3.3).
16 Small-Scale Water Providers in Kenya: Pioneers or Predators?Water Supply and Distribution
the poverty premium on water could be reduced significantly by increasing coverage of the utility-operated
water kiosks and enforcing the official kiosk tariff of Kshs 2 per 20-litre jerry can.
Figure 3: Average poverty premium on water across vendors
Source: authors’ survey.
Note: the poverty premium is calculated against a baseline of Kshs 0.40 per 20 litres. This is the rate
charged by NCWSC for customers with piped connections who consume less than 10m3 per month.
The higher prices charged by mobile vendors are consistent with the reason for entering the business.
Unemployment was the leading reason given by pushcart and tanker truck operators for starting water-
vending businesses. About 30 percent of vendors reported the profitability of operations as the main reason
for entering the business. In contrast, tap water vendors, borehole water vendors and operators of water kiosks
identified community needs as their main motivation for starting operations (see Table 4). By implication, any
intervention in the water market that seeks to eliminate mobile water vending is likely to push these vendors
back into unemployment. Assuming that men are the main breadwinners, risk of unemployment undermines
the livelihoods of already poor families. A true pro-poor intervention must therefore involve considerations of
the poor as both consumers and providers.
Table 4: Reasons for entering the water-vending business
How did you first get involved in water Tap water Water Borehole Push-cart Tanker
selling? vendor kiosk (%) water vendor truck (%)
(%) vendor (%) (%)
Jobless/needed income 15.5 27.0 10.0 50.0 40.0
Profitable business 36.2 27.0 30.0 31.3 40.0
Community need/neighbour needed 37.9 43.2 40.0 12.5 20.0
Inherited business/parents were involved 10.3 2.7 20.0 6.3 -
Total observations 58 37 10 16 15
Source: authors’ survey.
Small-Scale Water Providers in Kenya: Pioneers or Predators? 17Demand for Water and Consumption
5. Demand for Water and Consumption
Living conditions of households: The mean size of households is 3.3 members, and 74.3 percent of
households have between three and five members. Across the nine communities, female-headed households
account for 15–40 percent of all households. The literacy rate among household heads is high: more than
95 percent of household heads report that they can either read, write or do both (see Table 5). The average
educational level of household heads varies little across communities: household heads have studied up to
secondary level, although most have not completed secondary schooling. Despite similar levels of education,
however, per capita income varies significantly across communities. Households in Kaptagat and Kiambiu are
the poorest. On average, Olepolos, Kinoo and Kangemi Village have higher-income households. These are
also the only three communities in the survey in which owners of structures hold formal titles to the land. 37
Table 5: Average living standard of households in selected urban
communities in Kenya
Community Years living HH size Female- HH head HH head’s HH head’s Income
in the headed is literate age educ. per capita
community (%) (%) level per day
(US$)
Dam 8.9 3.0 15.4 96 35.2 4.5 1.61
Kangemi Village 9.3 3.3 30.7 97 32.5 4.2 3.33
Kaptagat 9.7 3.2 16.7 100 39.0 4.6 1.13
Kiambiu 7.3 3.6 40.3 97 33.2 4.0 1.00
Kinoo 9.4 3.1 22.4 98 33.1 5.0 2.82
Olepolos 10.4 3.3 20.2 95 34.6 4.5 3.00
Soweto East 9.1 3.0 33.0 98 31.5 4.3 1.30
Waruku 8.8 3.7 22.8 99 30.6 4.5 1.46
All communities 9.2 3.3 26.4 97 33.0 4.5 2.04
Source: authors’ survey.
Note: educational level was recorded as a categorical variable with the following values: 1—never in school;
2—primary incomplete; 3—primary complete; 4—secondary incomplete; 5—secondary complete; 6—tertiary
incomplete; and 7—tertiary complete. The community in Dam village neither received OBA nor had CBO-operated
water provision. Residents rely entirely on water reselling by small-scale providers. In Kangemi Village, where owners
hold formal titles to the land, residents are extensively involved in water reselling from individual piped connections
and privately owned boreholes.
Access to water: World Health Organization (WHO) recommends a daily per capita consumption level of
20 litres for drinking, cooking and hygiene purposes as the minimum quantity of water needed to sustain
a livelihood. Among the households surveyed, about 57 percent fall below this water-poverty threshold
(see Figure 4). The Waruku community, which has recently suffered extensive demolition of dwellings, has
37 Many of the residents surveyed did not own the structure in which they lived. Rather, it was sublet from a wealthier
landlord or “structure owner”. Structure owners themselves may or may not live in the communities where they own
structures.
18 Small-Scale Water Providers in Kenya: Pioneers or Predators?You can also read