Socio-structural Injustice, Racism, and the COVID-19 Pandemic: A Precarious Entanglement among Black Immigrants in Canada
←
→
Page content transcription
If your browser does not render page correctly, please read the page content below
Volume 16, Issue 1, 123-142, 2022

Socio-structural Injustice, Racism, and the
COVID-19 Pandemic: A Precarious
Entanglement among Black Immigrants in
Canada
JOSEPH MENSAH
York University, Canada

CHRISTOPHER J. WILLIAMS
York University, Canada

ABSTRACT As several commentators and researchers have noted since late spring
2020, COVID-19 has laid bare the connections between entrenched structurally
generated inequalities on one hand, and on the other hand relatively high degrees of
susceptibility to contracting COVID-19 on the part of economically marginalized
population segments. Far from running along the tracks of race neutrality, studies
have demonstrated that the pandemic is affecting Black people more than Whites in
the U.S.A. and U.K., where reliable racially-disaggregated data are available. While
the situation in Canada seems to follow the same pattern, race-specific data on
COVID-19 are hard to come by. At present, there is no federal mandate to collect
race-based data on COVID-19, though, in Ontario, at the municipal level, the City of
Toronto has been releasing such data. This paper examines the entanglements of race,
immigration status and the COVID-19 pandemic in Canada with particular emphasis
on Black immigrants and non-immigrants in Toronto, using multiple forms of data
pertaining to income, housing, immigration, employment and COVID-19 infections
and deaths. Our findings show that the pandemic has had a disproportionate negative
impact on Black people and other racialized people in Toronto and, indeed, Canada.

KEYWORDS COVID-19 pandemic; racism; Black people; visible minorities; Toronto;
Canada

Introduction

As Canada is a White settler society, Black people are routinely tagged as the
binary opposite of “true” Canadians in many identity-related discourses –

Correspondence Address: Joseph Mensah, Faculty of Environmental and Urban Change, York
University, Toronto, ON, M3J 1P3; Email: jmensah@yorku.ca

ISSN: 1911-4788
124     Joseph Mensah & Christopher J. Williams

especially of the us-versus-them ilk – with other racialized groups typically
situated between these polarities. In addition to the discursive domains in
which this diametric opposition holds true, it is also actualized at the level of
social structure vis-à-vis the relative positions of Whites and Blacks within
the Canadian class structure. Consider, for example, 2016 Census data on
income deciles, which show that 67% of Black people are in the bottom five
income deciles, whereas 47% of those designated as “not a visible minority”
are similarly situated.1 Not only do such income differentials reflect what
scholars of racism (e.g., Goldberg, 1997; Jardina, 2019) mean by racialized
class structures, they also draw attention to questions of how racially
differentiated life chances intensify in the context of crises such as the
COVID-19 pandemic.
   Studies show that the pandemic is affecting Blacks more than Whites in
both the U.S.A. and U.K., where reliable data are available (Booth & Barr,
2020; Stafford et al., 2020). While the situation in Canada seems to follow
the same pattern, data on COVID-19, broken down by race, are hard to come
by. Presently, there is no federal mandate to collect race data on COVID-19,
though the City of Toronto has started collecting such data, just as Montreal
and Vancouver are using neighborhood data as proxies to ascertain the
impacts of the pandemic on different ethno-racial groups. The literature on
social determinants of health shows that health risks vary based on race and
other socioeconomic variables such as income, gender, and age (Cockerham,
2013; Thisted, 2003). However, very little is known about how these aspects
are playing out regarding COVID-19 in Canada due to the dearth of data.
Still, one can hypothesize that the pandemic is affecting racialized people
more than Whites, given their over-representation in such frontline sectors as
healthcare and social services (Subedi et al., 2020). Additionally, Black
people and other racialized groups are more likely to have difficulties
adhering to public health protocols pertaining to the pandemic because of
factors beyond their control. For instance, it is not easy to keep physical
distance in overcrowded homes and neighborhoods where many Black people
in Canada find themselves.
   This paper examines the entanglements of racism, socio-structural
constrains, and COVID-19 infections in Canada with emphasis on Black
people (both immigrants and non-immigrants) in Toronto, where some
reliable race-based data on COVID-19 exist. The paper also uses the modest
data available to shed light on the situation in the gateway cities of Montreal
and Vancouver, where there are sizeable Black populations. While racism has

1
  The Employment Equity Act (1995) defines visible minorities as “person, other than Aboriginal
peoples, who are non-Caucasian in race or non-white in colour.” In the census, the category “not
a visible minority” includes respondents who reported Yes to the Aboriginal identity question as
well as respondents who were not considered to be members of a visible minority group. In
addition to Caucasians and Aboriginals, the “not a visible minority” category includes persons
who reported “Latin American,” “Arab,” or “West Asian” and who provided a European write-in
response such as French (Statistics Canada, 2016, p.1-4).

Studies in Social Justice, Volume 16, Issue 1, 123-142, 2022
Socio-structural Injustice, Racism, and the COVID-19 Pandemic 125

little regard for the immigration status of Black people, the imbrication of
race and immigrant status often intensifies the challenges of Black
immigrants in accessing government support systems in crises. As COVID-
19 is a moving target, the data we use represent a snapshot at the time of
writing.
   Every so often, the role of the government is re-forged in times of crisis.
With the pandemic, many orthodoxies on how we work, socialize, and relate
to government institutions have been upended. As a corollary, it is imperative
that we formulate our mitigation strategies in accord with social justice, given
the social and racial disparities that are part and parcel of the COVID-19
pandemic. The significance of individual resistive agency cannot be
altogether gainsaid; however, individual agency is inescapably constrained by
structural constraints, making social justice advocacy doubly important. Even
though theories of social justice abound, many of which propose specific
formulae for their advocacy (e.g., Kant, 1998; Rawls, 1971; Sen, 2009), we
could not agree more with Sen’s (1999, p. 283) observation that in resolving
social injustice, “it is not so much a matter of having exact rules about how
precisely we ought to behave, as of recognizing the relevance of our shared
humanity in making the choices we face.” Accordingly, we draw quite
eclectically on the works of scholars such as Rawls (1971), Sen (2009),
Foucault (1997, 2004), Mbembe (2019), and Agamben (1998) to espouse a
social justice position that highlights the (bio)politics implicated in the
pandemic to affirm our common humanity. With insights from these scholars,
we suggest ways to approach the pandemic to improve the life chances of
Black people and other racialized populations in Canada.

The Black Population in Canada: A Profile

Black Africans were among the first non-Indigenous residents of Canada,
with a history going back to the 17th century (Walker, 1996). Still, it was only
after the introduction of the immigration points system of the 1960s that free
Black African immigrants and refugees began to arrive in significant numbers
(Winks, 1997; Walker, 1996). The Black population in Canada is highly
heterogeneous in its ethnicity, immigration status, generation, place of origin
and other factors, with some coming from continental Africa, others from the
Caribbean, United States, Europe, and elsewhere, and still others tracing their
nativity to Canada as “indigenous” Black Canadians (Mensah, 2010). Unlike
the United States, the Black population in Canada is relatively small. For
instance, whereas Black people accounted for 10.5% of the US population in
1961, the corresponding figure in Canada at that time was 0.2% (Hackworth,
2016). By 2011, the relative share of the Black population in Canada had
increased tenfold, but still stood at only 2.88%. The 2016 Census puts the
total number of Black people in Canada at 1.19 million, which is 3% of the
Canadian population. Still, Black people are the third largest racialized group

                  Studies in Social Justice, Volume 16, Issue 1, 123-142, 2022
126 Joseph Mensah & Christopher J. Williams in Canada, after South Asians and Chinese. Of the estimated 1.19 million Black people in Canada, 623,190 (or 52%) are immigrants, while the rest are either non-immigrants (531,090 or 44%) or non-permanent residents (44,280 or four percent). Even though Black people in Canada come from around the world, the majority come from Africa and the Caribbean. Available data (Statistics Canada, 2018) show that the leading source countries of African-born immigrants, based on the 2016 Census, were Morocco (72,905), Egypt (67,195), Algeria (67,045), Nigeria (52,380), and Republic of South Africa (48,015); others include Ethiopia (34,295), Kenya (28,840), Somalia (28,190), DR Congo (27,800), and Ghana (24,660). Indeed, people from northern African countries such as Egypt, Morocco, and Algeria often see themselves as Maghrebi. Also, one would expect that many of the immigrants from South Africa would be White, rather than Black, given the racial differences in education and income in that country, and Canada’s general preference for professionals and higher income people in its immigration pool. However, as Mensah (2020) points out, the number of African-born immigrants increased from 398,100 in 2006 to 689,630 in 2016. Regarding the Caribbean, the top source countries of immigrants to Canada in 2016 were Jamaica (144,225), Haiti (97,140) Trinidad and Tobago (66,325), Cuba (18,905), Barbados (15,085), and St. Vincent and Grenadines (13,930). Other top sources included the Dominican Republic (11,880), Grenada (10,500), St. Lucia (6,810), and Dominica (2,865). These same countries were the top sources in 2006, with a few of them changing their rankings. Obviously, not all immigrants from Caribbean countries are Black, given the longstanding ethno-racial mixing in that part of the world. At the same time, the Caribbean remains a fecund source of Black immigrants in Canada. Notwithstanding the complex spectrum of ethno-racial gradation in the Caribbean, more than 90% of Jamaica’s and Haiti’s populations are Black, while more than a third of Trinidad and Tobago’s population is Black (Thomas, 2012). Table 1 gives a snapshot of selected socioeconomic characteristics of Black people and other Canadians as of 2016. Clearly, to be Black or another racialized group in Canada comes with socio-economic costs. For instance, while the educational level of visible minorities – as measured by the percentage of those with Bachelor’s level education or more – is higher than that of non-visible minorities, the former still have higher unemployment rates, higher prevalence of low incomes, and far lower median incomes (Table 1). In the specific case of Black people, the data show that even though their level of education is fairly similar to that of the non-visible minority population, their unemployment rate is far higher, just as their prevalence of low income is twice as high as that of non-visible minorities. Additionally, the median income of Black people was 75% that of non-visible minorities in 2016. Although Black people are not always at the very bottom Studies in Social Justice, Volume 16, Issue 1, 123-142, 2022
Socio-structural Injustice, Racism, and the COVID-19 Pandemic 127

of the metrics shown in Table 1, they are usually among those who are worst
off, together with West Asians, Koreans, and Arabs. Also, while current
disaggregated data are not readily available, it is reasonable to expect
Indigenous peoples, as well as the immigrants among Black people and other
racialized groups, have equally, if not far more, straitened socio-economic
circumstances, based on previous studies such as Galabuzi (2006), Block and
Galabuzi (2011), and Mensah and Williams (2017).

 Group                With Bachelors   Unemployment    Prevalence     Median
                      Degree or        Rate (%)        of Low         Income ($)
                      Above (%)                        Income (%)
 South Asian          38.3             9.2             16.5           25,280
 Chinese              39.5             7.9             23.4           22,973
 Black                20.1             12.5            23.9           27,263
 Filipino             36.0             5.2             7.4            32,508
 Latin American       25.1             9.1             19.8           26,843
 Arab                 38.0             13.5            36.2           20,803
 Southeast Asian      20.3             8.2             17.6           25,048
 West Asian           41.1             11.0            34.7           19,107
 Korean               46.1             8.4             32.6           18,795
 Japanese             36.6             6.4             12.9           32,200
 Visible              18.9             8.6             18.5           29,409
 Minorities n.i.e.1
 Multiple visible     29.7             8.6             16.7           26,653
 Minorities
 Total visible        33.9             9.2             20.8           25,514
 minorities
 Not a visible        20.3             7.3             12.2           36,538
 minority
 Total Canada         23.2             7.7             14.2           34,205

Table 1. Selected socio-economic characteristics by ethno-racial background,
2016 (Source: Statistics Canada, 2016).

  Undoubtedly, occupation is a social determinant of health risks. Those in
frontline occupations such as health care, transportation, and sales are likely
to face relatively high exposure to COVID-19, since they have few options
but to work outside their homes. According to the National Occupational
Classification data (Table 2), while the percentage of Black people in
Management occupations is 5.38% (which is far lower than the “all
Canadians,” visible minority, and non-visible minority averages of 11.02%,
8.74%, and 11.63%, respectively) the percentage of Black people in health
occupations is 11.19%; the comparable shares for “all Canadians” (6.81%);
visible minorities (8.00%) and non-visible minorities (6.49%) are all lower.
Similarly, when it comes to sales and service occupations, Black people are
over-represented in comparison to “all Canadians,” visible minorities, and
non-visible minorities as groups.

                      Studies in Social Justice, Volume 16, Issue 1, 123-142, 2022
128 Joseph Mensah & Christopher J. Williams National Canada Blacks Visible Non-Visible Occupational N=18,268,120 N=578,530 Minority Minority Classification (%) (%) N=3,896,330 N=14,371,790 (NOC) (%) (%) 0: Management 11.02 5.38 8.74 11.63 occupations 1: Business, finance 15.73 14.88 15.50 15.79 and admin occupations 2: Natural and applied 6.97 5.20 9.19 6.36 sciences and related occupations 3: Health occupations 6.81 11.19 8.00 6.49 4: Occupations in 11.70 12.37 9.92 12.18 education, law and social, community and government services 5: Occupations in art, 3.05 2.44 2.30 3.25 cultures, recreation and sport 6: Sales and services 23.35 29.08 28.48 21.96 occupations 7: Trades, transport and 14.60 12.56 10.65 15.68 equipment operators and related occupations 8: Natural resources, 2.27 0.91 0.92 2.64 agriculture and related production occupations 9: Occupations in 4.45 5.94 6.24 3.97 manufacturing and utilities Total 100.00 100.00 100.00 100.0 Table 2. Canada: Occupational classification by ethno-racial background, 2016 (Source: Statistics Canada, 2016). While recognizing the considerable capacity of anti-Black racism to impose structural/material hardships on Black people in Canada, it is important to note that the Black Canadian population has discernible intra- group differentiation, with respect to unemployment rates and other economic indices, along the axes of immigration status. Across Canada, for example, Black people aged 25-64 who are non-immigrants had an unemployment rate of 9.7% (based on the 2016 census); the corresponding figure for their immigrant counterparts who arrived in the 2011 to 2016 period was much higher at 15.1%. Focusing on a particular subset of the Black Canadian population age 25-64, namely those with bachelor degrees and higher, reveals an unemployment gap of even greater magnitude. Among non-immigrants, the unemployment rate was 5.8%, whereas among immigrants who arrived from 2011 to 2016 the unemployment rate was 2.7 times higher at 15.5% (Statistics Canada, 2017). Clearly, then, our observations about structural disadvantage among Black Canadians in general apply with even more force to Black people who are relatively recent arrivals to Canada. As we shall Studies in Social Justice, Volume 16, Issue 1, 123-142, 2022
Socio-structural Injustice, Racism, and the COVID-19 Pandemic 129

soon see, on the basis of available data from Toronto, media accounts and
related studies (e.g., Carman, 2020; Subedi et al., 2020), COVID-19 has
affected Black people and other racialized groups more than members of the
dominant majority.

Theoretical Background and Preliminary Empirical Considerations

In the course of responding to the findings of an October 2020 Statistics
Canada report on COVID-19 mortality in Canada’s ethno-cultural
neighbourhoods, Dr. Andrew Boozary, executive director of Population
Health & Social Medicine at the University Health Network in Toronto, had
this to say:

  This isn’t about a deficiency in people or communities. These are structural
  deficiencies that we’ve allowed to take place because of structural racism,
  because of structural discrimination… everyone in public health could have
  predicted where COVID was going to be most concentrated because of the
  structural vulnerabilities, because of the impossible situations that certain
  populations and neighbourhoods are in. (Carman, 2020)

These observations by Dr. Boozary are in close accord with substantial
bodies of research, which explicate how particular socio-structural
configurations generate predictable patterns of racially differentiated life
chances that persist quietly decade after decade, but reveal themselves loudly
in the context of crises such as the COVID-19 pandemic (Guinier & Torres,
2003). Additionally, Dr. Boozary’s reference to the “impossible situations”
faced by populations victimized by prevailing structural arrangements
constitutes a valuable countervailing proposition vis-à-vis claims that market-
based choices – in the domains of employment and housing, for example –
are abundant to the point where virtually anyone can extricate themselves
from life-diminishing material conditions. Of course, the tightness of
employment markets is frequently such that choice is asymmetrical:
employers have an abundance of prospective employees to choose from,
whereas job applicants (especially those who are unemployed or
underemployed) must take whatever they can get.
  Consider in this regard that in 2019, the year before COVID-19 struck
Canada, the unemployment-to-job vacancies ratio was about 3.3:1 in a typical
month; the standard situation was 1.2 million unemployed people and
360,000 job vacancies (Statistics Canada, 2019). Ratios of similar magnitudes
are found in other advanced countries, and writing about the United States
William K. Tabb provides a striking illustration of how resultant forms of
desperation are expressed, even by those who are employed:

  The poor, who have few choices, may sell the very life space they occupy for
  short-term reward… As one worker in a chemical plant told a reporter who asked

                  Studies in Social Justice, Volume 16, Issue 1, 123-142, 2022
130 Joseph Mensah & Christopher J. Williams if he minded working without protective equipment, ‘Hell, I’d jump in the damn vat if they told me I had to, to keep my job.’ (Tabb, 2002, p. 50) Figuratively speaking, there are thousands of Canadian workers, many of whom are racialized, who are jumping into the vat (i.e., going to work multiple days a week) for fear of job termination if they remain home during the pandemic. This paper sheds light on some of the structural constraints many Black people in Canada face as they live precariously amidst the COVID-19 pandemic. We could not agree more with Massey and Denton’s (1993, p. 149) observation that: The structural organization of society… plays a profound role in shaping the life chances of individuals. Structural variables are elements of social and economic organization that lie beyond individual control, that are built into the way society is organized. Structural characteristics affect the fate of large numbers of people and families who share common locations in the social order. Invariably, in social orders that are also racial orders, racism functions in ways that generate and reinforce the relegation of racial “Others” to lower levels of class structures than they would otherwise occupy. Racialized class structures, as constitutive aspects of material life in White settler nations, are sustained through a variety of processes that are often identifiable as being rooted in the collective agency of superordinate groups. Writing about “strategies of action” in socio-political fields of race, Emirbayer and Desmond (2015, p. 152) draw attention to “a conservation strategy on the part of dominant racial actors, in which their overriding aim is to preserve the structure of power most favourable to them and to safeguard or even enhance their position in this structure.” Resonant with the Weberian concept of social closure, conservation strategies exist in contexts marked by salient ingroup/outgroup racial divisions, but do not require outright hostility as a motive force (Jardina, 2019). In-group affinities, combined with control over key levers of institutional power, can and do suffice to drive successful conservation strategies. Every so often, dominative collective agency finds tripartite expression at the levels of materiality, spatiality and ideology. For example, it has been noted, with reference to concentrated poverty, that: The concentration effect exacerbates the products of a racially exclusionary poverty by concentrating them in a containable space easily avoidable by those not so confined. Conservative commentators largely emphasize the pathological character of the racialized poor as the overriding causal consideration in extending their poverty. So, the concentration effect is not just spatial; it is also ideological. (Goldberg, 1997, p. 15) Zones of concentrated poverty are usually spaces in which life chances are markedly sub-optimal, the political power of confined groups – such as Black people – is rather anemic, and exposure to pernicious conditions, inclusive of Studies in Social Justice, Volume 16, Issue 1, 123-142, 2022
Socio-structural Injustice, Racism, and the COVID-19 Pandemic 131

readily transmissible diseases, is a feature of quotidian life. “Who lives and
dies, how long they live, what diseases they are subject to suffer without
adequate healthcare… are all shaped by the egregious fiscal realities in racist
societies,” observes Leonard Harris (1999, p. 43).
   Congruently, roughly five decades ago, Johan Galtung noted that low
income, low health and low power “tend to be heavily correlated due to the
way they are tied together in the social structure” (2009, p. 83). When
propositions along these lines are advanced in conjunction with
considerations of imbrications between class and race, a standard rejoinder
pivots on two interrelated anti-reductionist injunctions, namely, do not reduce
race to class and do not reduce class to race. That stance is a reasonable one
insofar as “race-thinking isn’t class-thinking, essentially, because the two
categories can get out of phase with each other: a race may be divided into
many classes; a class may be divided into many races” (Taylor, 2004, p. 61).
But even when, for example, this or that racial group is divided into multiple
classes, the class composition of one group can significantly differ from that
of another group.
   Specifically, if we turn again to the 2016 Canadian census data on income
deciles (Statistics Canada, 2018), and take the temporary liberty of
conceiving of these deciles as proxies for class, we find that the class
structure of Black Canadians is very bottom heavy compared to that of
Canadians designated as “not a visible minority.” Focusing on extremes – the
bottom decile and the top decile – enables this point to be illustrated in the
form of a bottom-to-top decile ratio. In 2016, a total of 202,795 Black people
were in the bottom decile whereas 44,970 were in the top decile, so the
bottom-to-top ratio was 4.5:1. This is what it means to say the Black class
structure is bottom heavy: for every Black person in the top decile, there were
4.5 in the bottom decile. By sharp contrast, among the “not a visible
minority” population, 2,280,695 were in the bottom decile and 2,921,775
were in the top decile. The resulting bottom-to-top ratio was 0.78:1, meaning
the class structure of this comparator group is far more equilibrated than that
of Black Canadians.
   With these statistics, the probable health consequences for Black Canadians
can be inferred on the basis of two additional sources of data. First, the Public
Health Agency of Canada’s Health Inequalities Data Tool shows that, with
respect to deaths by all causes by income quintile during the years 2009-
2011, the rate per 100,000 for the highest quintile was 601, while the rate for
the bottom quintile was 50% higher at 902 (Public Health Agency of Canada,
2017). Second, a Statistics Canada study of 2.7 million Canadians aged 25
and older who died from 1991 to 2006 revealed major differences in death
rates, by income quintile, due to communicable diseases. In terms of
respiratory infections, for example, the mortality rate for females in the
lowest quintile, which stood at 26.6 per 100,000, was 39% higher than that of
their counterparts in the highest quintile (19.1 per 100,000). For males, the
death rate disparity was even greater: the rate for males in the lowest quintile

                  Studies in Social Justice, Volume 16, Issue 1, 123-142, 2022
132 Joseph Mensah & Christopher J. Williams
(47 per 100,000) was 61% higher than the rate for males in the highest
quintile (29.2 per 100,000) (Tjepkema et al., 2013, pp. 17-18). Given the
relative concentration of Black Canadians in the lowest income quintiles,
these general and specific (respiratory infection) mortality rates accord with
our understanding of race-specific COVID-19 infection and death rates, as
our subsequent empirical analysis will show.
Race and COVID-19 in Canada
From the preceding discussion, we know that Black people in particular, and
racialized groups in general, are over-represented in occupations that have
frontline status during the COVID-19 pandemic. While the federal
government does not collect race-based data on COVID-19, the City of
Toronto has started publishing ethno-racially-disaggregated data on COVID-
19. However, the ethno-racial categories used by the City are different from
the ones used for “visible minorities” in the national census. For instance,
whereas “Japanese” and “Koreans,” are stand-alone groupings in the census,
Toronto’s database lumps these groups into one (i.e., “Southeast Asians”). At
the same time, the category “Black” is featured in both the census and the
Toronto COVID-19 database, and this augurs well for our empirical
purposes. In this section, we rely mainly on the COVID-19 data compiled by
the City of Toronto to examine how the pandemic has affected Black people,
relative to other ethno-racial groups in the city; we also shed light on the
uptake of COVID-19 vaccines in Black neighborhoods, using the preliminary
data available.
Group Population Share of Share of Count of Odds
Population COVID-19 COVID-19 Ratio
(%) Cases (%) Cases
Arab, Mid. 96,350 3.73 9.97 725 2.65
Eastern or West
Asian
Black 239,850 9.28 24.00 1,763 2.59
East Asian 354,515 13.72 3.77 277 0.27
Latin American 77,165 2.99 8.47 622 2.84
S. Asian or Indo- 338,970 13.12 18.83 1,383 1.44
Caribbean
Southeast Asian 194,360 7.52 13.40 984 1.78
White 1,282,745 49.64 21.66 1,591 0.44
Total 2,583,955 100.00 100.00 7,345 1.00
Table 3. The City of Toronto: COVID-19 cases by ethno-racial groups as of
September 30, 2020 (Note: Odds Ratio = Share of COVID cases divided by
share of population) (Source: City of Toronto, 2020).
As can be seen from Table 3, whereas Black people constituted 9.28% of
the City of Toronto’s population as of September 30, 2020, they accounted
Studies in Social Justice, Volume 16, Issue 1, 123-142, 2022Socio-structural Injustice, Racism, and the COVID-19 Pandemic 133
for almost a quarter (24%) of COVID-19 cases; this is more than double what
one would expect, based on the share of Black people among the city’s
population. Contrast this with the case of Whites in Toronto, who constituted
49.64% percent of the population, but only 21.66% of COVID-19 cases. In
fact, the COVID-19 cases among “Arabs, Middle Eastern or West Asians”
and “Latin Americans” were even higher than among Black people.
Furthermore, Black neighborhoods in the city have more COVID-19 cases,
an unsurprising fact since people’s exposure to COVID-19 at work
contributes to inordinate transmission risks in their neighborhoods and vice
versa.
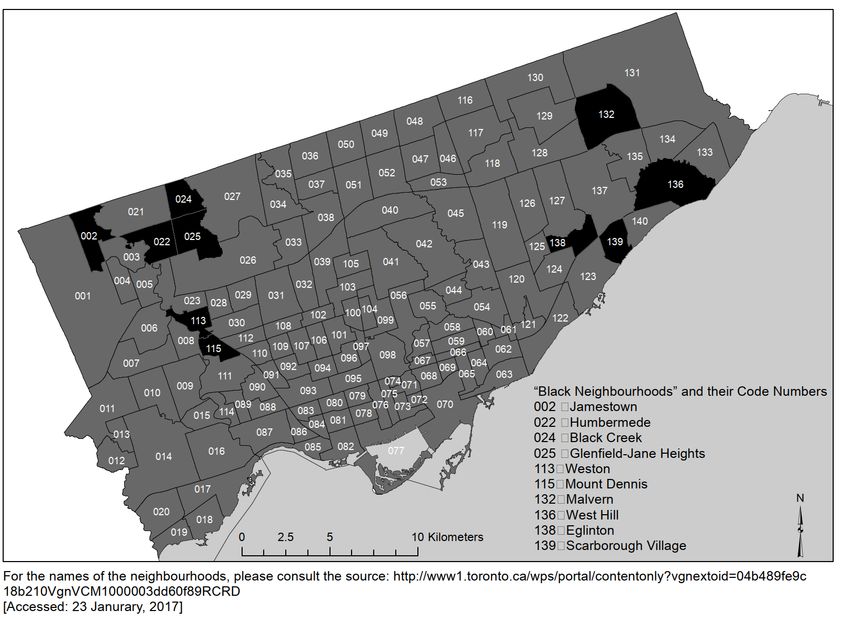
Figure 1. Black neighbourhoods in the City of Toronto.
Mensah and William (2017, p. 57) defined Toronto’s “Black
neighborhoods” as those among the city’s 140 neighborhoods in which 16%
or more of the population is Black, keeping in mind that Black people
constituted 8% of Toronto’s population at the time of their estimate; the 10
Black neighborhoods, per Mensah and Williams’ (2017) estimate, are
presented in Figure 1. As Table 4 shows, Toronto’s Black neighborhoods are
heavily populated by racialized groups, with neighborhoods such as
Jamestown, Black Creek, and Malvern having over 80% of their respective
residents being racialized. Unsurprisingly, these neighborhoods have higher
rates of unemployment and higher rates of residents with low income than the
city’s averages. Figure 2 shows that Toronto’s Black neighborhoods also
have more COVID-19 cases than average neighbourhoods in the city. The
Studies in Social Justice, Volume 16, Issue 1, 123-142, 2022134 Joseph Mensah & Christopher J. Williams
mean infection rate for the 140 neighborhoods of the city stood at 1,076 cases
per 100,000 by November 2020; and ranged from a low of 274 per 100,000 in
the “the Beaches” (a neighbourhood with a miniscule Black population) to a
high of 3,313 per 100,000 in the Black neighbourhood of Weston. The
standard deviation was 667, pointing to high variability from neighborhood to
neighborhood. In fact, all but one Black neighbourhood (West Hill) had well-
above-average COVID-19 caseloads, as of November 8, 2020 (Figure 2).
Priority (Sub)- Total Black % Visible Unemploy- Median % in
Neigbourhoods1 Pop.2 Pop.3 Minority4 ment Household Low
Rate (%)6 Income7 Income8
Mount Olive- 32,954 8,395 86:51 12:8 $55,334: 27:20
Siverstone- (25.5%) $65,829
Jamestown (2)
Jane-Finch
Humbermede 15,545 3,440 77:51 10:8 $57,609: 22:20
(22) (22.1%) $65,829
Black Creek 21,737 6,315 81:51 13:8 $46,580: 33:20
(24) (29.1%) $65,829
Glenfield-Jane 30,491 7,365 77:51 11:8 $51,964: 25:20
Heights (25) (24.1%) $65,829
Weston-St
Dennis
Weston (113) 18,992 6,045 61:51 11:8 $45,695: 30:20
(33.6%) $65,829
Mount Dennis 13,593 4,360 68:51 11:8 $52,162: 25:20
(115) (32.1%) $65,829
Malvern (132) 43,794 8,295 89:51 11:8 $64,114: 20:20
(18.9%) $65,829
Eglinton E. (138) 22,776 3,320 78:51 11:8 $53,081: 26:20
(18.1%) $65,829
Scarborough 16,724 2,855 73:51 13:8 $49,568: 32:20
Village (139) (19.8%) $65,829
West Hill (136) 27,392 5,840 63:51 12:8 $56,051: 25:20
(21.3%) $65,829
1
The City of Toronto has 13 priority neighbourhoods, many of which are made up of sub-areas or
sub-neighbourhoods. The numbers in parenthesis are used by the City of Toronto Planning
Office to identify the city neighbourhood.
2
Refers to the total population of the (sub)-neighbourhood.
3
The population of Black in the (sub)-neighbourhood; the percentage of Blacks in the (sub)-
neighborhood is in parenthesis.
4
This is the ratio of the percentage share of visible minorities in the (sub)-neighbourhood to the
corresponding figure in the City of Toronto as whole.
5
The ratio of percentage share of single parent families in the neighborhood to that of the City.
6
The ratio of the unemployment rate of the (sub)-neighbourhood to that of the city.
7
The ratio of the median income in the (sub)-neighbourhood to that of the city.
8
Is the ratio of low income population in the (sub)-neighbourhood relative to the city.
Table 4. Socioeconomic characteristics of Toronto’s Black neighbourhoods,
2016 (Source: City of Toronto, 2021a).
Studies in Social Justice, Volume 16, Issue 1, 123-142, 2022Socio-structural Injustice, Racism, and the COVID-19 Pandemic 135
Figure 2. Rates of COVID-19 in Black neighbourhoods in Toronto,
November 8, 2020.
Table 5 shows the housing characteristics of the 10 Black neighborhoods in
Toronto in 2016, as we have operationalized them. This dataset is particularly
relevant given the spatial dimensions of COVID-19, which at the very least
catalyzes the need for physical distancing as a mitigating strategy. According
to Table 5, all but two of the 10 Black neighborhoods have higher population
densities than the Toronto average of 4,334 persons per square km; the
corresponding average for the 10 Black neighborhoods stood at 5,687. In fact,
Black neighborhoods such as Weston and Eglinton have population densities
that exceed 7,000 persons per square km. Of course, the issue here is not
merely one of density, for expensive condominiums in other parts of the city
are equally dense; however, the residents of these Black neighborhoods
generally have low-incomes and therefore much less control over their lives
and employment options and conditions. Table 5 also shows that the average
household size in the Black neighborhoods is larger than the city’s average by
a ratio of 2.88:2.42, just as the percentage of unsuitable housing (i.e.,
overcrowded housing) is far greater than the city’s average by a ratio of about
Studies in Social Justice, Volume 16, Issue 1, 123-142, 2022136 Joseph Mensah & Christopher J. Williams 22:12. Similarly, the percentage of inadequate houses (i.e., houses in need of major repair) is, on average, higher in the Black neighborhoods. Priority (Sub)- Population Household Unsuitable Inadequate Neigbourhoods1 Density Size Housing2 Housing3 Mount Olive-Siverstone- Jamestown (2) 7,271 3.32 30.9 10.1 Jane-Finch Humbermede (22) 3,565 3.07 22.9 8.0 Black Creek(24) 6,282 2.95 26.6 13.6 Glenfield-Jane Heights (25) 5,864 3.05 23.1 10.8 Weston-St Dennis Weston (113) 7,197 2.33 19.3 9.7 Mount St. Dennis (115) 6,442 2.56 20.1 11.1 Malvern (132) 4,948 3.26 17.3 6.7 West Hill (136) 2,856 2.70 12.2 11.6 Eglinton (138) 7,051 2.81 22.8 11.1 Scarborough Village (139) 5,395 2.77 22.3 12.8 Black Neighbourhood: 5,687 2.88 21.75 10.55 Mean City of Toronto: Mean 4,334 2.42 12.1 7.1 1 The numbers in parenthesis are used by the City of Toronto Planning Office to identify the city neighbourhoods. 2 Unsuitable housing is the percentage of private households in dwellings with insufficient bedrooms according to their size and composition. 3 Inadequate housing is the percentage of private households in dwellings that are in need of major repairs. Table 5. Toronto’s Black neighbourhoods: Housing characteristics, 2016 (Source: City of Toronto, 2021a). Unlike Toronto, the other two major gateway cities of Montreal and Vancouver do not filter their COVID-19 data by race and ethnicity. Consequently, the ethno-racial dimensions of the pandemic in those cities are hard to ascertain with any appreciable degree of accuracy. Nonetheless, a CBC report on Montreal found that: Montreal districts with higher number of Black people and more cramped housing have registered the most cases of COVID-19… the findings confirm what many already suspected, given the high death toll in low-income, racially diverse neighbourhoods like Montréal-Nord, where 222 people have died from the virus – more than in all of British Columbia. (Rocha et al., 2020, p. 2) Due to the lack of relevant data, the report used “place of residence” as a proxy for “ethno-racial background”; while this is not perfect, it is a reasonable approximation. Also, with the aid of regression analysis, the CBC analysts found their strongest correlation between “the rate of infection” and the “percentage of Black residents.” They also “found strong correlations for concentrations of health-care workers, low income earners, and unsuitable housing” (Rocha et al., 2020, pp. 2-5), all of which chimes well with our Studies in Social Justice, Volume 16, Issue 1, 123-142, 2022
Socio-structural Injustice, Racism, and the COVID-19 Pandemic 137

preceding assessment of the situation in Toronto. Even in Vancouver –
where sizeable Black enclaves, comparable to those in Toronto and Montreal,
are virtually non-existent – there is some evidence that the pandemic is
having its worst impacts in neighbourhoods with high proportions of
racialized groups, such as South Asians, Filipinos and Blacks. A CBC report
on British Columbia notes that “communities in B.C. that were home to more
than 25 per cent visible minorities had an age-adjusted COVID-19 mortality
rate that was 10 times higher than neighbourhoods that were less than one per
cent visible minority” (Carman, 2020, p. 2). While this finding is about all of
British Columbia, the fact that the bulk of the province’s visible minority
population lives in the Vancouver Metropolitan Area, especially in such
places as Surrey and Richmond, makes it relevant to our assessment of the
situation in Canada’s three major cities.
   Overall, in Toronto, where COVID-19 data are filtered by race, we found
that Black people and other racialized groups are at more risk than their
White counterparts. Similar trends are noticeable in both Montreal and
Vancouver, albeit to a lesser degree, even though the data in these two cities
are not disaggregated enough to give a clear picture. Moreover, while the
available COVID-19 data in Toronto, Montreal and Vancouver are not
filtered per immigration status, one can reasonably speculate that the
COVID-19 situation among Black people and other racialized immigrants is
likely the same, if not worse.
   By early June of 2021, the Canadian vaccination program was well
underway; Ontario, for one, was in Step 2 of its 3-tier criterion for opening up
the province. Step 2 is where 70% of the adult population has received at
least one dose of the vaccine, and 20% are fully vaccinated, while Step 3 is
where 70 to 80% of the adults have received one dose and 25% of the adults
are fully vaccinated. At the time of doing the final editorial corrections to this
paper in January 2022, the Ontario government had announced new
restrictions in response to the spread of the Omicron variant, “saying the
province will return to a modified Step 2 of the reopening plan” (Katawazi,
2022). With its vaccine rollout well underway, Toronto Public Health (TPH)
acknowledged on its website that systemic racism is implicated in the
differential impact of the pandemic on racialized populations; TPH’s
admission is worth quoting at length here:

  Racialized and immigrant communities are more likely to work in low-wage,
  front-line and essential work, and many neighborhoods with high rates of
  COVID-19 have a high percentage of people at higher risk. Systemic racism and
  discrimination are important drivers of these inequalities. The COVID-19
  pandemic has also had important negative socio-economic impacts and has led to
  deeper inequalities, challenges and barriers. (City of Toronto, 2021b; emphasis
  added)

With this explicit acknowledgement, TPH is trying hard to make vaccines
accessible to people in poor, racialized neighborhoods. As they put it:

                  Studies in Social Justice, Volume 16, Issue 1, 123-142, 2022
138 Joseph Mensah & Christopher J. Williams The City of Toronto Public Health, health care and community partners are working together to expand access to COVID-19 vaccination for neighborhoods and populations that have been most impacted by COVID-19, including Black, Indigenous, racialized, disability and newcomer communities. This includes providing mobile vaccination clinics in local neighborhoods, and vaccine-related communications, outreach and support that reflects the languages and cultures of local residents. (City of Toronto, 2021b) With the preceding two quotations in context, one would have expected the vaccination rates in Toronto’s Black neighborhoods to be at least close to, if not on par with, the Toronto average by the end of June 2021. However, the situation on the ground was quite different: whereas the vaccination rate for the overall Toronto population (18+ years) stood at 45.3% by June 30, 2021, the corresponding average for the 10 Black neighborhoods was 36.9%, with rates for Black neighborhoods such Jamestown (30.1%), Mount Dennis (31.7%), Humbermede (35%), Weston 35.4%, and West Hill (35.5%) falling some 10 percentage points below the City’s average (City of Toronto, 2021b). While it is hard to account for this race-linked spatial variation, there is little doubt that some level of vaccine hesitancy is implicated. Discussion: Racism, Biopolitics, and Social Justice Amidst COVID-19 The government of Canada has intervened quite generously in the economy since the pandemic started, with some workers even placed on government- funded furlough and others getting unemployment benefits. Still, there is no denying that the pandemic has reinforced the inequities in the Canadian labour market, as it has across many parts of the world. With the pandemic, labour has come under a tripartite typology, entailing those functions that are “essential,” those that have been “lost,” and those that have transitioned to online formats (Rose, 2020). While some Black workers and other racialized workers have lost their jobs, many are still working in frontline jobs such as in warehouses, farms, and long-term health care facilities where the threat of COVID-19 is particularly high. We also know from the preceding analysis that Black people, in particular, are overrepresented among those living in low-income and overcrowded neighborhoods, with higher unemployment rates. The present study has shown that these subpar material conditions have disproportionately exposed Black people to the pandemic, and these findings corroborate those of recent studies by Subedi et al. (2020, p. 4) and Choi et al. (2020). These results stimulate important questions related to social justice. For instance, are we prepared to pay essential workers “essential” wages that are commensurate with the existential risks of their work? Given that some of these frontline workers are undocumented immigrants and temporary labourers, such as Jamaican farm workers in Ontario, are we prepared to Studies in Social Justice, Volume 16, Issue 1, 123-142, 2022
Socio-structural Injustice, Racism, and the COVID-19 Pandemic 139

regularize their stay or simply overlook the risks they are taking to make life
easier for Canadians? As George (2020) puts it:

  Will Canada give its foreign essential workers their rights? What freedoms do
  these racialized essential workers actually have amidst COVID-19, since many
  can hardly afford to lose their paycheck? More importantly, how can we best
  protect these vulnerable workers from the real and present dangers of the
  pandemic?

  Undoubtedly, the pandemic has, in the context of pre-existing structural
inequities, created differentiated health risks to the detriment of Black people
and other disadvantaged groups in Canada; the racial, biopolitical, and social
justice ramifications of life under COVID are quite palpable. And although
the virus itself does not discriminate, Judith Butler (2020, p. 5) justifiably
notes:

  Social and economic inequality will make sure that the virus discriminates [and
  creates] a distinction between grievable and ungrieveable lives, that is, those who
  should be protected against death at all cost and those whose lives are considered
  not worth safeguarding against illness and death.

Foucault (1997, 2004), in his lectures on biopolitics, discusses how racism is
deployed in the calculi of biopower to divide people into those who must live
and those who must die. Similarly, Mbembe (2019) uses his notion of
Necropolitics to highlight the extent to which Western democracies have
embraced their “dark side,” with ever-increasing racism, inequality, and
nationalistic forces, thereby hollowing out the values, rights and freedoms
they routinely celebrate. For his part, Agamben (1998), in his Homo Sacer,
describes the life of disadvantaged, racialized, and marginalized people as
“bare life” (i.e., a purely biological or animal life, stripped of any social and
political dimensions). The issue then is: what socio-political processes can
change their lives from “bare life” status to that of rights-bearing subjects
amidst the pandemic? We offer two specific suggestions in this regard. First,
guided by Rawls’ (1971) difference principle, we urge authorities to
distribute COVID-19-related resources, including the vaccine, in ways that
favour the most vulnerable among us, which obviously includes frontline
workers. Secondly, with insights from Sen’s (2009) notion of justice as
freedom of opportunity and of process, we urge authorities to accord frontline
workers the freedom to choose what they may value – or consider safe –
doing or not doing in the midst of the pandemic. As Sen (2009, p. 227)
observes: “in assessing our lives, we have reason to be interested not only in
the kind of lives we manage to lead, but also in the freedom that we actually
have to choose between styles and ways of living.” Indeed, the freedom to
determine the nature of our lives is one of the valued aspects of living that we
have reason to treasure. Accordingly, these workers should be given humane
and realistic options to work under conditions that are as safe as possible;

                   Studies in Social Justice, Volume 16, Issue 1, 123-142, 2022
140 Joseph Mensah & Christopher J. Williams conceivable options and incentives could include reduced hours, higher pay to reflect their exposure to COVID-19 risks, and reasonably paid sick or stress leave. Conclusion The Economist notes in a recent report that “the coronavirus affects everyone, but not equally. The young often shrug off the virus; the old often die of it. The rich shrug off the economic shock; the poor cannot” (September 26, 2020, p. 16). From the preceding analysis, we can convincingly add a racial component to this observation to the effect that Black people and other racialized groups are more likely to die of it. Clearly, consequential antipodal realities are germane to the subject matter here. Our findings suggest that, at least at the general level, the dominant material arrangements of Canada enable the accrual of substantial life-enhancing advantages to Whites, and the externalization of the worst social conditions onto Black people and other racialized populations. Insofar as the worth of whiteness is tied to certain empirical correlates of material advantage (e.g., lower unemployment rates or higher incomes) it is understandable, from the standpoint of amoral logic, why non-disruption of the Canadian racial status quo may be viewed as a good thing in some ideological circles. On the other hand, in the context of the COVID-19 pandemic, racist hermetic fantasies run up against the fact that, at the time of finalizing the corrections to this paper (January 20, 2022), the virus has killed 31,982 people in Canada and there is no way to fully shield Whites from its fatal effects. Although our findings point to racially disproportionate impacts of COVID-19, disproportionate by no means implies exclusive, and, as a result, there is a strong case to be made for our collective concern or genuine care about how the virus has disproportionately affected racialized communities. We could not agree more with Mbembe’s (2019) conception of care, which enjoins us to see the Other not as people to exclude or abhor, but as people with whom we can build a more just and humane world. Acknowledgements From Chris: Thank you to Dr. Joseph Mensah for generously extending me the opportunity to contribute to this article, and to the members of the Studies in Social Justice editorial team for all the work they have done to bring our work to print – much appreciated. From Joseph: This article is dedicated to the cherished memory of my Dad, the late Mr. M. Y. Mensah, who passed in September of 2021. Studies in Social Justice, Volume 16, Issue 1, 123-142, 2022
Socio-structural Injustice, Racism, and the COVID-19 Pandemic 141

References

Agamben, G. (1998). Homo sacer: Sovereign power and bare life (D. Heller-Roazen, Trans.).
      Stanford University Press.
Booth, R., & Barr, C. (2020, May 20). Black people four times more likely to die from Covid-19,
      ONS finds. The Guardian (online).
      https://www.theguardian.com/world/2020/may/07/black-people-four-times-more-likely-to-
      die-from-covid-19-ons-finds
Block, S., & Galabuzi, G-E. (2011). Canada’s colour-coded labour market: The gap for
      racialized workers. Wellesley Institute.
      https://www.policyalternatives.ca/sites/default/files/uploads/publications/National%20Offic
      e/2011/03/Colour%20Coded%20Labour%20Market.pdf
Butler, J. (2020). Capitalism has its limits [Blog]. Verso Books
      https://www.versobooks.com/blogs/4603-capitalism-has-its-limits
Carman, T. (2020, November 17). COVID-19 mortality rate higher in neighbourhoods with more
      visible minorities: StatsCan. CBC online. https://www.cbc.ca/news/canada/british-
      columbia/covid19-minorities-health-bc-canada-1.5801777
Choi, K., Zajacova A., Haan, M., & Denice, P. (2020, May 20). Data linking race and health
      predicts new COVID-19 hotspots. The Conversation. https://theconversation.com/data-
      linking-race-and-health-predicts-new-covid-19-hotspots-138579
City of Toronto. (2020). COVID-19: status of cases in Toronto. The City of Toronto COVID-19
      online https://www.toronto.ca/home/covid-19/covid-19-latest-city-of-toronto-news/covid-
      19-status-of-cases-in-toronto/
City of Toronto. (2021a). Neighbourhood profiles – 2016. https://www.toronto.ca/city-
      government/data-research-maps/neighbourhoods-communities/neighbourhood-profiles
City of Toronto. (2021b). Vaccinations in Toronto. https://www.toronto.ca/home/covid-
      19/covid-19-latest-city-of-toronto-news/covid-19-pandemic-data/covid-19-vaccine-data/
Cockerham, W. C. (2013). Social causes of health and disease. Polity Press.
Emirbayer, M., & Desmond, M. (2015). The racial order. University of Chicago Press.
Employment Equity Act (S.C. 1995, c. 44)
Foucault, M. (1997). Society must be defended: Lectures at the College de France, 1975-1976.
      Picador.
Foucault, M. (2004). The birth of biopolitics: Lectures at the College de France, 1978-1979.
      Picador.
Galabuzi, G. E. (2006). Canada’s economic apartheid: the social exclusion of racialized groups
      in the new century. Canadian Scholars’ Press.
Galtung, J. (1969/2009). Violence, peace and peace research. In V. Bufacchi (Ed.), Violence: A
      philosophical introduction (pp. 78-109). Palgrave Macmillan.
George, U. (2020, October 27). Will Canada give its foreign essential workers their rights? Open
      Democracy online. https://www.opendemocracy.net/en/pandemic-border/will-canada-give-
      its-foreign-essential-workers-their-rights/
Goldberg, D. T. (1997). Racial subjects: Writing on race in America. Routledge.
Guinier, L., & Torres, G. (2003). The miner's canary: Enlisting race, resisting power,
      transforming democracy. Harvard University Press.
Hackworth, J. (2016). Why there is no Detroit in Canada. Urban Canada, 37(2), 272-295.
Harris, L. (1999). What, then, is racism? In L. Harris (Ed.), Racism (pp. 437-450). Humanity
      Books.
Jardina, A. (2019). White identity politics. Cambridge University Press.
Kant, I. (1785/1998). Groundwork of the metaphysics of morals (M. Gregor, Ed. & Trans.)
      Cambridge University Press.
Katawazi, M. (2022). Full list of Ontario COVID-19 restrictions for starting Jan. 5. CTV News.
      Retrieved January 20, 2022 from https://toronto.ctvnews.ca/full-list-of-ontario-covid-19-
      restrictions-for-starting-jan-5-1.5726245
Massey, D. S., & Denton, N. A. (1993). American apartheid: Segregation and the making of the
      underclass. Harvard University Press.
Mbembe, A. (2019). Necropolitics. Duke University Press.

                      Studies in Social Justice, Volume 16, Issue 1, 123-142, 2022
142 Joseph Mensah & Christopher J. Williams
Mensah, J. (2020). Home sweet home: Understanding the geographies of return migration
intentions among Black continental African immigrants in Canada. Canadian Ethnic
Studies, 52(3), 107-127.
Mensah, J. (2010). Black Canadians: History, experiences, social conditions. Fernwood
Publishing.
Mensah, J., & Williams, J. C. (2017). Boomerang ethics: How racism affects us all. Fernwood
Publishing.
Public Health Agency of Canada. (2017). Pan-Canadian health inequalities data tool, 2017
Edition. Public Health Agency of Canada, the Pan-Canadian Public Health Network,
Statistics Canada & the Canadian Institute of Health Information. https://health-
infobase.canada.ca/health-inequalities/data-tool/index
Rawls, J. (1971). A theory of justice. Harvard University Press.
Rocha, R., Shingler, B., & Montpetit, J. (2020, June 11). Montreal’s poorest and most racially
diverse neighbourhoods hit hardest by COVID-19, data analysis shows. CBC online.
https://www.cbc.ca/news/canada/montreal/race-covid-19-montreal-data-census-1.5607123
Rose, J. (2020). Biopolitics, essential labor, and the political-economic crisis of COVID-19.
Leisure Sciences: An interdisciplinary Journal, 43(1-2), 211-217.
Sen. A. (1999). Development as freedom. Oxford University Press.
Sen, A. (2009). The idea of justice. Harvard University Press.
Stafford, K., Hoyere, M., & Morrison, A. (2020, April 6). Coronavirus is killing Black
Americans at a much higher rate. Global News online.
https://globalnews.ca/news/6799322/coronavirus-black-americans/
Statistics Canada. (2016). Visible minority and population group reference guide, census of
population. https://www12.statcan.gc.ca/census-recensement/2016/ref/guides/006/98-500-
x2016006-eng.cfm
Statistics Canada. (2017, October 25). Aboriginal population in Canada: Key results from the
2016 census. https://www150.statcan.gc.ca/n1/daily-quotidien/171025/dq171025a-
eng.htm?indid=14430-1&indgeo=0
Statistics Canada. (2018). Visible Minority (15), Economic Family Income Decile Group (13),
Generation Status (4), Age (12) and Sex (3) for the Population in Private Households of
Canada, Provinces and Territories, Census Metropolitan Areas and Census
Agglomerations, 2016 Census - 25% Sample Data.
https://www150.statcan.gc.ca/n1/en/catalogue/98-400-X2016212
Statistics Canada. (2019, November 28). Table 14-10-0226-01. Job vacancies, unemployed and
unemployment to-job vacancies ratio, three-month moving average, unadjusted for
seasonality, inactive. https://www150.statcan.gc.ca/t1/tbl1/en/tv.action?pid=1410022601
Subedi, R., Greenberg, L., & Turcotte, M. (2020, October 28). COVID-19 mortality rates in
Canada’s ethno-cultural neighbourhoods. Statistics Canada.
https://www150.statcan.gc.ca/n1/pub/45-28-0001/2020001/article/00079-eng.htm
Tabb, W. (2002). Unequal partners: A primer on globalization. New Press.
Taylor, P. C. (2004). Race: A philosophical introduction. Polity Press.
The Economist. (2020, September 26). COVID-19 and poverty: failing the poor. The Economist.
https://www.economist.com/leaders/2020/09/26/covid-19-has-reversed-years-of-gains-in-
the-war-on-poverty
Thisted, R. A. (2003). Are there social determinants of health and disease? Perspectives in
Biology and Medicine, 46, S65-73.
Thomas, K. J. A. (2012). A demographic profile of Black Caribbean immigrants in the United
States. Migration Policy Institute. https://www.migrationpolicy.org/pubs/CBI-
CaribbeanMigration.pdf
Tjepkema, M., Wilkins, R., & Long, A. (2013, July). Cause-specific mortality by income
adequacy in Canada: A 16-year follow-up study. Statistics Canada.
https://www150.statcan.gc.ca/n1/pub/82-003-x/2013007/article/11852-eng.pdf
Walker, J. W. St. G. (1996). African Canadians. In P. R. Magocsi (Ed.), Encyclopedia of
Canada’s peoples (pp. 139-176). University of Toronto Press.
Winks, R. (1997). The Blacks in Canada: A history. McGill-Queen’s University Press.
Studies in Social Justice, Volume 16, Issue 1, 123-142, 2022You can also read