SOLAREDGE TECHNOLOGIES NASDAQ I SEDG - RONEN FAIER CFO - SOLAREDGE TECHNOLOGIES, INC.

Page created by Benjamin Williamson
 
CONTINUE READING
SOLAREDGE TECHNOLOGIES NASDAQ I SEDG - RONEN FAIER CFO - SOLAREDGE TECHNOLOGIES, INC.
SolarEdge Technologies
Nasdaq I SEDG
Ronen Faier
CFO
August 2021
SOLAREDGE TECHNOLOGIES NASDAQ I SEDG - RONEN FAIER CFO - SOLAREDGE TECHNOLOGIES, INC.
Forward Looking Statements
Use of Forward-Looking Statements
This presentation contains forward-looking statements within the meaning of the Private Securities
Litigation Reform Act of 1995. These forward looking statements include information, among other
things, concerning: our possible or assumed future results of operations; future demands for solar energy
solutions; business strategies; technology developments; financing and investment plans; dividend policy;
competitive position; industry and regulatory environment; general economic conditions; potential
growth opportunities; and the effects of competition.
Forward-looking statements are only predictions based on our current expectations and are inherently
subject to risks and uncertainties. They should not be considered guarantees of future results, which
could differ materially from the results set forth in, contemplated by, or underlying this presentation.
Factors that could cause actual results to differ materially from our expectations are described in the
reports filed by SolarEdge with the Securities and Exchange Commission and we encourage you to review
our filings carefully, especially the sections entitled “Risk Factors” in our annual report Form.
SolarEdge undertakes no duty or obligation to update any forward-looking statements contained in this
presentation as a result of new information, future events or changes in its expectations.

2
SOLAREDGE TECHNOLOGIES NASDAQ I SEDG - RONEN FAIER CFO - SOLAREDGE TECHNOLOGIES, INC.
SolarEdge in Numbers

                  74.1M                                                                       374 370
                                                                                 29
                                                                                                         Awarded
                                                                                              Patents and
                   Power Optimizers                                                           Additional Patent
                   Shipped                                                       Countries    Applications
                                                                                 Presence

>2.15M
Monitored systems
around the world                                                #    1
                                                                     Solar
                                                                     Inverter
                                                                     Company *
                                                                                             3,618
                                                                                             employees

                               3.1M
                               Inverters
                               Shipped
                                                                         25.7GW
                                                                         of our systems
                                                                         shipped worldwide
 * Revenue wise - PV Inverter Market Tracker – Second Quarter 2021
SOLAREDGE TECHNOLOGIES NASDAQ I SEDG - RONEN FAIER CFO - SOLAREDGE TECHNOLOGIES, INC.
Q2/2021 Financial Results

    $480.1M                     $72.5M                 32.5%
           GAAP Revenue         Non-GAAP Net Income    GAAP Gross Margin

     $38.7M                     $45.1M                $509.3M
    Cash Flow From Operations    GAAP Net Income      Cash, Deposits
                                                      and Investments,
                                                      Net of Debt
4
SOLAREDGE TECHNOLOGIES NASDAQ I SEDG - RONEN FAIER CFO - SOLAREDGE TECHNOLOGIES, INC.
Electricity demand is on the rise
      Estimated Electricity Consumption Requirements
      Benjamin Deniston, 2020. Only nations with electricity data in 1990.
                                                                                                                   +2B people (+26%) 2020-50
                 100
                  90
                  80
                  70                                                                                               Urbanization will increase by (+~2.5B
Petawatt-hours

                  60
                                                                                                                   people)
                  50
                  40
                  30                                                                                               Growing trend of electrification
                  20                                                                                               in areas previously dominated
                  10                                                                                               by fossil fuels
                   0
                          1990         2000          2010           2020         2030           2040        2050
                         Northern America        Europe                    Ibero-America          East & SE Asia   Total global primary energy consumption
                         Cen & South Asia        Africa & SW Asia          Sub-Saharan Africa
                                                                                                                   is expected to double in 15 years (2035)
                                                                                                                   and triple by 2050

                  Source: https://www.larouchepac.com/efd_5

                  https://www.un.org/development/desa/en/news/population/2018-world-urbanization-
                  prospects.html
SOLAREDGE TECHNOLOGIES NASDAQ I SEDG - RONEN FAIER CFO - SOLAREDGE TECHNOLOGIES, INC.
Renewable energy supply is outgrowing fossil fuels
Global installed capacity mix, 2019 and 2050, %

40                                                                              38

35

30     28

25                23
                                                                    20                                      In 2019, global installed power
20
                       15                           15                                                      generation capacity was 7,566 GW
15                                                                                                          with solar PV accounting for 11%,
                                                                           11
10          7                                            7      8                          8                Analysts believe by 2050, solar PV is
                              4           5                                                         4       likely to lead all power generation
 5                                            2                                        2                2
                                  1                                                                         capacity that will grow to 20,391 GW
 0
                                                                                                            with a share of 38%
        Coal        Gas        Oil      Nuclear     Hydro       Wind       Solar     Storage        Other

                                                     2019     2050

Source: http://taiyangnews.info/business/wind-pv-to-account-for-56-of-global-power-needs-in-2050/
SOLAREDGE TECHNOLOGIES NASDAQ I SEDG - RONEN FAIER CFO - SOLAREDGE TECHNOLOGIES, INC.
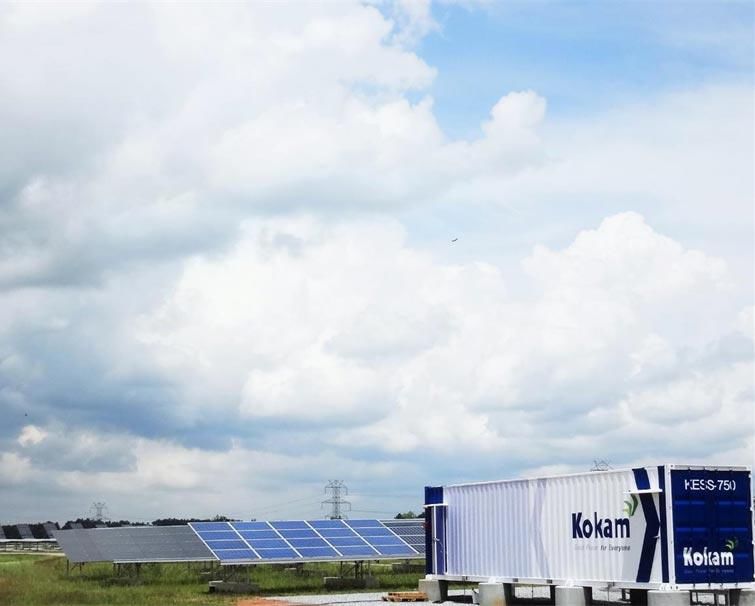
Growth is expected in all regions

         Solar GW(dc) Installations by Region                                                                                     261
                                                                                                                           245
                                                                                                                                   24
                                                                                                            227             22
                                                                                                207          19                    41
                                                                                                 13                         42
                                                                                      172                    43
                                                                                       6         47
                                                                                                                                   63
                                                                          144                                               56
                                                                           3           37                    47
                                                                 125
                                                                           31                    39
                                                                  5
                                                    102                                31
                                    96                            23
                                    1                4                     25
                        78          15               16
                                                                  25
                        2           10               12
           57           18                                                                                                        133
                                                                                                             119           125
            1           8                                                                       109
            11                                                                         97
            9                                                              86
                                    70               70           72
                        51
            36

          2015         2016        2017             2018         2019     2020       2021       2022        2023           2024   2025

                               Asia Pacific Total          Europe Total   Americas Total    Africa and Middle East Total

      Source: IHS PV installation tracked Q2 2021
SOLAREDGE TECHNOLOGIES NASDAQ I SEDG - RONEN FAIER CFO - SOLAREDGE TECHNOLOGIES, INC.
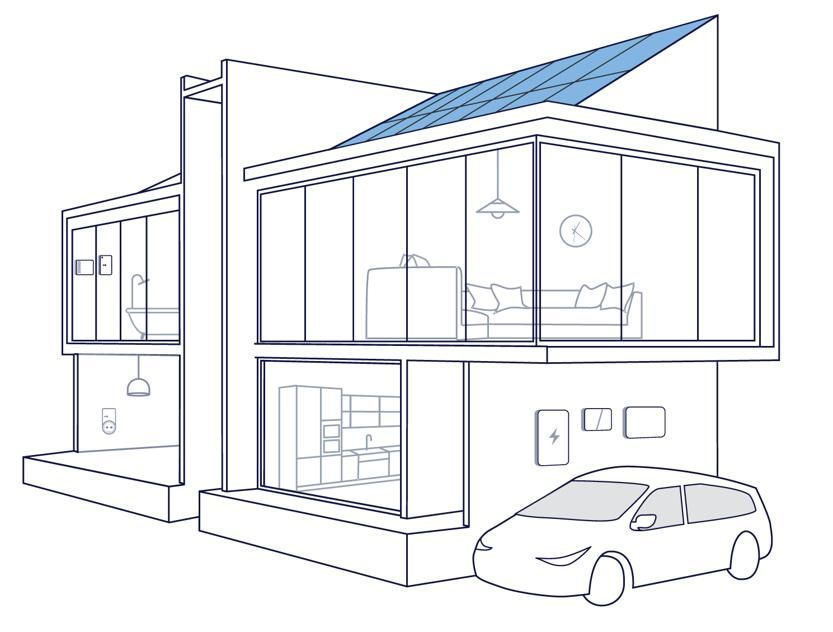
Strategy
Solar    SolarEdge Solutions
SOLAREDGE TECHNOLOGIES NASDAQ I SEDG - RONEN FAIER CFO - SOLAREDGE TECHNOLOGIES, INC.
A Complete Residential Solution
    A single solution for PV, storage, smart energy,   Smart Modules with
                                                       Pre-assembled Power
    and EV charging                                    Optimizers

     Smart Energy Products

                                                                   Inverters

     Monitoring Platform                                StorEdge
9
SOLAREDGE TECHNOLOGIES NASDAQ I SEDG - RONEN FAIER CFO - SOLAREDGE TECHNOLOGIES, INC.
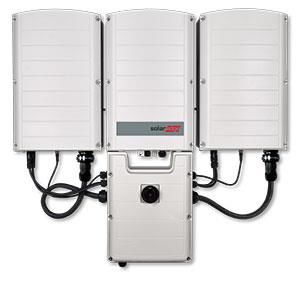
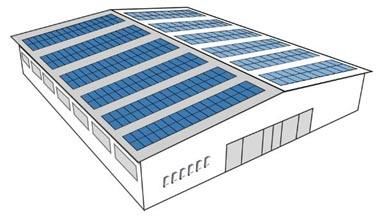
The SolarEdge Commercial Solution

                                                  Monitoring Platform

                                                  Commercial Gateway

                                                        Environmental Sensors
     Power Optimizers                             Environmental Sensors
     2-to-1 configuration with
     P600–P850

                                 Inverters
10                               15kVA – 120kVA   Grid Interaction
Annual Growth

Revenues ($M)                                     Our Winning Method
                                    1,459.3
                          1,425.7                       Strong product offering that
                                                        answers customers needs
                                                        Sales force focused on demand
                                                        creation with installers
                  937.2
                                                        Backed by marketing and service

                                                              US Residential Market
          607.0
                                              80.0%
  490.0                                                                                            58.7%
                                              60.0%                                        50.9%           50.4%
                                                                                  40.2%
                                              40.0%                      33.1%
                                                                27.5%
                                                      15.9%
                                              20.0%

                                               0.0%
                                                       2014     2015     2016     2017     2018    2019    2020
  2016    2017    2018    2019      2020
                                              Source: Wood Mackenzie US PV Leader board Q2 2021
Strategic Growth Engines

 Geographic    Segment       Market         ARPI Increase
 Expansion     Development   Share Growth
Geographic Expansion
 Systems installed in >130 countries with feet on the ground in the large sustainable ones
 Maintain leadership position in core developed markets
 Significantly grow in new markets to answer demand

 Local presence
SolarEdge Segment Development
Leader
                           2019                                           Looking
                                                                          ahead
                                                         Residential                               Residential
                                                                                      Commercial
        Market Position

                                            Commercial

                                                                                    Utility

                                  Utility
Entry

                          Basic             Portfolio                   Basic        Portfolio          Complete
                                                             Complete
Market Share Growth
 Global Inverter Market Tracker: World PV Inverter Supplier Rankings ($ Revenues)

    2014                                           2017                        2020 (Ranked first since 2018)
    Rank Company                                   Rank Company                 Rank Company
       1      SMA                                   1     Huawei                  1      SolarEdge

       2      ABB                                   2     SMA                      2     SMA

       3      Omron                                 3     Sungrow                  3     Huawei

       4      TEMIC                                 4     SolarEdge                4     Enphase Energy

       5      Tabuchi                               5     Enphase Energy           5     Sungrow

       6      Schneider Electric                    6     ABB                      6     Fronius

       7      Enphase Energy                        7     Schneider Electric       7     Power Electronics

       8      Sungrow                               8     Omron                    8     ABB

       9      Huawei                                9     Fronius                  9     Growatt
      10
      10      SolarEdge                             10    Goodwe                  10     Omron

  Source: IHS PV Inverter Market tracker 2015-21
Technology Roadmap
Inverter Gen1     Inverter Gen2                          Single Phase     Three Phase Inverters             StorEdge Three     Three Phase Inverters       Utility Inverter
3kW – 6kW (1ph)   2.2kW – 7.6kW (1ph)                    Inverters        with Synergy Technology           Phase Inverter     with Synergy Technology     330kW
                  5kW – 20kW (3ph)                       with HD-Wave     Up to 100kW                                          Up to 120kW
                                                         Technology
                                                         2.2kW – 11.4kW

                                                                                                                                                                              Efficiency

                                                                                                                                                                              Power
     2010              2011                 2013                 2015              2017                    2019                 2021                                          Rating
                                                                                                                                                                 Future…

                                                                                                                                                                              $/Watt

                                                                                                                                              Optimizer
Optimizer Gen1    Optimizer Gen2        Optimizer Gen3                                                                                         Gen4

                                                                                                             Single Phase      Residential
                                                                                                         Energy Hub Inverter    battery
                                                                                                              with Prism
                                                                                                             Technology
                                                                                                           2.2kW – 11.4kW

                                                                                                                                                          Commercial
                                                                                           ESS Utility
                                                                                                                                                            battery
                                                                                            storage

16
Moving
Beyond PV
One-Stop-Shop for Smart Energy Solutions

Smart Modules                                      Batteries, UPS, and EV Powertrains
                     Residential and
                     Commercial PV Inverters

EV Charging                                    Monitoring Platform and Grid Services

                     Smart Energy Management

 18
19

     Strengths of SolarEdge Critical Power Division
      Decades of experience designing and
      manufacturing UPS solutions for various
      applications
      Competitive product offering for the 3 phase 10
      – 500 KW segment
      Significant synergy with SolarEdge R&D,
      manufacturing and global business
      infrastructure
      Opportunity for combined backup/UPS energy
      storage solution
20

     Strengths of Kokam within SolarEdge
     A global Tier 1 provider of innovative battery solutions
     Battery provider for utility-scale ESS, UPS, EV, and more
     Proven technology with more than 685MWh deployed
         Over 175MWh of utility-scale ESS installed globally

     Access to thousands of installers and EPCs as sales channel
     Innovative cell chemistry technology with long cycle life
     and high power Li-ion battery
     “Sella 2”, a 2GWh Li-ion cell factory under construction
     expected to begin production in early 2022
21

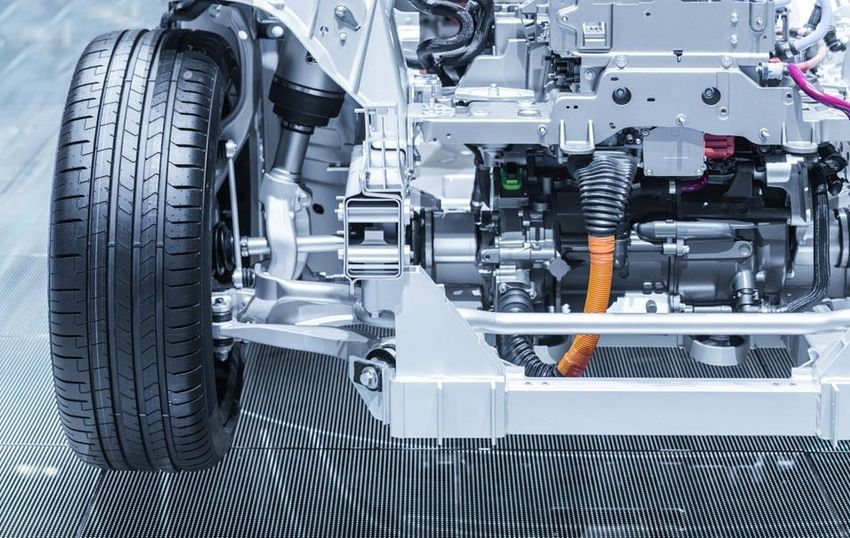
     SolarEdge E-Mobility Division

      Innovative integrated powertrain technology and
      electronics for LCVs, LGVs, e-motorcycles
      Innovative and high-performing powertrains with the
      gearbox, engine, battery, BMS, software, and accessories
      Provides SolarEdge fast-track access to the high-growth
      global EV market
      Selected as supplier of electric powertrain units and
      batteries for Fiat E-Ducato (Stellantis)
Financial
Performance
Revenues Growth

                                   1,459.3
                         1,425.7
                          89.1     102.0                                                     480.1
                                                                                              0.1
                                                                                     405.6   48.5
                                                                                      0.1
                 937.2                                                       358.1   29.1
                                                            331.9   338.1
                 22.9                                                       31.0
                                                            21.8     25.6

         607.0           1,336.6   1,357.3
 490.0                                                                                       431.5
                                                                                     376.4
                 914.3                                                      327.1
                                                            310.1   312.5
         607.0
 490.0

 2016    2017    2018    2019      2020                     Q2-20   Q3-20   Q4-20    Q1-21   Q2-21

                                             USD millions
Consolidated Gross Margin
          35.4%
                  34.1%                                                      34.5%
                          33.6%
  32.8%                                                                              32.5%
                                  31.6%                      32.0%
                                                     31.0%           30.8%

  2016    2017    2018    2019    2020     GAAP      Q2-20   Q3-20   Q4-20   Q1-21   Q2-21

          35.7%
                                          Non-GAAP
                          34.9%                                              36.5%
                  34.6%

  33.1%                                                      33.5%                   33.9%
                                  33.0%
                                                     32.4%           32.5%

  2016    2017    2018    2019    2020               Q2-20   Q3-20   Q4-20   Q1-21   Q2-21
Operating Expenses as % of Revenues

                                  21.8%                              26.8%   23.7%
                                                     22.0%   23.0%
                                                                                     21.0%
          20.4%           20.3%
                  19.2%
  18.3%

  2016    2017    2018    2019    2020     GAAP      Q2-20   Q3-20   Q4-20   Q1-21   Q2-21

                                          Non-GAAP
                                                                     20.4%
          17.9%                   18.1%
                                                     18.4%   18.7%           18.8%

  16.2%           16.0%                                                              17.0%
                          15.5%

  2016    2017    2018    2019    2020               Q2-20   Q3-20   Q4-20   Q1-21   Q2-21
Consolidated Operating Profitability
                                                                                          55.6
                          189.9                                                   44.1
                  139.4           142.6
                                                          30.0    30.4
          91.1
   71.0                                                                   14.4

   2016   2017    2018    2019    2020     GAAP           Q2-20   Q3-20   Q4-20   Q1-21   Q2-21

                          276.8
                                          Non-GAAP
                                  218.8                                                   81.3
                                                                                  71.9
                  174.3
                                                          46.6    50.0    43.5
          108.7
   82.6

   2016   2017    2018    2019    2020                    Q2-20   Q3-20   Q4-20   Q1-21   Q2-21

                                           USD millions
Consolidated Net Profitability

                          146.5   140.3                            43.8                    45.1
                  128.8                                    36.7
                                                                                  30.1
          84.2
   63.5                                                                   17.7

   2016   2017    2018    2019    2020     GAAP           Q2-20   Q3-20   Q4-20   Q1-21   Q2-21

                                          Non-GAAP
                          233.2   224.4                           65.9                    72.5
                                                          52.1            55.7    55.5
                  157.3
          115.0
   78.9

   2016   2017    2018    2019    2020                    Q2-20   Q3-20   Q4-20   Q1-21   Q2-21

                                           USD millions
Cash Flow from Operating Activities
                                                     Cash Position
                      259.0
                                                        $38.7M cash flow from
                              222.7                     operations in Q2 2021
                                                        Net cash of $509.3M, include
              189.1                                     cash equivalents, deposits,
                                                        restricted deposits and
                                                        marketable securities, net of
      136.7                                             debt (as of June 30, 2021)

                                        62.8

      2017    2018    2019    2020      YTD

                                      USD millions
Thank You!
Cautionary Note Regarding Market Data & Industry Forecasts
This power point presentation contains market data and industry forecasts from certain third-
party sources. This information is based on industry surveys and the preparer’s expertise in the
industry and there can be no assurance that any such market data is accurate or that any such
industry forecasts will be achieved. Although we have not independently verified the accuracy of
such market data and industry forecasts, we believe that the market data is reliable and that the
industry forecasts are reasonable.

Version #: V.1.0
You can also read