South Africa and Finland Education Collaboration and Market Opportunities - REPORT
←
→
Page content transcription
If your browser does not render page correctly, please read the page content below

South Africa and Finland Education
Collaboration and Market Opportunities

                     REPORT

                                                 0

      2020 | Roseanna Avento and Albertus Louw
South Africa and Finland Education Collaboration
and Market Opportunities

This report was commissioned by the Ministry for Foreign Affairs, Embassy of Finland in Pretoria, South Africa from
the University of Eastern Finland. Team Finland South Africa has prioritized education as a sector for enhanced
partnership between Finland and South Africa. This report is a product of the authors and the responsibility of the
accuracy of the data, findings, interpretations and conclusions included rests with the authors and does not nec-
essarily reflect the views of the Ministry for Foreign Affairs.

Authors        Roseanna Avento and Albertus Louw

Cover design   Bettina Lievonen, Graphics Designer, University of Eastern Finland
               based on images from mostphotos.com
ACKNOWLEDGEMENTS

We would like to thank all the interviewees in South Africa and Finland, and the respondents to the online
questionnaires for their time, insights and perspectives. We also thank Ms Melissa Plath of the University
Partnership for International Development (UniPID), Ms Annika Sundbäck-Lindroos of the Finnish Na-
tional Agency of Education and Mr Christopher Palmberg from the Beam with Impact Programme, for
the additional background information they provided, at very short notice. We thank the Southern Africa
Nordic Centre for Development (SANORD) and Education Finland for their assistance with the dissemi-
nation of the questionnaires.

We also would like to give many special thanks to Mr Igor Potgieter for his valuable technical assistance,
enthusiasm and unwavering encouragement throughout this assignment. Much appreciation goes to Ms
Eva Kagiri-Kalanzi for her support, useful comments, proofing and copy editing of the report, and to Ms
Bettiina Lievonen, Graphics Designer at the University of Eastern Finland for her assistance and advice
on the layout of this report.

Many thanks to Ms Iina Soiri, Education and Science Counsellor of the Team Finland Knowledge Network,
Pretoria, Business Finland South Africa’s Adviser Camilo Ramada and Ms Inês Cerqueira Mendes for their
guidance and counselling. We also thank the Embassy of Finland in Pretoria, His Excellency Ambassador
Kari Alanko and Commercial Advisor Rui Nozes for their support and guidance.

Much appreciation is given to the Embassy of the Republic of South Africa and Her Excellency Ambassa-
dor Carmen J. Smidt for her support, guidance and insight. We also thank Counsellor Tiaan Kriek for his
support.

Authors

ROSEANNA AVENTO is a global development professional working at the interface of higher education,
capacity building and business to address community-level challenges in developing countries. She is
Global Development Manager at the University of Eastern Finland and has 20+ years’ experience in man-
aging initiatives related to environmental, food and nutrition security, marketing, communication, entre-
preneurship and business engagement between Finland and emerging markets.
roseanna.avento@uef.fi

ALBERTUS LOUW is a documentary filmmaker, producer and TV presenter focusing on issues of educa-
tion, environment and solutions for the future. He is also a facilitator, working specifically in the area of
innovation. He has a very long history of working with NGO’s in disaster areas around the world from
Africa to the Middle East and South-East Asia. He is the Executive Director of Lightning Tree Stories, a
South African company using media to inspire change.
albertus@ltstories.co.za
EXECUTIVE SUMMARY
This study was implemented with the aim of describing the South African education landscape, identify-
ing the needs and priorities of the sector not only nationally, but also in two regions: Gauteng and the
Western Cape. It also identifies the opportunities for collaboration in the public and private sector and
matching them to Finnish stakeholder interests. In addition, the study aimed to highlight key operation
and funding models that can be utilised by South African and Finnish stakeholders in the education sec-
tor within their envisaged collaboration.

The results are based on online questionnaires sent to South African and Finnish stakeholders that were
sent directly to various organisations identified and through mailing lists of several member organisa-
tions to whom stakeholders belong. A total of 65 responses were received from Finnish organisations
and 21 responses were received from South African organisations. In addition, interviews with 14 Finnish
organisations and 27 South African organisations were conducted.

Questionnaire respondents in Finland were from universities, universities of applied sciences, TVET in-
stitutions, private enterprises and a few NGOs/CSOs, with the majority number of respondents being
from enterprises (31%). Sector representation was well varied from the arts to law, teacher training to
consultancy and social work. The interviewees were of a similar organisation representation, but also
included government authorities and agencies. In South Africa, the questionnaire respondents were al-
most equally both from public and private sector, with almost equal representation from the Western
Cape and Gauteng and with the majority being business enterprises and NGO/CSO sectors. Interview
respondents were mostly from the private sector and NGO/CSO sector and a slight minority of university
and government representation and mostly from the Western Cape. Only a few interviews were man-
aged in Gauteng, due to the peak holiday season in South Africa, during the study.

There is little collaboration in education between Finland and South Africa, compared to scientific re-
search collaboration. Finnish and South African higher education institutions are on an equal level par-
ring in terms of quality, which makes research collaboration easy to implement. Finnish organisations
mostly collaborate with South African public education, which is well-aligned with South African interests.
There is a high interest in collaborating in research and in education capacity development using external
funding from both the Finnish and the South African perspective.

Student mobility between the two countries has been on a constant decline, whereas researcher and
other academic mobility is not well-documented. There are also very few South African degree students
in Finland, only 19-20 on average.

There is little commercial activity in education between the two countries. Finnish education offerings
and services are relatively unknown to the South African community. While there is also a high interest
from the Finnish education community to engage in commercial product and service provision in educa-
tion, the same interest is not apparent from the South African responses. Finnish interest in collaboration
with the South African TVET sector is surprisingly low. Also, no TVET representatives in South Africa con-
tributed to the questionnaire or interviews. Since the development of TVET is an area of priority for South
Africa, it is advised that possible collaboration opportunities between Finnish and South African TVET
institutions are explored further.
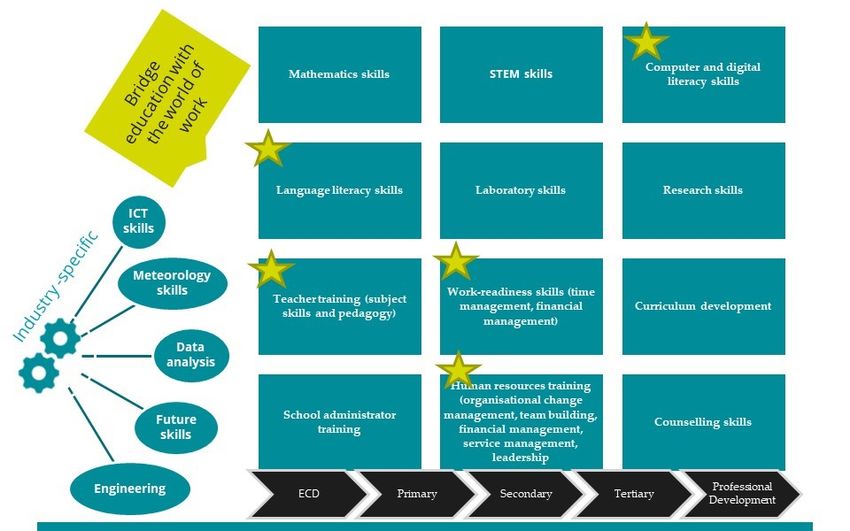
Finally, Finnish organisations mostly do not have a strategy or work plan for their activities in South Africa
and have many false perceptions or assumptions about the market. Many fail to research and do their
due diligence on legislation, regulations and operations.

South African organisations are interested in long-term relationships with partners who share their val-
ues and interest in developing education, in and for the South African context. They seek holistic, inclu-
sive and affordable solutions. South African entities in the education sector have a large variety of part-
ners from national and provincial government to NGOs and CSOs. Private sector engages widely in South
African education through corporate social responsibility activities, either through their own organisa-
tions and affiliates or through NGOs/CSOs. Up to 70% of private-sector funding for education develop-
ment in South Africa is directed through NGOs/CSOs. Partnerships between the private for-profit sector
and the not-for-profit sector are common and target every sector of education from early childhood
development to higher education. Public and private entities, for-profit and not-for-profit, on a local,
regional and international level are thus intertwined in a complex web of engagement, whose outcome
is measured in terms of the successes these partnerships can achieve in terms of education, in the areas
where they operate.

Gauteng and the Western Cape are two of the most well-resourced provinces in the country, also in
terms of education, and both have a large resource base in terms of private sector willing to engage in
corporate social responsibility activities. These two provinces, however, are facing challenges in terms of
increasing migration from other provinces, which increases the demands for education resources. 12
main needs were identified in the development of South African education, ranging from mathematics
skills to literacy, teacher and school administrator training and counselling skills. The five priorities iden-
tified cover: language literacy skills, computer and digital literacy, teacher training, human resource train-
ing and work-readiness skills. There is hardly any variation in needs identified, across education levels.
A need to bridge education with the world of work was very imminent.

The study recommends a focus and deepening of research collaboration between Finland and South
Africa, and on finding solutions to increase student mobility between the two countries. The study rec-
ommends that the Ministry of Education and Culture of Finland takes the initiative on deepening science,
technology and innovation (STI) collaboration between Finland and South Africa. Furthermore, the rec-
ommendation is for Finnish entities in education interested in collaboration with South Africa, to work
with the Team Finland Knowledge network to increase awareness of Finnish education in South Africa,
for example through very well focused networking events and webinars.

It is important for the Embassy of Finland in Pretoria and the Embassy of South Africa in Helsinki, to
jointly work together to increase awareness about the South African market and also for Finnish enter-
prises to do proper market studies and establish their due diligence, in terms of market entry options,
legislation and operation. We also encourage the establishment of innovative partnerships between
Finnish enterprise with Finnish higher education, NGOs/CSOs and with South African education organi-
sations, NGOs/CSOs and private enterprises. Examining past research and education collaboration be-
tween South Africa and Finland can be key for gaining a good insight into the possibilities for future
collaboration, be it research or education, either not-for-profit or commercial.
CONTENTS
1.     BACKGROUND ............................................................................................ 11
2.     METHODOLOGY AND LIMITATIONS ........................................................... 11
3.     SOUTH AFRICA IN A NUTSHELL .................................................................. 15
3.1.     SOUTH AFRICAN EDUCATION POLICY ................................................................ 18
3.2.     STAKEHOLDERS IN SOUTH AFRICAN EDUCATION ................................................ 21
3.3.     THE EDUCATION SYSTEM IN SOUTH AFRICA ....................................................... 23
3.4.     FROM A NATIONAL OUTLOOK TO A PROVINCIAL LEVEL ......................................... 33
3.4.1.      EDUCATION IN THE GAUTENG PROVINCE ....................................................... 33
3.4.2.      EDUCATION IN THE WESTERN CAPE PROVINCE................................................ 36
3.5.     EDUCATION PARTNERSHIP MODELS IN SOUTH AFRICA ......................................... 39
3.6.     PRIVATE SECTOR ENGAGEMENT IN SOUTH AFRICA’S EDUCATION SECTOR ................ 41
3.7.     EXTRA NOTE ON INTERNATIONAL PARTNERSHIPS ................................................ 46
4.     OPPORTUNITIES AND OUTLOOK ............................................................... 51
4.1.     TRAINING NEEDS, PRIORITIES AND INVESTMENTS ................................................ 51
4.2.     EDUCATION COLLABORATION BETWEEN SOUTH AFRICA AND FINLAND ................... 54
4.2.1.      LOOKING BACK IN TIME .............................................................................. 54
4.2.2.      EXPLORING THE PRESENT ............................................................................ 59
4.2.3.      FUTURE OUTLOOK..................................................................................... 68
5.     SUMMARY OF FINDINGS AND RECOMMENDATIONS ................................ 75
LIST OF TABLES AND FIGURES

Table 1. Fields represented by questionnaire respondents in Finland
Table 2. South African and Finnish universities in world rankings in 2019
Table 3. South African and Finnish universities on the Times Higher Education University Rankings In-
come Pillar 2020
Table 4. Regulatory framework: for-profit education organisations in South Africa
Table 5. Regulatory framework: not-for-profit education organisations in South Africa
Table 6. Short-term student credit mobility between South Africa and Finland
Table 7. South African student enrolment in Finnish higher education

Figure 1. Organisations in Finland that responded to the questionnaire regarding collaboration with
South African institutions
Figure 2. Organisations represented by South African respondents to questionnaire
Figure 3. Map of the Republic of South Africa
Figure 4: Main stakeholders in South Africa’s education space
Figure 5: Education in South Africa
Figure 6: South Africa’s matric results in 2019 by province
Figure 7: NSC subject enrolment 2015-2019
Figure 8. Total revenues of South African universities in 2019
Figure 9. Training needs and priorities in South Africa identified by the South African respondents and
interviewees
Figure 10. Type of collaboration between Finnish and South African organisations over the past 5 years
till present
Figure 11. South African organisations that Finnish education organisations collaborate with
Figure 12. South African organisations that Finnish organisations in education are interested in
collaborating with
Figure 13. Activities that interest Finnish organisations
Figure 14. Modes of collaboration interesting for Finnish organisations
Figure 15. Type of collaboration interesting for South African organisations

Box 1. Competitive South Africa
Box 2. Ambitious development goals towards 2030
ABBREVIATIONS

AIMS            African Institute of Mathematical Sciences
ARWU            Academic Ranking of World Universities
ANC             African National Congress
AU              African Union
AusAID          Australian Aid Agency
AZAPO           Azanian People’s Organisation
BBBEE Act       Broad-Based Black Economic Empowerment Act
BRICS           Brazil, Russia, India, China and South Africa.
CAIE            Cambridge Assessment International Education
CAT             Computer Application Technology
CEM             Council of Education Ministers
CET             Community and Training Colleges
CESA            Continental Educational Strategy for Africa
CIMO            Center for International Mobility
CHE             Council for Higher Education
CJCP            Centre of Justice and Crime Prevention
COSATU          Congress of South African Trade Unions
CSI             Corporate Social Investment
CSR             Corporate Social Responsibility
CSO             Civil Society Organisation
CWUR            Centre for World University Ranking
DAAD            German Academic Exchange Service
DBE             Department for Basic Education
DCI             Development Cooperation Instrument
DHET            Department of Higher Education and Training
DSD             Department of Social Development
EC              European Commission
ECD             Early Childhood Development
EDUFI           Finnish National Agency of Education
EF              Education Finland
EGD             Engineering Graphics and Design
ELRC            Education Labour Relations Council
EQUIP           Education Quality Improvement Programme
FDRS            Finnish Development Research Society (FDRS)
                Developing Finnish Science, Technology and Innovation Cooperation
FinCEAL         between Europe, Africa, Asia and the Latin American and Caribbean
                (LAC) Region
FOCAC Forum of China-Africa Cooperation
GDE Gauteng Education Department
GDP Gross Domestic Product
HEIs Higher Education Institutions
HEI ICI Higher Education Institutes’ Institutional Cooperation Instrument
ICT Information and Communication Technology
IFAS Institut Français in South Africa
IFP Inkatha Freedom Party
IFRE French Research Institute Abroad
IGCSE International General Certificate of Secondary Education
iNGO International non-governmental organisation
IMS Integrated Manufacturing Strategy
IT Information Technology
JET Joint Education Trust
JSE Johannesburg Stock Exchange
LDC Least Developed Country
MFA Ministry for Foreign Affairs of Finland
MTSF Medium-Term Strategic Framework
MOU Memorandum of Understanding
NACTU National Council of Trade Unions
NAI Nordic Africa Institute
NBI National Business Initiative
NEEDU National Education Evaluation and Development Unit
NEPAD New Economic Partnership for Africa’s Development
NDP National Development Plan
NGO Non-governmental organisation
Norwegian Programme for Capacity Development in Higher Educa-
NORHED
tion and Research for Development
NPO Not-for-profit organisation
NQF National Qualifications Framework
NRDS National Research and Development Strategy
NRF National Research Foundation of South Africa
NSC National School Certificate
NSDP National Skills Development Plan 2030
NSFAS National Student Financial Aid Scheme
NSS North-South-South Network Programme
NUFFIC Dutch Organisation for Internationalisation in Education
NWO Dutch Research Council
PAC Pan Africanist Congress
PBO Public Benefit Organisation
PAEPL Provincial Average Estimate (of cost) per Learner
PPPFA Act Preferential Procurement Policy Framework
PSET Post-School Education and TrainingQCTO Quality Council for Trade and Occupations
ODA Official Development Assistance
OECD Organisation for Economic Co-operation and Development
RSA Republic of South Africa
SACE South African Council for Educators
SADC Southern African Development Community
SADTU South African Democratic Teachers Union
SAGA South African Grant Makers Association
SAIS Southern Africa Innovation Support Programme
SANBio Southern Africa Network for Biosciences
SANORD South Africa Nordic Centre for Research and Development
SASUF South Africa Sweden University Forum
SETAs Skills Education Training Authorities
SCAC Cooperation and Cultural Action Service
SDGs Sustainable Development Goals
SIDA Swedish International Development Agency
SKA Square Kilometre Array
SMT Science, Mathematics and Technology
SOE State Owned Enterprise
STI Science, Technology and Innovation
Swedish Foundation for International Cooperation in Research and
STINT
Higher Education
SWAPO South West Africa People’s Organisation
THE Times Higher Education
TSI Tshikululu Social Investment
TSP Technology Stations Programme
TVET Technical and Vocational Education and Training
Council for Quality Assurance in General and Further Education and
UMALUSI
Training
UniPID University Partnership for International Development
UF Urban Foundation
USAID US Agency for International Development
WCDED Western Cape Department of Economic Development
WCDE Western Cape Education Department
WSE Whole School Evaluation1. BACKGROUND
Education has been identified as one of the top priorities for the Team Finland South Africa Action
Plan 2020, amplified by the posting of an Education and Science Counsellor, as a member of the Team
Finland Knowledge Network, to the Embassy of Finland in Pretoria. The aim of these actions is to
strengthen ties with South African universities, colleges, private schools and government entities, as
well as to provide support to Finnish private sector aiming at entering the South African education
market.
This report is aimed at describing the South African education landscape, identifying the priorities and
needs of the sector, nationally as well as in two regions: Gauteng and the Western Cape. It also iden-
tifies opportunities for collaboration in the public and private sector, consolidating the South African
stakeholder interests with Finnish stakeholder interests. In addition, the report highlights key funding
models and examples on modes of operations that could be utilized by South African and Finnish
stakeholders within their envisaged collaboration. Finally, the report makes recommendations for fu-
ture steps that can be taken by South African and Finnish entities in order to enhance their collabora-
tion.
2. METHODOLOGY AND LIMITATIONS
The findings in this report are based on a document and content analysis of national and sectoral
policy and strategy documents in South Africa. Further, a stakeholder mapping was conducted to iden-
tify key players in South Africa: nationally, in Gauteng and Western Cape regions. In addition, a stake-
holder mapping of actors in the education sector in Finland was also conducted.
Two online questionnaires were sent to stakeholders in South Africa, one for education sector stake-
holders and another for private sector stakeholders. The questionnaires were sent directly to the var-
ious organisations and through different mailing lists of various member organisations. An online
questionnaire was also sent to stakeholders in Finland, directly, and through various mailing lists e.g.
University Partnership for International Development (UniPID), Finnish National Agency of Education
(EDUFI), Education Finland (EF), Finnish Development Research Society (FDRS) etc. In addition, face to
face interviews, skype and telephone interviews were conducted with stakeholders both in South Af-
rica and Finland.
The biggest challenge was the timing of the survey, which was implemented during the start of the
South African peak holiday season and Finnish Christmas holiday season. There could have been more
responses and wider coverage had the survey been implemented at a more convenient time for both
the South African and Finnish community.
11Respondents in Finland
The total number of respondents to the questionnaire amounted to 65. The respondents represented
a large variety of actors in Finland (Figure 1), with university representatives comprising 34% of the
respondents, followed closely by private sector representatives at 31%. Technical and vocational ed-
ucation and training (TVET) institutions followed at 17% and universities of applied sciences comprised
11% of the respondents. Non-governmental organisation and civil society organisation representa-
tives made up 7% of the respondents.
69% of the respondents have
not collaborated with South
University African entities before, but
31% have.
31 % University of
34 %
Applied Sciences
Of those that have collabo-
TVET Institution rated with South African enti-
ties, the majority are univer-
NGO/CSO sities and universities of ap-
plied sciences (n= 15/20
7%
11 % Private ~ 75%) and only 4 private sec-
17 %
Enterprise tor companies that re-
sponded, have collaborated
with South African entities.
Figure 1. Organisations in Finland that responded to the question-
naire regarding collaboration with South African institutions
In addition, there were 14 interviews conducted, with the following sectors involved: schools, govern-
ment, government agencies and private sector. Interviews were conducted face to face, over skype
and telephone and 3 interviewees sent their answers over email due to time constraints.
The questionnaire respondents represented a large variety of fields (Table 1). The highest represen-
tation was in teacher training (9/65), followed by primary and high school education (7/65), and inter-
nationalization of higher education (6/65) followed by entrepreneurship education and educational
technology representatives (each 4/65). Art and design, health and law sectors each had 3/65 respond-
ents, whereas consultancy, social work, university training and early childhood education sectors were
each represented by 2/65 respondents. All other sectors mentioned had 1 respondent representing
their sector. There were no significant differences in responses by organisation or by sector in Finland.
12Table 1. Fields represented by questionnaire respondents in Finland
Field Number of Respondents
Arts and Design 3
Border Studies 1
Cleaning and Property Management 1
Consultancy 2
Disability Studies 1
Early Childhood Education 2
Education Technology 4
Educational Travel 1
Energy 1
Entrepreneurship Education 4
Food Security 1
Futures Research 1
Gaming 1
Health 3
Internationalisation 6
Law 3
Logistics 1
Management and Business 1
Music 1
Other 3
Pharmacy 1
Primary and High School Education 7
Publishing of Education Material 1
Religion/Theology 1
Rural Development 1
Social Work 2
Teacher Training 9
University Training 2
Respondents in South Africa
There were two questionnaires delivered in South Africa: one targeted at educational insti-
tutions and the other at industry representatives. In total, there were 21 responses with 10
responses from education organisations, and 11 from industry representatives. Considering
that the questionnaires were sent out during the South Africa peak holiday season, this can
be considered a reasonably good result. The results of the questionnaires have been collated
since questions on the questionnaires were mostly the same, and there were no significant
differences between responses of education institutions and industry.
13A majority of the South African respondents represented private sector (52% n=11), whereas
public sector was represented by 48% (n=10) of the respondents (Figure 2). Business enter-
prises were represented by 38% (n=8) of the respondents and the NGO/CSO sector by 29%
(n=6) of the respondents. Universities were represented by 19% (n=4) of the respondents.
No TVET institution representatives responded to either questionnaire.
Private Sector Organisation
Public Sector Organisation
Business Enterprise
Non-Governmental Institution
Government Organisation
Other Professional Education Institution
University
TVET Institution
Secondary Education Institution
Primary Education Insitution
Early Childhood Education Insitution
0% 10% 20% 30% 40% 50% 60%
Figure 2. Organisations represented by South African respondents to questionnaire
Geographically, 57% (n =12) of the respondents operate nationally, whereas 33% (n=7) oper-
ate in Gauteng, 24% (n=5) operate in the Western Cape, and 5% (n=1) in Mpumalanga prov-
inces. In addition, there were 27 interviews conducted with representatives from the educa-
tion sector, local governments, NGOs and the private sector. Interviews were conducted face
to face, over skype and telephone. Most of the interviews were conducted in the Western
Cape. Few interviews were granted in Gauteng, due to the holiday season. However, there
were no significant differences in the responses by region or by sector.
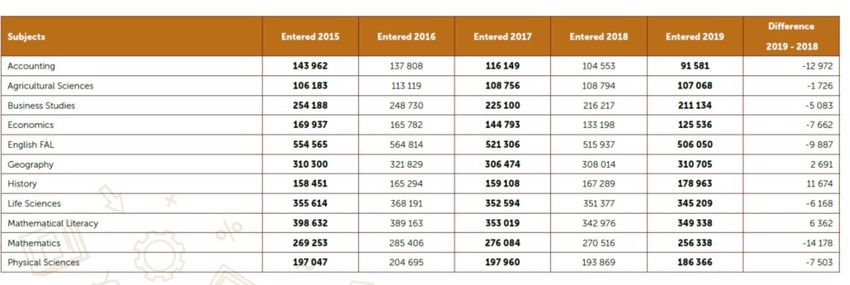
143. SOUTH AFRICA IN A NUTSHELL
The Republic of South Africa (RSA) is the southernmost country on the African continent,
which with a surface area of 1.2 million square kilometres, makes it the 24th largest country
in the world, the ninth-largest in Africa and the fifth-largest country in the southern hemi-
sphere. To provide perspective, South Africa is larger than every country in Europe and every
state in the USA except Alaska and is twice the size of France and 5 times larger than the UK
and 4 times larger than Finland. The population of South Africa is 56.5 million, compared to
Finland’s 5.5 million. South Africa is bordered by Namibia to the northwest, Botswana and
Zimbabwe to the north and by Mozambique and Eswatini (Swaziland) to the northeast and
east. Lesotho, an independent country, is an enclave in the eastern part of South Africa and
is surrounded by South African territory (Figure 3).
Figure 3. Map of the Republic of South Africa
Source: United Nations, 2007.
South Africa has 9 provinces: Eastern Cape, Free State, Gauteng, KwaZulu-Natal, Limpopo,
Mpumalanga, Northern Cape, North West and Western Cape. South Africa has 3 capitals:
Pretoria (executive), Cape Town (legislative) and Bloemfontein (judicial). Johannesburg is the
largest urban area in the country and the centre of commerce in the heart of Gauteng,
whereas Durban, a major industrial centre, is also a major port on the Indian Ocean.
15South Africa is the second-largest economy in Africa
and largest in Sub-Saharan Africa, comprising al-
most 20% of Sub-Saharan Africa’s GDP with the BOX 1. COMPETITIVE SOUTH AFRICA
highest GDP per capita (World Bank, 2019; Busi-
nessTech, 2018). The region is largely driven by the
services sector that accounts for nearly 70% of GDP
(World Bank, 2019). However, South Africa remains
one of the most unequal countries globally with Population: 56.6 million
10% of the population controlling 90% of the wealth
Population under 25: 26 million
in 2016, and with the economy not generating suf-
Open Budget Index: 2nd out of 102
ficient jobs, the unemployment rate stood at 27.7%
countries for its transparent state
in the third quarter of 2017 (World Bank, 2019).
governance system.
On a political level, the South African government World Economic Forum Global
has identified the following priorities: economic Competitiveness Index (WEF GCI):
transformation and job creation; education, skills • 1st out of 141 countries for
and health; consolidating the social wage through Budget Transparency.
reliable and quality basic services; spatial integra- • 19th in the Finance pillar.
tion, human settlements and local government; so- Good Country Index:
cial cohesion and safe communities; a capable, eth- • 3rd out of 153 countries for its
ical and developmental state and finally, a better Af- contribution to International
rica and world. Peace and Security
Economically, South Africa remains an African • 18th for Science and Technology
powerhouse and offers a unique combination of • 31st for its contribution to World
developed-world infrastructure and logistics net- Order
works and a diversified emerging market economy, World Bank Logistics Perfor-
offering low sectoral concentration risks. South Af- mance Index:
rica has a sophisticated banking sector, is the conti- 33rd out of 160 countries
nent’s financial hub and has Africa’s largest stock EY Africa Attractiveness Survey
exchange by market capitalization (Young, 2018). (2019):
The Johannesburg Stock Exchange’s (JSE) All-Share 5th largest source of FDI in pan-Afri-
Index has outperformed other emerging market in- can economy
dices since the start of the new millennium. It is the Ease of Doing Business Ranking
largest in Africa and one of the world’s top 20 ex- (2019): 82
changes (Seery et al., 2019). (World Bank, 2019; Young 2018)
South Africa’s current growth is slow with high infla-
tion and increasing government debt. The nominal
GDP in the 3rd quarter of 2019 was 1.29 trillion ZAR.
After rebounding by a revised 3.2% in the second
quarter of 2019, it contracted by 0.6% in the third
quarter. Mining, manufacturing and transport were
the biggest drags on growth in GDP. Unadjusted
16real GDP growth in the 3rd quarter was 0.1% year-on-year (Statistics SA, 2019a). Standard &
Poor’s credit rating for South Africa stands at BB with a negative outlook, Moody’s credit
rating is at Baa3 with a negative outlook and Fitch’s credit rating was last reported at BB+
with a negative outlook (Trading Economics, 2019). Government spending continued to in-
crease, in 2018, because of free higher education for poor communities, poorly performing
state-owned enterprises (SOEs) and government intervention to minimize the impact of slow
economic growth. Confidence in the economy has been low because of poor governance,
high levels of corruption, skills mismatches and issues surrounding land expropriation.
Major initiatives to stimulate the economy have been launched such as a job summit and an
annual South Africa Investment Conference. Other government measures to boost the econ-
omy include a commission of inquiry into state capture, restructured state-owned enterprise
boards and new tax measures (Young, 2018).
Examining South Africa through a social lens reveals that the majority (66%) of South Africa’s
56.5 million population is under the age of 35. About 37.7 million of its population is of work-
ing age. With 66.4% of the population living in urban areas, the country represents concen-
trated markets (Seery et al., 2019). South Africa is considered one of the most unequal coun-
tries in the world, and fourth on the list of unequal nations in Africa (Seery et al., 2019).
However, South Africa is also doing the most to reduce inequality (Seery et al., 2019). South
Africa is in second place, in Africa, for social spending, with a strong record of investing in
health, education and social protection (Seery et al., 2019) and is also first among African
countries when it comes to tax progressivity and third globally (Seery et al., 2019). While 54%
of southern Africa’s population lives in rural areas, in South Africa it is only 35%. 17% of South
Africa’s population live below the poverty line of $1.90 a day. South Africa’s Human Develop-
ment Index value for 2018 was 0.705 – positioning it at 113 out of 189 countries and territo-
ries.
South Africa has notably high levels of crime which mainly affects poorer members of soci-
ety. Poverty, poor service delivery and disparities between rich and poor are reported to
directly impact crime levels. However, South Africa has achieved tremendous progress in
social cohesion and reconciliation since the official end of apartheid in 1994. The country has
a unique geographic, linguistic, cultural, economic and religious diversity that inspires vibrant
creativity (Young, 2018). Largely peaceful and secure, southern Africa is the most stable re-
gion in Africa (African Development Bank Group, 2019)
Technologically, South Africa has hi-tech developments in agriculture, agro-processing and
mining. It has advanced automotive, chemical and fuel technologies industries. The country
has a great track record in the development of technologies around mining, energy storage,
medical devices and telemedical instrumentation, biotechnology, additive manufacturing,
transport, financial technology and digital banking. South Africa is among the pioneers of
technology in the fuel cell industry. There is strategic government support through the Na-
tional Research and Development Strategy (NRDS) and Integrated Manufacturing Strategy
17(IMS) to boost the development of advanced technologies to enhance competitiveness in the
manufacturing sector. In addition, a Technology Stations Programme (TSP) is being imple-
mented in partnership with leading local universities and the government is also supporting
Industry Innovations programmes and a Sector Innovation Fund (IDC and SAINVEST, 2019).
68% of the South African population has access to mobile phones and 54% access to the
internet. There are 147 mobile subscriptions per 100 inhabitants (IDC and SAINVEST, 2019).
Communications is one of the fastest-growing sectors in the South Africa economy. There is
a massive opportunity for growth in ICT applications, inter-device communications technol-
ogy, big data tools, data centres and frontier ICT technology skills development (IDC and
SAINVEST, 2019). South Africa’s hosting of the Square Kilometre Array (SKA) – the world’s
largest radio telescope - is putting it on the international map as the very latest in radio tel-
escope technology is coming to the Northern Cape and is set to be completed by 2028, facil-
itating the biggest scientific collaboration the world has ever seen (Young, 2018).
During 2020, South Africa will chair the African Union (AU), making it an excellent time to
explore opportunities both in South Africa and the rest of the continent. At the same time,
the African Continental Free Trade Area Agreement, of which South Africa is a signatory, will
be operationalized, creating a market of over one billion people and a combined GDP of US$
2.2 trillion (Seery et al., 2019).
3.1. South African education policy
The African Union’s Agenda 2063: The Africa We Want is the masterplan and strategic
framework for transforming Africa into a global powerhouse for the future, aiming at the
delivery on Africa’s goal for inclusive and sustainable development and is a concrete mani-
festation of the pan-African drive for unity, self-determination, freedom, progress and col-
lective prosperity (Agenda 2063). Agenda 2063 was borne from the realization by African
leaders that there was a need to prioritise Africa’s agenda to promote inclusive social and
economic development, continental and regional integrations, democratic governance,
peace and security (Agenda 2063). At the heart of the long-term 50-year development trajec-
tory, is the education-development nexus, which demands that Africa invests in skills, sci-
ence, technology, engineering and mathematics to ensure that the peoples of Africa drive
the development of the continent into a growth pole.
The Continental Education Strategy for Africa 2016-2025 (CESA-16-25) drives to establish
a qualitative system of education and training to provide Africa with efficient human re-
sources adapted to African core values and therefore capable of achieving the vision and
ambitions of the AU. There is a call to reorient Africa’s education and training systems to
meet the knowledge, competencies, skills, innovation and creativity required to nurture Af-
rican core values and promote sustainable development at the national, sub-regional and
continental levels. Over the last two decades, national governments, regional communities
and continental groupings have heavily invested in the schooling and training of African chil-
dren and youth, articulated strategic policy frameworks and plans to achieve accessible,
18dynamic and relevant education development (CESA 16-25). Gains have not, however, been
fully optimal and there still is a vast and urgent need to improve access, quality and relevance
(CESA 16-25). Educational development that is meaningful requires a clear, defined vision
and strategic framework, owned and articulated around the socioeconomic and cultural as-
pirations of people (CESA 16-25). Education programmes designed and financed from the
outside unavoidably lack coherence and their impact remains limited (CESA 16-25).
In this wake, CESA16-25 identifies ten priority areas for the region: (1) equitable and inclusive
access to education for all; (2) inclusion, equity and gender equality; (3) teachers and teach-
ing; (4) educational quality and learning outcomes; (5) science, technology and skills devel-
opment; (6) education for sustainable development (ESD) and global citizenship education
(GCE); (7) youth and adult literacy; (8) skills and competencies for life and work; (9) financing,
governance and partnerships; and (10) education in crises situations.
The Continental Strategy for Technical and Vocational Education and Training for
Youth Employment aims to revitalise TVET in Africa. The main objective of the strategy is to
revitalise, modernise and harmonise TVET to ensure it transforms into a mainstream activity
for African youth development, youth employment and human capacity development. Fur-
thermore, it aims at positioning TVET programmes and institutions in Africa as vehicles for
regional cooperation and integration, and socio-economic development. Moreover, the
strategy aims to mobilise all stakeholders in a concerted effort to create synergies, and share
responsibilities for the renewal of TVET policies, programmes and strategies in Africa.
The Southern African Development Community (SADC) is an inter-governmental organi-
sation that aims to promote sustainable and equitable economic growth and socio-economic
development among its 15 southern African member states (SADC, 2020). Member states of
SADC have committed to promoting regionally integrated and harmonised educational and
training systems in line with the AU’s plans of actions and through their Protocol on Educa-
tion and Training have identified priorities, thus:
• Early childhood education and care
• Gender and culture
• Education management information systems
• Teacher education and development
• Higher education and training
• Technical and vocational education and training
• Curriculum development including teaching and learning materials
• Quality management
• Cross-cutting activities related to HIV/AIDS and ICT
The central government of South Africa is, as a whole, responsible for education in the coun-
try, making national policy and issuing national education guidelines and aligning these to
the AU Agenda 2063, CESA-16-25 and the priorities identified by SADC. After apartheid ended
in 1994, South Africa focused on providing large-scale access to free education, resulting in
19the continent’s largest public system with government
spending on education amounting to nearly 20% of
the budget, with 60% allocated to K-12 while about BOX 2. AMBITIOUS DEVELOP-
25% is allocated to higher education (Ferreira and MENT GOALS TOWARDS 2030
Featherston, 2017).
The basis for education policy is rooted in the Na-
tional Skills Development Plan 2030 (NSDP). The Increase TVET enrollments to ac-
NSDP aims to ensure that South Africa has adequate, commodate 1.25 million enroll-
appropriate, and high-quality skills that contribute to ments.
economic growth, employment creation and social de-
Provide 1 million learning op-
velopment. The NSDP derives from the National De-
portunities through Community
velopment Plan (NDP) whose framework stems from Education and Training Colleges.
‘building the capacities of citizens to make the future
work’. The NDP sets several ambitious objectives to be Improve the throughput rate to
met by 2030 (Box 2). 80%.
The Medium-Term Strategic Framework (MTSF)
Produce 30 000 artisans per
2019-2024 indicates the priorities for South Africa in year by 2030.
achieving vision 2030 and sets targets for the imple-
mentation of priorities and interventions also stating Increase enrollments at univer-
outcomes and indicators to be monitored. sities by at least 70% (increase
by 1.62 million from 950 000 in
Priority 2 on the MTSF is education, skills and health 2010).
and aims at achieving the following education targets
related: (1) expansion of access and improving quality Increase the number of students
of education by 2024, (2) every 10-year old will be able eligible to study towards math
to read for meaning (3) South Africans should have ac- and science-based degrees to
cess to education and training of the highest quality 450 000
by 2025, number 1 in Sub-Saharan Africa in 2024 and
number 1 on the African continent by 2030, (4) replace Increase the number of PhD
qualified staff in HEIs from 34%
unsafe school buildings and sanitation service by 60%
to 75%
by 2024 and make all schools comply with school in-
frastructure norms by 2030, (5) fund TVET and com-
Produce more than 100 doctoral
munity colleges to respond to country skills need and graduates per million per year;
high level of unemployment by 2024 (6) improve ac- from 1420 in 2010 to over 5000
cess to post-school education from the current 1.2 a year.
million to 2.1 million by 2024 and 3.1 million by 2030,
(7) increase efficiency of the Post-School Education (NSDP 2030)
and Training (PSET) system, (8) increase and improve
education outputs by 2024.
20Action Plan to 2024: Towards the realization of schooling 2020, with its 27 goals, aims at
the transformation of schools in South Africa and is targeted at a myriad of stakeholders:
parents, teachers, school principals, district government officials, the provincial govern-
ments, and national government, members of parliament, civil society leaders, including
teacher unions, private sector, researchers and international agencies like the World Bank
and UNICEF.
3.2. Stakeholders in South African education
Education in South Africa is a challenging landscape to navigate because of the sheer number
of systems within systems. While there is a public sector in education, there is also a private
sector with a myriad of operators, whose provision of education services is on the rise. The
government plays a role in both the public and private sector.
South Africa has two ministries responsible for education. the Department for Basic Edu-
cation (DBE), which is responsible for all school education and the Department of Higher
Education and Training (DHET), which is responsible for tertiary education. The DHET also
administers 21 Skills Education Training Authorities (SETAs) that are responsible for
learnerships, internships, unit-based skills programmes and apprenticeships in different in-
dustry sectors. One of the primary functions of the SETAs is to collect skills development
levies from employers within each sector and these funds are then made available for edu-
cation and training in each sector. The funds are directed to employers, training bodies and
learners in the form of discretionary grants and bursaries. Each of the 9 provinces in South
Africa have an education department, responsible for implementing national policy.
Private provision can be for-profit or not-for-profit (charitable, non-governmental, faith-
based or community). Policy in South Africa is supportive of private education with for-profit
operations and foreign ownership allowed across all education segments. Having local own-
ership, however, helps in attaining government contracts.
Before we describe the landscapes for each of the phases in South African education (section
3.3), it is worthwhile looking at the main stakeholders in the South African education space
(Figure 4). These are the organisations whom any education provider in South Africa should
expect to work with.
At the pre-primary stage, the DBE registers and monitors all early childhood development
(ECD) centres, whereas the Department of Social Development (DSD), registers and mon-
itors all ECD centres that offer Grade R. In primary education, the provincial Department
of Education licenses and registers education providers, whereas the Council for Quality
Assurance in General and Further Education and Training (UMALUSI) is the body re-
sponsible for quality accreditation. Umalusi means “herder or shepherd”, in the Nguni lan-
guages: the person who is the guardian of the family’s wealth.
21In higher education, the Council on Higher Education (CHE) is responsible for quality ac-
creditation, and the South African Qualifications Authority is responsible for oversight of
the National Qualifications Framework (NQF). For TVET, licensing and registration is man-
aged by the DHET and UMALUSI is responsible for quality accreditation.
South Africa has a Council of Education Ministers (CEM) that consists of the Ministers of
Basic Education, Higher Education and Training and the nine provincial members of the ex-
ecutive councils of education that promote the national education policy and share infor-
mation and views on all aspects of education in South Africa.
The National Education Evaluation and Development Unit (NEEDU) ensures evaluation
of educators at the school level, and the Education Labour Relations Council (ELRC) is a stat-
utory council that maintains labour peace within public education through processes of dis-
pute prevention and resolution.
The South African Council for Educators (SACE) is a professional council aimed at enhanc-
ing the status of the teaching profession and promoting the development of educators and
professional conduct. SACE has several programmes to promote the development of educa-
tors and enhance the status and image of the teaching profession, including:
- Professional Development Portfolio Project
- Teacher education and development research activities
- Continuing Professional Teacher Development System
- Celebration of World Teachers’ Day
- Ensuring that educators adhere to the SACE Code of Professional Ethics
South Africa also has six educator unions (National Professional Teachers’ Organisation of
South Africa, National Teachers’ Union, South African Teachers’ Union, Professional Educa-
tors’ Union, Cape Professional Teachers’ Association and South African Democratic Teachers’
Union).
The National Student Financial Aid Scheme (NSFAS) is a bursary scheme funded by the
DHET for South African students who do not have the financial means to fund their studies
and cannot access bank funding, study loans or bursaries (NSFAS, 2020). Financial aid is given
to eligible students at public TVET colleges and public universities and covers accommoda-
tion (at university residence costs, and for TVET college students set amounts depending on
if accommodation is in an urban, peri-urban or rural area), transport (up to 40 km from the
institution), living allowance, book allowance and incidental/personal care allowance). Stu-
dents must already have a study placement before applying. In 2019, NSFAS received 216748
applications, mainly for studies at public universities), whereas only 10% of funding applica-
tions were for studies in TVET colleges (NSFAS, 2019). Region-wise, the highest number of
funding applications in 2019 came from KwaZulu Natal, Limpopo and Gauteng provinces,
whereas the North West, Western Cape and Northern Cape generated the lowest number of
funding applications (NSFAS, 2019).
22Figure 4: Main stakeholders in South Africa’s education space
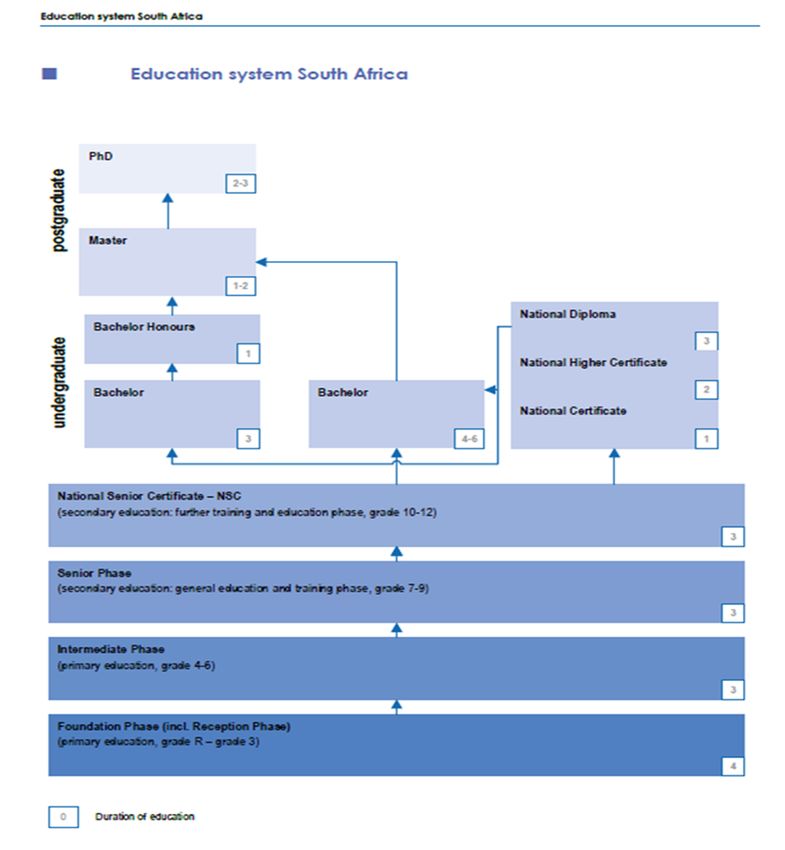
3.3. The education system in South Africa
Education in South Africa is divided into pre-primary (preR-R); primary (grade 1- 9), further
education (grade 10-12, intermediate vocational colleges and community colleges); and
higher education (Figure 5).
General Education and Training (GET): grade R up to 9
Pre-primary education consists of grades pre-R and R, the latter being compulsory. Public
provision of Grade R is estimated at 95%, but private provision is growing. Pre-R provision
is typically given by stand-alone community-based centres (Ferreira & Featherston, 2017).
Pre-primary operators cite challenges in complying with quality and safety requirements.
Private schools can choose their curriculum, can be for-profit or non-profit, and must meet
the requirements for provincial registration to be legal. For private non-profit registered
schools, provincial government subsidies of up to 60% of the Provincial Average Estimate (of
cost) per Learner (PAEPL) in a public school are available. The subsidy is awarded on a sliding
scale (16-60%) according to the fee-level of the school. Schools must meet strict quality cri-
teria, apply for a subsidy annually, and submit audited financial statements. Primary school
pupils have the right to be educated in their home language, and from grade 3, take an ad-
ditional language. From grade 4, education is in English or Afrikaans (NUFFIC, 2015).
23Figure 4: Education in South Africa
Source: NUFFIC, 2015
24Further Education and Training Grade 10 up to grade 12, and intermediate vocational
education at technical colleges, community colleges, and private colleges
There is a high variation in K-12 education provision in South Africa. The big disparities be-
tween people, schools and regions result in a harsh reality, described by Spaull (2019) where
the life-chances of the average South African child are determined by the colour of their skin,
the province of their birth and wealth of their parents. Ferreira and Featherston (2017) de-
scribe that public schools are grouped into quintiles with the first three having no fees and
enrolling nearly 80% of all the students, with government spending being about 1000 USD/
student.
Quintile 4 and 5 schools are priced higher and offer a quality of education similar to high-
quality private schools. Private education with fees greater than 2000 USD is inaccessible to
most, but reaches about 5% of the population, mostly in the wealthier regions such as the
Gauteng region, which accounts for 45% of all K-12 provision in South Africa. Spaull (2019)
demonstrates that between 2010 and 2017 there was an 8% decline in per learner expendi-
ture in purchasing power terms, which is now manifesting itself in student performance.
Public schools are evaluated through the Whole School Evaluation (WSE) framework and
private schools are accredited by UMALUSI through a comprehensive, rigorous and costly
process. Any education system is as strong as its teachers. There is a serious lack of qualified
teachers in South Africa (Spaull, 2019; Ferreira and Featherston, 2017). For instance, Venkat
and Spaull (2015) demonstrated that up to 70% of Grade 6 mathematics teachers could not
score 60% or higher on Grade 6 or 7 level questions.
Whereas there are many challenges within the education system, there are also successes.
In 2019, the matriculation results revealed that the average pass rate for the National School
Certificate (NSC) was 81.3%, an improvement from the past year’s 78.2% (DBE, 2020), and
the matriculants produced 156 884 distinctions. These were the highest pass percentages
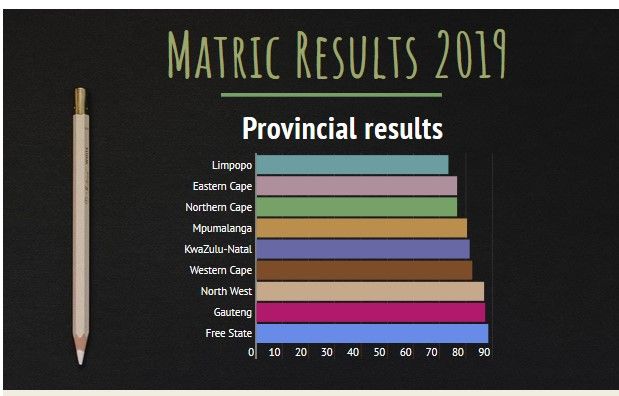
recorded in the last 25 years (DBE, 2020). The top-performing province was Free State, fol-
lowed closely by Gauteng Province, North West and Western Cape (Figure 6). Spaull (2014)
however cautions against comparing provincial averages as disparities between learners
even in one province may be huge. It is more meaningful therefore to compare the perfor-
mance of quintile 1 learners across the provinces or quintile 2 learners across the provinces
(Spaull, 2014). The matriculation exam is used extensively as a selection criterion for univer-
sity admissions and thus has important consequences for individual learners (Spaull, 2014).
25Figure 6: South Africa’s matric results in 2019 by province
Source: DBE, 2020
There is cause for concern in terms of certain skills subjects in the matriculation results of
2019. In 2019, there was a drastic reduction in numbers of students that sat mathematics,
accounting, English, economics, physical sciences and life sciences (Figure 7). It is logical to
expect a huge reduction in students studying STEM subjects at university, in the future. His-
tory, on the other hand, seems to attract a lot of students.
26Figure 7: NSC subject enrolment 2015-2019
Source: DBE, 2020
27While grade 10-12 are not compulsory, students are required to complete a minimum num-
ber of years to receive the NSC or a National Certificate (Vocational) I, II or III, after
which they can continue further schooling/training at universities or intermediate voca-
tional education at technical colleges, community colleges or private college (UNESCO=UN-
EVOC, 2014).
Those who do not sit the NSC after grade 10-12, have alternative routes to further educa-
tion, for instance, they may sit the International General Certificate of Secondary Education
(IGCSE) offered by Cambridge Assessment International Education (CAIE) or the American
General Education test (both are very expensive and thus inaccessible to most) or attain a
qualification registered on the NQF, for example, National Certificate: Bookkeeping (Grade
10, NQF, L3), National Certificate: Information Technology: End User Computing (MICT
SETA, Grade 10 NGF L3), Further Education Certificate: Project Management (Services SETA,
Grade 11 NQF L 4), etc. These certificate courses are offered at most TVET colleges.
Adult basic education and training takes place in community and training (CET) colleges or
community colleges; as well as in technical vocational education and training (TVET) col-
leges. CET colleges provide both basic and further education and training qualifications or
part qualifications such as the National Senior Certificate for adults, while TVET colleges
offer trade and occupational qualifications or part qualifications.
Partnerships between the government, business, labour unions and communities are crit-
ical to the functioning of TVET institutions. Credible standards are ensured by the Occupa-
tional Qualifications sub-framework of the NQF, UMALUSI and the Quality Council for
Trades and Occupations (QCTO) (UNESCO=UNEVOC, 2014).
The TVET sector in South Africa is facing an increased focus, similar to global trends. The
DHET aims to increase TVET enrolments from 800 000 to three million by 2030 (Ferreira
and Featherston, 2017) and has established the SETAs to coordinate skills development
across sectors (Ferreira and Featherston, 2017) but these have been dysfunctional and in-
efficient in utilising funds according to industry participants (Ferreira and Featherston,
2017).
There are 50 TVET public institutions in South Africa (8 in Gauteng province and 6 in the
Western Cape province (TVET Colleges South Africa, 2020). The government steers TVET
through policy development, formulation of the national curriculum, staff development,
student and programme targeting; and funding. Private TVET institutions are governed by
their Director Generals but are required to have the necessary infrastructure and resources
for quality assurance. The programmes are registered and governed by the DHET. The pri-
vate TVET market is growing at 21%, although it is highly fragmented (Ferreira and Feath-
erston, 2017).
28You can also read