Sports versus Esports - A Comparison of Industry Size, Viewer Friendliness, and Game Competitiveness
←
→
Page content transcription
If your browser does not render page correctly, please read the page content below
Sports versus Esports – A Comparison of Industry Size,
        Viewer Friendliness, and Game Competitiveness

 William Campbell, Amanda Goss, Kyle Trottier and Mark Claypool
                              Worcester Polytechnic Institute
                               Worcester, MA 01609, USA

Introduction
Traditional sports, such as Taekwondo, handball, cricket, and soccer, are popular and well-
understood around the world. Over the last couple decades, a new phenomenon is emerging:
electronic sports, or esports, which could redefine the meaning of the word “sport.” Esports
are the professionaal, competitive play of computer games for a spectator audience. Esports
are growing in popularity, with both increased participation and increased viewership in
recent years and will likely have many of the same societal and cultural impacts as do
traditional sports.
       The goal of this chapter is to analyze esports along three important axes: industry size
(revenue, salaries/prizes, viewers), viewer friendliness (game complexity, broadcast action)
and game competitiveness (based on team points during a game). Researching the size of
the esports industry allows for observation of potential economic impact. Examining the
viewer friendliness of esports can help better understand the appeal to spectators. Analysis
of game competitiveness can show potential engagement by audiences. We analyze esports
by comparing them to traditional sports in order to provide for a relatively well-understood
frame of reference. That said, some of our comparative analysis of sports leagues is novel,
too.
       In order to compare the industry sizes of the professional sports and esports, we
gathered data on revenue, player salaries, team sizes, viewership, and growth in viewers
over time, concentrating on the North American sports and esports industries. To com-
pare viewer friendliness, we designed and deployed surveys assessing complexity and viewer
friendliness of a sport or esport and combined that with data gathered on viewer friendliness,
including gameplay per broadcast, and rule complexity. To compare game competitiveness,
we analyzed how often a team leads in a game and the likelihood of relinquishing a lead
at various stages in the game. In all cases, analysis of the data is primarily in the form of
visual aids (e.g., graphs and timelines) to compare and visualize the data collected.
       Overall, sports are larger than esports in terms of industry size, with the exception
of prize pools for tournaments where esports are comparable. However, esports are on par
with Major League Soccer in terms of industry size. Sports have the two events with the
most number of viewers by far – the FIFA World Cup and the NFL Super Bowl – but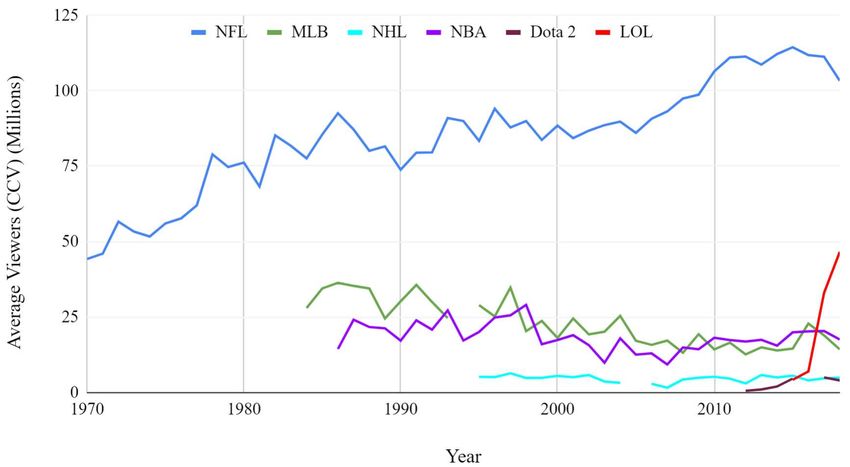
SPORTS VERSUS ESPORTS                                                                   2

esports have the third most – the League of Legends World Championships – which itself
is far larger than any other esports event in terms of viewers.
       Esports are somewhat more complex and somewhat less understandable to viewers
than sports based on rule complexity and game action, but esports broadcasts are more
viewer-friendly than sports broadcasts since the former are shorter (about 1-2 hours com-
pared to 2-3 hours) and have a large percentage of broadcast time showing live gameplay
(about 50%).
       Esports tend to be more competitive than sports since for much of their game time,
the outcomes of esports are not known and/or the team that is leading can change several
times during a match. In contrast, the least competitive sports (based on our metrics of
lead changes) – the NBA basketball and MLB baseball – have the leading team win over
two-thirds of the time, compared to about only one-third for esports.
       The rest of this chapter is organized as follows: the Background section provides
relevant information on the professional sports and esports analyzed in this chapter; the
Industry section compares industry sizes for sports and esports; the Viewer Friendliness
section analyzes aspects of sports and esports rules and broadcasting that suggest general
appeal to viewers; the Game Competitiveness section compares the competitiveness of sports
to esports; and the Conclusions section summarizes our findings.

Background
Table 1 summarizes the professional sports and esports analyzed and compared in this
chapter.

                                        Table 1
                Professional Sports and Esports Analyzed and Compared
Acronym    Name                               Primary Region    Sport/Genre
  EPL      English Premier League             Global            Soccer
 MLB       Major League Baseball              NA                Baseball
 MLS       Major League Soccer                NA                Soccer
 NBA       National Basketball Association    NA                Basketball
  NFL      National Football League           NA                Football
 NHL       National Hockey League             NA                Hockey
CS:GO      Counter Strike: Global Offensive   Global            First Person Shooter
DOTA2      Defense of the Ancients 2          Global            Multi-player Online Battle Arena
 LCS       League Championship Series         Global            Multi-player Online Battle Arena
 OWL       Overwatch League                   Global            Hero Shooter

      For representative sports, we analyzed major professional sports in North America
(NA): the National Football League (NFL), the National Hockey League (NHL), the Na-
tional Basketball Association (NBA), Major League Baseball (MLB), and Major League
Soccer (MLS), with the English Premier League (EPL) added for an international compar-
ison (based in the UK, but with global following).
      For comparative esports, we primarily analyzed two major professional esports: the
SPORTS VERSUS ESPORTS 3
League of Legends Championship Series (LCS) and the Overwatch League (OWL). The LCS
is a professional esports league founded in 2013 featuring the multi-player online battle
arena (MOBA) game League of Legends (LoL) (Riot Games, 2009). The LCS has the
highest level of professional LoL play in North America. The OWL is a professional esports
league founded in 2017 featuring the hero shooter Overwatch (Blizzard Entertainment,
2016). In addition, we include some analysis of professional tournaments featuring the first
person shooter (FPS) game Counter Strike Global Offensive (CS:GO) (Valve Corporation,
2012) and Defense of the Ancients 2 (Valve Corporation, 2013) where data is available and
comparisons are appropriate.
...
Content removed for this chapter excerpt. For full version, see: Global Esports
- Transformation of Cultural Perceptions of Competitive Gaming, Bloomsbury
Academic, ISBN 9781501368769, London, England, UK, March 11, 2021.
...
Industry
This section compares industry sizes for sports and esports, with data analyzed for revenue,
salaries, prize pools and viewership.
Revenue
The amount of money an industry makes is typically the metric by which industry sizes
are measured. As revenue reporting often lags a given calendar year, we gathered data
for sports and esports organizations for the year 2017. Data was obtained primarily from
Forbes (Brown, 2017),1 Statista (Statista, 2018),2 and NewZoo (Pannekeet, 2018).3 While
individual sports leagues often report yearly revenue, esports leagues do not and only an
aggregate esports revenue for 2018 was available.
Figure 1 compares the most recently available sports and esports revenues. The x-
axis is the sport or esport (with corresponding year) and the y-axis the revenue in billions
of U.S. dollars. From the graph, sports occupy the highest and lowest spots, the NFL at
$13.6 and the MLS at $0.6 billion, respectively. Even aggregated, esports are relatively low
compared with sports, only just above the MLS at $0.9 billion.
Salaries
Player salaries are often correlated with revenue, are an indication of how attractive and
viable a player’s career is, and can help attract the top talent. We gathered salary data
from Spotrac (Spotrac, 2019)4 and Forbes (Heitner, 2018).
1
Forbes is a global media company, focusing on business, investing, technology, and entrepreneurship.
2
Statista aggregates consumer survey results and industry studies from about 22k sources on about 60k
topics on the Internet.
3
Newzoo provides market research on games and esports analytics.
4
See: sport/rankings/average where sport is one of: {eps, mlb, mls, nba, nfl, nhl}SPORTS VERSUS ESPORTS 4
Figure 1 . League Revenue for Sports (blue) versus Esports (hashed red).
Figure 2 . Average Player Salary for Sports (blue) versus Esports (hashed red).
Figure 2 compares the average sports and esports salaries for 2018. The x-axis is
the sport or esport and the y-axis the average salary in millions of U.S. dollars. From the
graph, most sports have higher average salaries than esports, with the average NBA salary
of $7.2 million being 25x more than the average LCS salary. However, the average salaries
in the sports league MLS is on-par with the average salaries in the LCS and OWL esports
leagues.
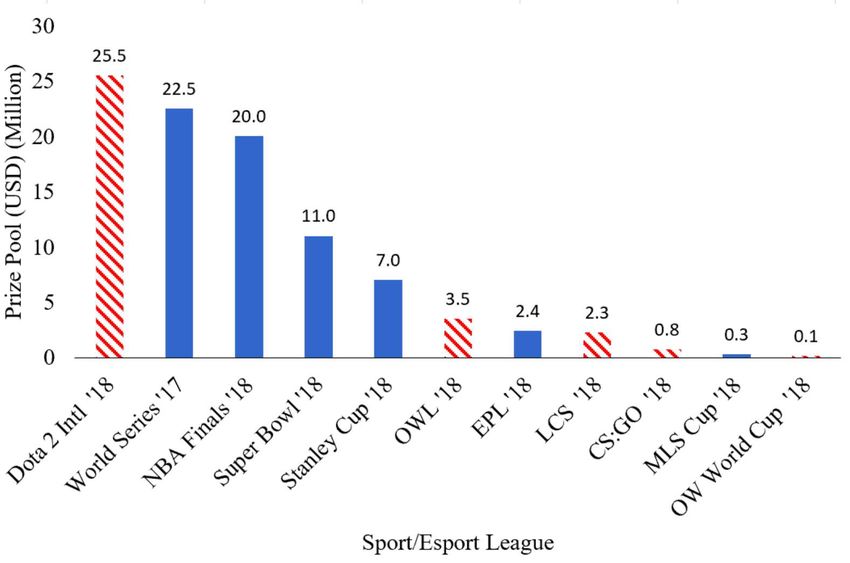
Prize Pools
Another monetary measure of industry size is the amount of money in prize pools and similar
awards in major sports and esports tournaments. In such cases, teams that win receive large
payments, often dividing this up among the players. Data from Esports Earnings (E$portsSPORTS VERSUS ESPORTS 5
Figure 3 . Championship Prize Pools for Sports (blue) versus Esports (hashed red).
Earning, 2019) provided data on the tournament prize pools and CNBC-Money (Martin,
2018) provided data on player winnings for the major sporting championships.
Figure 3 compares the prize pools for championship events for sports and esports
salaries for 2018. The x-axis is the sport or esport and the y-axis the prize pool in millions
of U.S. dollars. MLB has the World Series (note, data is from 2017), the NFL has the
Super Bowl, and the NHL has the Stanley Cup. From the graph, while sports occupy 4 of
the largest 5 spots, the largest prize pool is for the esport DOTA 2, at $25.5 million. The
esport OWL has prize pools greater than the EPL and MLS, too.
Viewers
The number of viewers of a sports or esports events usually directly affects league revenue
through advertising and indirectly impacts player salaries. Figure 4 shows the average
viewers for the championship event for each sport or esport. The x-axis is the sport or
esport event and the y-axis the average concurrent viewers (CCV) in millions. Note, the
y-axis is shown in logscale.
From the graph, the number of viewers of the FIFA (international soccer) World
5
Cup dwarfs all other events, except for the NFL Superbowl which had over 1 million
concurrent viewers. For other championship events, sports generally has more viewers,
with the exception of the LCS Worlds championship and the MLS Cup. Note,the EPL does
not have a final Championship event but rather plays simultaneous games on the last day
of play.
Figure 5 shows the change in viewers over time (since 1970) for some of the sports and
esports championships. The x-axis is years, and the y-axis the average concurrent viewers
(CCV) in millions. The FIFA World Cup is not included since it is only once every 4 years.
The OWL is not included because at the time data was gathered for this chapter there has
been only one season. The MLB and NHL have small gaps in their timelines due to strikes
5
Data from 2014 is shown since data from 2018 was not available. The tournament is every 4 years.SPORTS VERSUS ESPORTS 6
Figure 4 . Average Concurrent Viewers for Championship Events for Sports (blue) versus
Esports (hashed red). Note, y-axis in logscale.
when the season or championship was canceled. In the case of DOTA 2, the 2016 year had
no viewership data reported that corresponded to concurrent viewership.
From the graph, while the NFL championship (i.e., the Super Bowl) still dominates
in terms of viewer numbers, esports, specifically League of Legends (LoL) and Defense of
the Ancients 2 (DOTA 2), have viewerships comparable to other professional sports with
LoL having a sharp upward trajectory.
Summary
Overall, sports still generally dominate esports in terms of revenue and viewers, but esports
has significant presence in both, and some esports have larger prize pools than sports.
Sports dwarf esports in terms of revenue, with the NFL alone making $12.7 billion
USD more than the entire esports industry. Player salaries show a similar difference, with
the largest sports salary around $7 million USD, while the largest esports salary is only $0.3
million USD. However, some esports have larger prize pools than sports. The 2018 DOTA
2 International tournament had a prize pool of $25.5 million USD, larger than the largest
sport prize pool (the MLB World Series) of $22.5 million USD.
The largest two events with the most viewers are for sports – the FIFA World Cup
and the NFL Super Bowl have 562 and 103 million viewers, respectively. An esport event
is third in this list, however – the LCS World Championships at 43 million viewers – and is
more than double the number of viewers that any of the other sports leagues.SPORTS VERSUS ESPORTS 7
Figure 5 . Average Concurrent Viewers for Championship Events over Time.
Viewer Friendliness
A core element of professional sports and esports is the audience. In essence, the appeal to
viewers is what makes sports and esports professionally viable. While aficionados can be be
found for almost all sports and even most computer games, a sport or esport needs broad
viewer appeal for industry growth. This section analyzes the main aspects of sports and
esports that suggest general appeal to viewers – game complexity and broadcast action.
...
Content removed for this chapter excerpt. For full version, see: Global Esports
- Transformation of Cultural Perceptions of Competitive Gaming, Bloomsbury
Academic, ISBN 9781501368769, London, England, UK, March 11, 2021.
...
Figure 6 provides combined analysis, showing the percentage of action per broadcast
on the y-axis versus the broadcast length. The average for sport and esport is depicted
as a dot (blue for the sports, red for the esports). Generally, areas in the top left (high
action percent, relatively short broadcasts) are likely more viewer friendly than areas in
bottom right (low action percent, relatively long broadcasts). From the graph, MLB and
NFL broadcasts stand out as long (about 3 hours) and with relatively low percentages of
action (under 10%). Based on this broadcast analysis alone, Esports tend to be more viewer
friendly with higher percentages of action and lower broadcast lengths.SPORTS VERSUS ESPORTS 8
Figure 6 . Action per Broadcast versus Broadcast Length.
Summary
In summary, for viewer friendliness, esports are somewhat more complex than sports, ev-
idenced by: 1) the League of Legends rules being at a college reading level compared to
football’s early high school level, and 2) survey results that show the LCS League of Legends
and the OWL Overwatch viewers find their games 1-2 points (out of 7) more complex and
less understandable than the NFL football and the MLB, respectively. However, esports
broadcasts (LCS and OWL) are more viewer friendly than sports broadcasts given that the
former have about 40-45% of the time showing live gameplay, while broadcasts for NFL
football and MLB baseball only have 10-20% time with live gameplay.
Game Competitiveness
For viewers, the competitiveness of a game is important to its appeal. When the outcome
of a game is known early on, it can be less interesting to watch than one where the outcome
is uncertain for longer. A non-competitive game may cause fans to lose interest and stop
watching the the game early, instead finding another activity to do. This section applies
metrics that have been applied to assess the competitiveness of sports to esports, allowing
for a head-to-head comparison.
...
Content removed for this chapter excerpt. For full version, see: Global Esports
- Transformation of Cultural Perceptions of Competitive Gaming, Bloomsbury
Academic, ISBN 9781501368769, London, England, UK, March 11, 2021.
...SPORTS VERSUS ESPORTS 9
Figure 7 . Percentage of Game Time with Lead for Good versus with Lead and Win
(Sports blue, Esports red).
The final graph in Figure 7 compares the summary percentage of game time with the
lead for good against the percentage of game time where the team in the lead goes on to win.
The graph is augmented with explanatory arrows indicating leagues that are closer to the
upper-right corner are relatively less competitive while those closer to the lower-left corner
are relatively more competitive. Results from these two metrics indicate that games in the
NBA basketball and the MLB baseball leagues are relatively less competitive while those
in the MLS soccer and the EPL soccer leagues are relatively more competitive. These same
metrics show esports OWL Overwatch is as competitive as the most competitive sports,
MLS and EPL, while the esports LCS League of Legends is slightly more competitive than
all.
Summary
In summary, based on games with teams in the lead, the OWL Overwatch and the NBA
basetball leagues are the least competitive while the LCS League of Legends, MLS soccer
and EPL soccer leagues are the most. Based on the amount of time a team in the lead
wins, the NBA is still the least competitive, while the OWL and LCS leagues are the
most competitive. For leagues with teams ahead for good, the MLB baseball league is the
least competitive (the NBA is second), while the OWL and LCS leagues remain the most
competitive. Overall, esports are somewhat more competitive than most sports.SPORTS VERSUS ESPORTS 10
Conclusion
Sports are prevalent and pervasive, not only as a hobby for leisure and fitness, but also
as a profession. Professional sports employ highly paid professional athletes, competing
in yearly leagues and championships events, fueled largely by the massive audiences that
are interested in watching. The relatively more recent esports – multiplayer computer
games played competitively by professionals – have a lot in common with traditional sports,
providing a platform for professional players and millions of viewers. Analyzing esports with
sports as a reference can help better understand the size of the industry, and hence economic
impact, as well as the scope of appeal to viewers.
This chapter provides a comparison of sports to esports for professional sports leagues
and major esports leagues along three key dimensions: industry size, viewer friendliness,
and game competitiveness. We compare industry sizes through player salaries, tournament
prize pools and audience sizes. We assess viewer friendliness through rule analysis and
a 50+ person survey that subjectively measures viewer understanding. We analyze game
competitiveness by applying and comparing a competition metric from sports to esports.
For industry size, sports are considerably larger than esports, with the National Foot-
ball League (NFL) having about 15x more revenue and the National Basketball Association
having about 20x higher player salaries than the largest esports. However, the largest tour-
nament prize pool is for the esport DOTA 2 (in 2018), being about 15% larger than the
largest sports tournament prize (the Major League Baseball World Series in 2017). For
viewers, sports’ championship FIFA World Cup and the NFL Super Bowl dwarf all oth-
ers for viewers, but the esport League of Legends World championship has about 3x more
viewers than any other sporting event.
For viewer friendliness, esport’s League of Legends is slightly more complex than foot-
ball, although both have a comparable number of roles, positions and special cases. Viewers
subjectively indicated the same, with esports League Challenger Series (LCS) and Over-
watch League (OWL) being about 20% more complex and one-third less understandable
than baseball and football, respectively. However, the LCS and OWL broadcasts are more
viewer friendly, being somewhat shorter than all sports broadcasts and having a comparable
amount of action per broadcast as the top sports (hockey and soccer).
For competitiveness, esports are more competitive than all sports considering point-
based metrics that account for team leads over the course of a game. The outcome of the
LCS and OWL games are typically not known until well past the half-way point and both
feature many more lead changes than the least competitive sports (baseball and football).
Overall, professional sports are still larger than the biggest esports, generally com-
manding larger revenues, player salaries and viewers. However, esports viewer numbers are
growing, potentially fueled by appealing aspects of broadcast lengths and game competi-
tiveness, that will likely continue to drive industry growth and social impact.
References
Bago, J. (2015, January 29). eSports Now Recognized as 2nd Level Olympic Sport. In-
quirier.net.
Biderman, D. (2010, January 15). 11 Minutes of Action. The Wall street Journal.SPORTS VERSUS ESPORTS 11
Brand, S. (1972, December 7). Spacewar - Fanatic Life and Symbolic Death among the
Computer Bums. Rolling Stone Magazine(123).
Brown, M. (2017, August 25). Exclusive Infographics Show NFL, MLB, NBA and NHL
Sponsorship Growth Over Last Decade. Forbes.
Campbell, W., Goss, A., & Trottier, K. (2019, May). Sports vs Esports: A Compari-
son Study of Industry Size, Viewer Friendliness, and Competitiveness. Interactive
Qualifying Project IQP-MLC-SS18 . ((Advisor Mark Claypool))
Carpenter, L. (2017, February 6). Simply, the best super bowl ever. The Guardian.
Dick’s Pro Tips. (2019). Football Positions for Beginners. Online: https://
protips.dickssportinggoods.com/sports-and-activities/football/
football-101-football-positions-and-their-roles. (Accessed June 2019)
(editor), A. K. (1982). Player’s Guide to Electronic Science Fiction Games. Electronic
Games, 1 (2), 35 – 45.
E$ports Earning. (2019). Prize Money, Results, History, Satistics. Online: https://
www.esportsearnings.com/. (Accessed June 2019)
Fantastic eSports. (2018, April 26). Esports History from Beginning to 2018.
Online: https://fantasticesports.com/esports-history-from-beginning-to
-2018/. (Accessed June 2019)
Gagnon, B. (2017, February 6). Super bowl li was the best ever. Bleacher Reprot.
Heitner, D. (2018, May 2). A Look Inside Riot Games, from $320,000 Player Salaries to
Using Esports as a Catalyst for Sales. Forbes.
Jin, D. Y. (2010). Korea’s Online Gaming Empire. The MIT Press.
Lawrence, H. (2018, April 4). A Primer on Esports and its Growing History. Online:
https://gameanalytics.com/blog/esports-primer.html. (Accessed June 2019)
LeJacq, Y. (2013, July 19). Score! Professional Video Gamers Awarded Athletic Visas.
NBC Tech News.
LoL Esports. (2018, September 2). NA LCS Summer Split VODs. [Video file]: https://www
.youtube.com/playlist?list=PLPZ7h6L6LC7VDHdkxvfUADBLelPfU9T0m. (Accessed
June 2019)
Martin, E. (2018, February 3). Super Bowl Champs Will Win Thousands - but They’d
Earn 130 Percent More If They Played Basebal. CNBC - Money.
Moyer, S. (2013, July 16). In America’s Pastime, Baseball Players Pass a Lot of Time. The
Wall street Journal.
National Football League. (2018). Table of Foul Codes. Online: https://operations
.nfl.com/the-rules/2018-nfl-rulebook/#table-of-foul-codes. (Accessed June
2019)
Overwatch League. (2018, October 4). Full Matches | Inaugural Season. [Video
file]: https://www.youtube.com/playlist?list=PLwnBEhITAFhhJPLEj-XcJBAgM
_yMaQpKs. (Accessed June 2019)
Pannekeet, J. (2018, February 21). Global Esports Economy Will Reach $905.6 Million in
2018 as Brand Investment Grows by 48%. Forbes.
Premier league. (2018, August). Encyclopedia Britannica.
Pyne, S. (2019). A Short History of the MLS. Online: https://mlsgb.com/a-short
-history-of-mls/. (Accessed June 2019)SPORTS VERSUS ESPORTS 12
Reiss, S. A. (2017). Professional Team Sports in the United States. Oxford Research
Encyclopedias. (DOI: 10.1093/acrefore/9780199329175.013.198)
Riot Games. (2019a). Game Info - Champions. Online: https://na.leagueoflegends
.com/en/game-info/champions/. (Accessed June 2019)
Riot Games. (2019b). Welcome to League of Legends. Online: https://na
.leagueoflegends.com/en/featured/new-player-guide. (Accessed June 2019)
Riot Games. (2019c). Who to Play - Roles. Online: https://tinyurl.com/na
-leagueoflegends-com-roles. (Accessed June 2019)
Roger Goodell. (2018). Official Playing Rules of the National Football
League. Online: https://operations.nfl.com/media/3277/2018-nfl-rulebook
_final-version.pdf. (Accessed June 2019)
Rules of Sport.com. (2016). American Football Rules. Online: http://www.rulesofsport
.com/sports/american-football.html. (Accessed June 2019)
Salaga, S., & Tainsky, S. (2015, July). Betting Lines And College Football Television
Ratings. Economics Letters, 132 , 112–116.
Sport. (2019). The Oxford English Dictionary. [Retrieved from]: http://www
.oxforddictionaries.com/definition/english/sport. (Accessed June 2019)
Spotrac. (2019). Spotrac.com: Sports Contracts, Salaries, Caps, Bonuses, & Transactions.
Online: https://www.spotrac.com/. (Accessed February 2019)
Statista. (2018). eSports Market Worldwide. Online: https://tinyurl.com/y5g9b6qw.
(Accessed June 2019)
Steele, D. (2017, February 6). Seeing is believing: Patriots’ comeback made for best super
bowl ever. Sporting News.
Tassi, P. (2013, July 14). The U.S. Now Recognizes eSports Players as Professional Athletes.
Forbes.
Taylor, T. (2012). Raising the Stakes: E-Sports and the Professionalization of Computer
Gaming. The MIT Press.
This Day in History. (2019, Updated on June 7). National League of Baseball
is Founded. Online: https://www.history.com/this-day-in-history/national
-league-of-baseball-is-founded. (Accessed June 2019)
Wills, C. (2017, July). The Competitiveness of Games in Professional Sports Leagues.
Journal of Sports Analytics, 3 (2), 103–117. (doi:10.3233/JSA-160122)
World cup. (2018, August). Encyclopedia Britannica.You can also read


