SRCC Data Maps - Online User Guide - Saco River Corridor ...
←
→
Page content transcription
If your browser does not render page correctly, please read the page content below

SRCC Data Maps - Online User Guide
           The Saco River Corridor Commission (SRCC) was established in 1973 by state legislation to regulate land and water uses, protect and conserve
           the region’s unique and exceptional natural resources, and prevent the detrimental impacts of incompatible development. From 1973 to 2018,
           research of development projects within the Saco River Corridor required physically traveling to the SRCC office in Cornish, Maine to view the
           1970-vintage hardcopy maps. There is now an alternative to traveling by accessing the maps online:
           https://srcc.maps.arcgis.com/apps/webappviewer/index.html?id=dca6fa639dbd4a29a24da4835f4aace6. Using this multi-layered online map-
           viewer now offers desktop and mobile-device access to all the SRCC maps and more for residents, developers and town officials. Please note
           that due to rivers migration and data vintage can create slight inexact overlays.

           This mapping product is for informational purposes and was not prepared for or suitable for legal, engineering, or surveying purposes. It does not
           represent an on-the-ground survey and represents only the approximate relative location of property boundaries. The Saco River Corridor
           Commission makes no guarantee concerning the completeness or accuracy of the content. Assessing lot-by-lot accuracy of these maps is the
           responsibility of the user.

                                                            Search
Zoom
Control                                                                                                  Web Links                 Legend

                                               Print file
                                                                                                                                                                Add
 Full                                                                                                                                                           Data
 Extent                                Draw Tool
                                                                                                                                            Layer
                   Bookmarks                                                                                                                Control
                             Measure
          Base maps

                                                                 Layer Table Data

                                                                                                                                                Page 1 of 4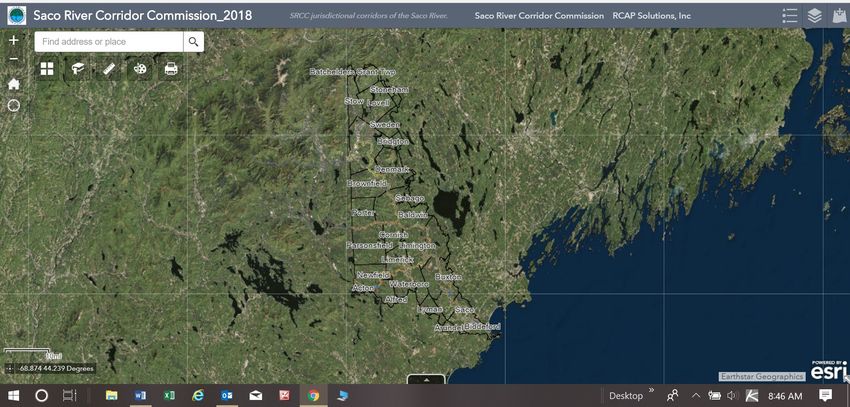
SRCC Data Maps - Online User Guide
SRCC, in coordination with RCAP Solutions-Maine (http://www.rcapsolutions.org/maine/) and using Environmental Systems
Research Institute (ERSI) ArcMap, have created a geographic information system (GIS). Many map layers were obtained from
various state and federal sources (https://www1.maine.gov/geolib/catalog/index.shtml). Important of these layers include:

       •   Parcels (2015)                            (https://www1.maine.gov/geolib/catalog/index.shtml)
            •   Only digital parcels that towns have uploaded to Maine geo-library are shown. Currently there are six towns without digital parcels (Brownfield, Cornish,
                Newfield, Parsonsfield, Porter and Waterboro). Contact RCAP Solutions to discuss the options to create digital parcel maps. Parcel maps have been scanned
                and geo-positioned on the desktop software but due to storage and costs these were not uploaded to the online version.
       •   Streams, Ponds                            (https://www1.maine.gov/geolib/catalog/index.shtml)
       •   Town Boundaries                           (https://www1.maine.gov/geolib/catalog/index.shtml)
       •   Roads                                     (https://www1.maine.gov/geolib/catalog/index.shtml)
       •   Conservation Lands(2018)                  (https://www1.maine.gov/geolib/catalog/index.shtml)
       •   FEMA Flood Maps                           (https://msc.fema.gov/portal/advanceSearch)
            •   Zone A     Areas with a 1% annual chance of flooding (also known as the "100-year floodplain") and a 26% chance of flooding over the life of a 30‐year
                mortgage. Because detailed analyses are not performed for such areas; no depths or base flood elevations are shown within these zones.

            •   Zone AE      Areas that have a 1% probability of flooding every year and where predicted flood water elevations above mean sea level have been established.
                Properties in Zone AE are considered at high risk of flooding under the National Flood Insurance Program

            •   Zone AO River or stream flood hazard areas, and areas with a 1% or greater chance of shallow flooding each year, usually in the form of sheet flow, with an
                average depth ranging from 1 to 3 feet. These areas have a 26% chance of flooding over the life of a 30‐year mortgage. Average flood depths derived from
                detailed analyses are shown within these zones

            •   Zone VE      Coastal areas with a 1% or greater chance of flooding and an additional hazard associated with storm waves. These areas have a 26% chance of
                flooding over the life of a 30‐year mortgage. Base flood elevations derived from detailed analyses are shown at selected intervals within these zones.

Layers that were constructed by RCAP Solutions with the guidance of SRCC are:
      • Water Quality Sample sites
      • SRCC 500 foot and 1000 foot jurisdictional boundaries
           o Using the Maine Geolibrary river data, 500ft and 1000ft radii were created off the Saco and major tributaries.
           o All property within the 500ft radius of the mapped rivers is under SRCC jurisdiction
           o Any property beyond the 500ft radius but within the FEMA floodplain and within the 1000ft river radius is under
              SRCC jurisdiction
      • Development District categories

                                                                                                                                                             Page 2 of 4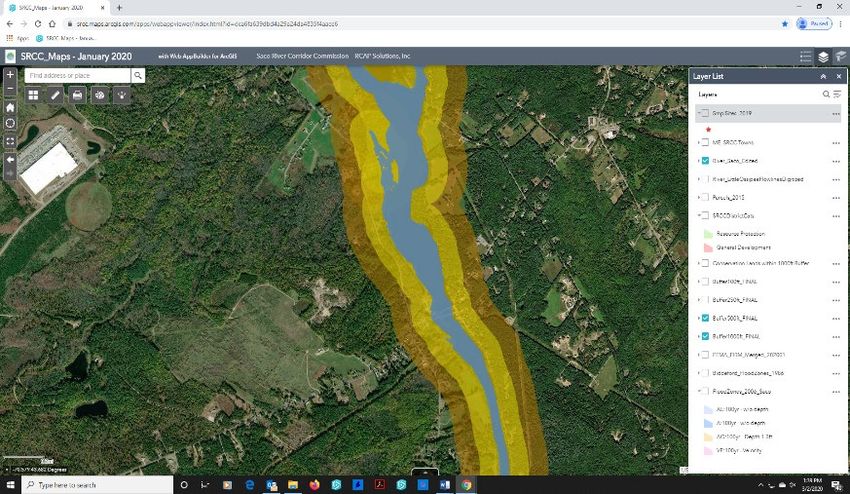
SRCC Data Maps - Online User Guide
• GIS layers were hand digitized using SRCC scans of each town’s Development Districts maps. Where towns had
digital parcels, parcel lines were sometimes followed. Where there were not digital parcels, river boundaries on State
River layer were followed. For both, the 500ft layer boundary for the interior boundary was followed and carried to
the 1000ft outer boundary following FEMA outlines.
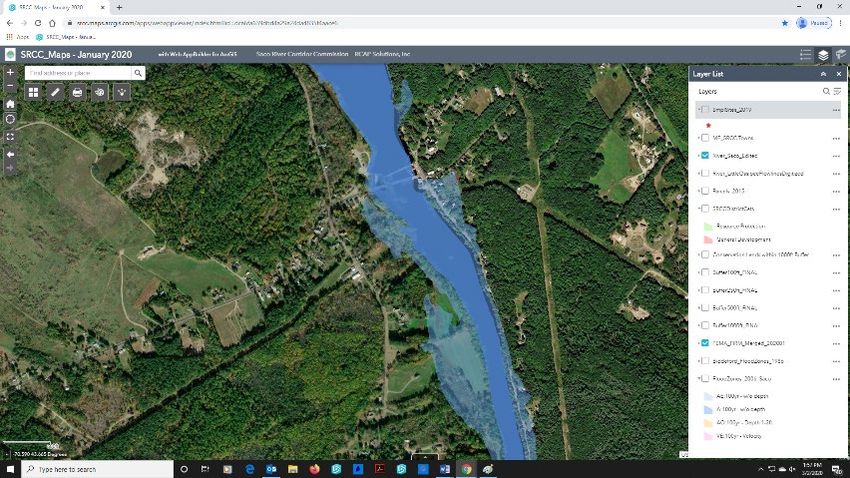
Figure 1: Basic Example showing "checked" layer list. User can choose what layer to see by checking each layer.
Page 3 of 4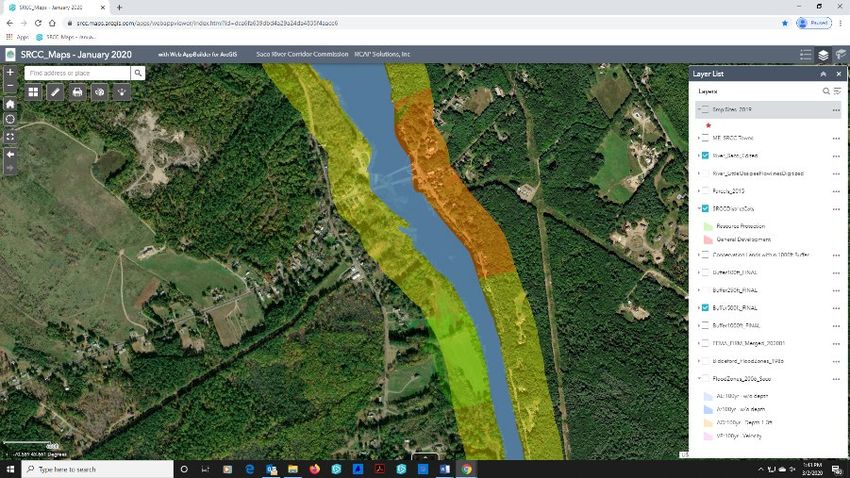
SRCC Data Maps - Online User Guide
The following screen shots are examples of Using the Layer List – turning on/off layers. If the layer is on, when zooming into a
location, layers and associated information will appear automatically. Also, legend colors may be slightly different on the map when
overlaying several different colored layers.

  Figure 2: SRCC 500ft and 1000ft river buffer                     Figure 3: Development Districts

 Figure 4: FEMA FIRM Layer                                          Figure 5: Showing all important layers: River
                                                                    buffers, Development Districts, FEMA, Parcels

                                                                                                                         Page 4 of 4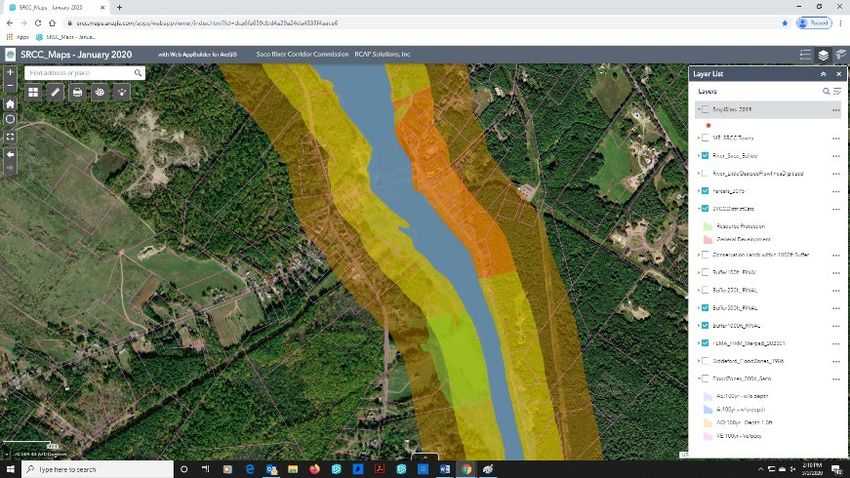
You can also read