Working Group 1&3 Interim Report for AKAC 2021 - 2021.08.26 Chair of WG 1&3 Mr. Hosni Belhadj, CETIME, Tunisia - JICA
←
→
Page content transcription
If your browser does not render page correctly, please read the page content below
Working Group 1&3

Interim Report for AKAC 2021.

              2021.08.26
           Chair of WG 1&3
  Mr. Hosni Belhadj, CETIME, Tunisia
Schedule of WG 1&3 in the half of the year 2021
Date Ageda Outcome
19/01/21 2nd Meeting to share the current situations focusing Shared data and information
on the certification system
16/02/21 3rd Meeting to share the current situations focusing Shared data and information
on KPIs
17/02/21- Implementing 3rd assignment
16/03/21 Reviewing the findings reported in the previous
2 meetings (2nd and 3rd)
Identifying the difficulties/existing problem to
set up the certification system and to apply
common KPIs in each country
Brainstorm the way forward
17/03/21 4th Meeting to discuss findings and challenges Consensus
specified in the previous 2 meeting and discuss the
20/04/2021 5way forward
th Meeting by inviting
to deepen the experts
the discussion in the
of common Idea to move forward was shared and agreed,
designated
KPIs, area
focusing on the current situation about KPI in while the current status of KPIs in each country
each country is shared.
25/05/2021 6th Meeting to discuss the methodology to express 4 methodology was suggested and 2 among the
the Kaizen effect by financial figures four was selected.
17/06/2021 7th and 8th Meeting to discuss the format to express The formats to express Kaizen effect by financial
And Kaizen effect by financial figures figures was explained and agreed.
03/08/2021Theme (WG) 1: Certification System 1. We have summarized the current status of Certification system in each country by making the chart and waiting for the several rest countries will reply. 2. Regarding the certification system, after the summarization, we need to decide the pilot country to be assisted for setting up the certification system by the scheme of JICA survey. 3. Based on the pilot activities in the selected pilot country, we will decide the contents of the “guideline” for AUDA-NEPAD. 4. However, it might be still difficult to start the pilot activities soon because of COVID-19. Maybe from autumn? Therefore, we agreed that we will concentrate more on the discussion about KPI for the time being.
Expected Monitoring system of Common KPIs by JICA survery team
In Companies In Countries Transcontinental
Actor Kaizen consultants of each country Kaizen promotion organization AUDA-NEPAD officers
officers of each country
Content of ・ Labor productivity (person-hours) in Aggregates the raw data for the Aggregates the data in a format that is easy
collected data model area five indicators at left and Kaizen to use for AUDA-NEPAD advocacy such as
・ Defective rate rates for each by sector by sector, by regional economic
・ Yield rate communities (RECS), by SDG theme, etc.
・ On-time delivery rate
・ Waste reduction volume
・ Monetary amounts directly linked to Aggregates the data at left by
enhancing added value that can be sector
converted into monetary value
Frequency Sequentially after completion of each Once every six months Once every year (discussions necessary in
company’s Kaizen implementation (discussions necessary in the same the same span)
span)
Method Transition from submission of Excel files through individual emails to submission via a simple data base using G-Suite
Recording/ After compiling the Kaizen results sheets, Aggregates and edits the Excel Aggregates and edits the Excel forms used
reporting format enters data into Excel files for reporting (or forms used for the reporting at for each country’s reporting
into the database after its creation). left ⇒ Aggregates and edits through the
⇒Aggregates and edits through database after its creation
the database after its creation
Feedback Includes Kaizen results sheet in company Creates annual Kaizen reports Creates the African Kaizen White Paper
method reports
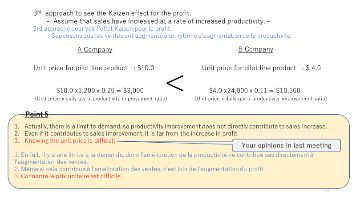
4Theme (WG) 3: Common KPIs
-How to express the Kaizen effect by financial figure-
Approach 1
Approach 2
Productivity Improved ratio
WAGE Rate
x Cover Ratio x GP
Approach 3 Approach 4
Productivity Improved ratio x GP/M-H
Unit Price
5
It’s difficult to obtain required unit price There are factors other than Kaizen effectFormat to calculate automatically into the Kaizen effect by financial figure
Company Information Pilot implementation of the format
Country
Name
Republic of Tunisia
CODE
33 in the 3rd quarter
Company AAA company 33-00001
Sector code Manufacturing 1
KPI & Sub Indicator list
Manufacturing Subsector Code Electronics 16
Service Subscetor Code Service Subscetor Code Code
Item Difinition
name Code Sector Code Subsector Code
Minumum Wage/Hour legal minimum wage 100 TND
Country Republic of Tunisia 33
Company AAA company 33-00001 1 16
3,934.00 JPY
Basic Condition
Pilot Line coverge ratio Gross profit base or Sales base 30%
Yearly Gross Profit last year actual 1,000,000 TND
Category Item Figure
Field Item Difinition Condition Before Kaizen Condition After Kaizen Improvement ratio Output/Input Units
Output Qty',Number of Customer,CS,Sales etc. 800 1,200 Daily
KPI A-1 Financial Improvement by Kaizen 472,080 JPY
Key Indicators
Input (M-H) Man-Hour(M-H) 200 180 Daily KPI A-2 Financial Improvement by Kaizen 7,868,000 JPY
of Pilot Line Productivity(Output/M-H) 4.000 6.667 66.7% Improvement ratio
(Number of defect product/ Productivity Improvemen(per M-H) 66.7%
Defect(%)
Products Quantity)
5.50% 1.40% -74.55%
Key Indicator of Pilot Line
Defect ratio improvement 74.5%
Productivity improvement(per Sapce) 60.0%
Used Space 300 250 -50
Lead time Reduction-1(F-in to F-out) 56.3%
2
M
Space-Productivity 2.67 4.00 133.3%
Sub indicaor
Lead time Reduction-2(L-in to L-out) 50.0%
Time unit
of Pilot Line
Sub indicaor Lead Time(Factory-in to Factory-out) Second,Minite,Hour,Day 7,200 2,880 60% PLS INPUT
WIP Reduction
of Pilot Line Lead Time(Line-in to Line-out) Second,Minite,Hour,Day 80 35 56% PLS INPUT
WIP(Qty') The average number in the line 100 50 50%
OEE improvement 22.1%
7200 OEE AvilabilityxPerformance xQuality 68.00% 83.00% 22.06% Inventry Reduction 54.0%
Inventory (from B/S)
Yearly Net Sales
Inventory Amount in B/S
Net sales
500,000
2,000,000
230,000
2,000,000
Company -wise Return Ratio 72.9%
Inventory Turnover(D/S) 91.3 42.0 54.0%
Sub indicators Employee Satisfaction 44.4%
Company -wise
Sub indicators
Return ratio(%) The number of return product/shipped Qty' 8.50% 2.30% 72.94%
ES score(point) 45 65 44.4% Incident(safety) 80.0%
Yearly Incident The number of insident in work site 10 2 80%
GEMBA KPI Financial effect of KaizenYou can also read