State of Nevada Governor's Office of Energy - 2020 Status of Energy Report
←
→
Page content transcription
If your browser does not render page correctly, please read the page content below
State of Nevada
Governor’s Office of Energy

                 2020
                 Status of
                 Energy
                 Report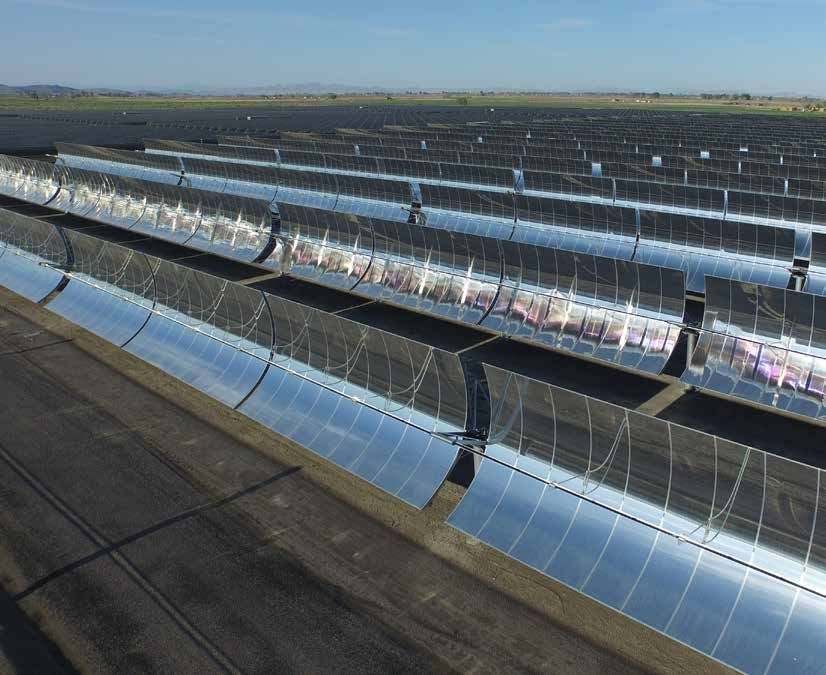
Governor’s Office of Energy
Steve Sisolak, Governor
David Bobzien, Director
600 E. William Street, Suite 200
Carson City, Nevada 89701
Tel: (775) 687-7180

                                                           Table of Contents
                                                           Table of Contents 		                        ............................... 2
                                                           About the Governor’s Office of Energy       ............................... 3
                                                           Energy in Nevada
                                                                  Electric Energy Consumption          ............................... 4
                                                                  Electric Energy Generation Portfolio              .................. 5
                                                                  Nevada’s Climate Action		            ............................... 6
                                                                  Energy Usage by Sector		             ............................. 12
                                                                  Renewable Portfolio Standard         ............................. 13
                                                                  Renewable Generation Portfolio       ............................. 14
                                                                  Utilities & Energy Service Providers ............................. 16
                                                                  Electricity Markets                  ............................. 19
                                                                  2020 Energy Policy Updates		         ............................. 20
                                                           Governor’s Office of Energy - Programs
                                                                  Nevada Electric Highway		            ............................. 23
                                                                  Renewable Energy Tax Abatement ............................. 25
                                                                  Renewable Energy Fund 		             ............................. 26
                                                                  Nevada Clean Energy Fund             ............................. 27
                                                                  Property Assessed Clean Energy       ............................. 28
                                                                  Home Energy Retrofit Opportunities for Seniors .... 29
                                                                  Performance Contract Audit Assistance Program .... 30
                                                                  International Energy Conservation Code ................ 31
                                                                  Green Building Tax Abatement         ............................. 32
                                                                  Lower Income Solar Energy Program                 ................ 33
                                                                  Partnerships & Projects Funded       ............................. 34

Cover Photo: Nevada Electric Highway ribbon cutting at Mesquite, NV, January 29, 2020. In the photo from left to right, Doug Cannon
(CEO NV Energy), Kristina Swallow (NDOT Director), David Bobzien (GOE Director), NV Gov. Steve Sisolak, Mendis Cooper (CEO
Overton Power District, and Mark Yardly (Owner of the Eagles Landing Travel Plaza in Mesquite) (Source: GOE)
Background Photo: Spring Valley Wind (Source: GOE)

                                                                              2
Governor’s Office of Energy: Mission
The mission of the Governor’s Office of Energy (GOE) is to ensure the wise development of Nevada’s
energy resources in harmony with local economic needs and to position Nevada to lead the nation
in renewable energy production, energy conservation, the exportation of energy and transportation
electrification. The Governor’s Office of Energy implements the laws of the state as defined in the Nevada
Revised Statute, Chapters 701 and 701A; manages energy-related programs; facilitates cooperation
between key stakeholders; advises the Governor on energy policy; and collaborates with our local,
regional, and federal partners to ensure a reliable and sustainable energy system.

       State Fiscal Year 2020 - Revenues                                     State Fiscal Year 2020 - Expenditures
                            SFY 2020 - Revenues                                                   SFY 2020 - Expenditures

                                                                                                                    Project Funding
                                                                                                                     Partnerships
                                                                                                                          10%
           VW Settlement
               27%
                                                                                        Electric Hwy
                                                                                            44%

                                                                                                                                      Personnel

     Program Fees
                            ~$4.7M                                                                     ~$3.5M                           25%

          3%

                                                      RETA
            SEP - Award                                59%
               11%
                                                                                                                             HEROS
                                                                                                 SEP - Activities             13%
                                                                                                       1%

                                                                                                       Admin. & Operating
                                                                                                              7%

                    Figure 1 - Governor’s Office of Energy                                Figure 2 - Governor’s Office of Energy
                             Revenue (SFY 2020)                                                 Expenditures (SFY 2020)

Revenues:
 • Renewable Energy Tax Abatements (RETA) - Income from renewable projects built before 2013; 55% taxes are abated, other 45% are
   paid, and those are split 45%-55% between the Governor’s Office of Energy and the County respectively.
 • U.S. DOE State Energy Program (SEP) Formula Grant Award - Annual source of income from federal government.
 • Program Fees - Fees generated from the Green Building Tax Abatement (GBTA) and RETA programs (application and compliance fees)
 • VW Settlement - Funds that are from the Volkswagen settlement governed by the Nevada Beneficiary Mitigation Plan, managed by the
   Department of Conservation and Natural Resources.

Expenditures:
 • Personnel - Staff salaries, fringe benefits and travel.
 • Home Energy Retrofit Opportunity for Seniors (HEROS) - Funds spent that went directly towards energy efficiency projects.
 • Administration & Operating - Building utilities, rent, etc.
 • U.S. DOE SEP Activities - Grants issued for renewable energy, energy efficiency or transportation electrification projects, or on staff time
   in support of projects.
 • Electric Hwy - Funds that are spend on the Nevada Electric Highway program.
 • Project Funding Partnerships - Grants issued for renewable energy, energy efficiency or transportation electrification projects.

Funding Note:
 • The difference in revenue to expenditures of $1.2M was due to multiple staff vacancies as well as the effects of the COVID-19 pandemic
   which resulted in a hold on expenditures.

                                                                      3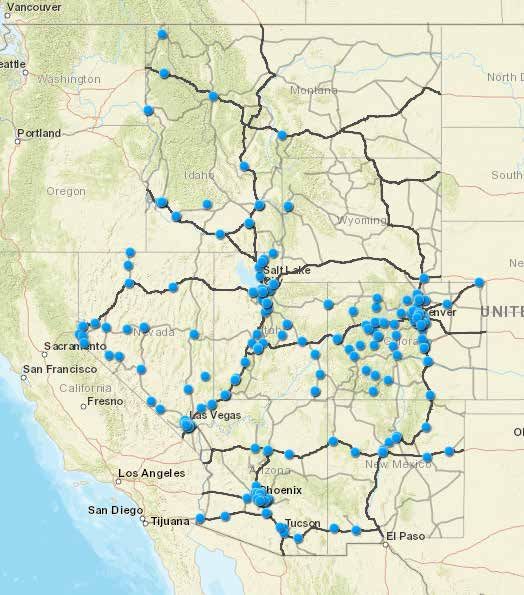
2019 Nevada Electric Energy Consumption
      Energy in         Electric energy consumption in Nevada consists of customers of the major
                        providers listed below. NV Energy (Sierra Pacific Power Co. and Nevada Power
      Nevada            Co.) provides 88 percent of the state’s electrical power; 6 percent by electric
                        cooperatives; and the remainder by businesses, general improvement districts,
                        municipal utilities, and others. While some of the service areas of several power
                        providers extend into neighboring states, the electric energy consumption
estimates presented in the table below are for Nevada only. The chart below represents only bundled
service.

Investor Owned 		                                                       28,700,861 MWh       Colorado River Commission of Nevada EIA Adjustment
                                                                                                             1.91%                   0.37%
  Nevada Power Co. (Bundled)[1]                                         19,505,109                    Political Subdivision
  Sierra Pacific Power Co.(Bundled)[1]                                   9,195,752                            1.48%
                                                                                                                                              Behind the Meter
                                                                                                 Municipal                                         0.80%
                                                                                                   0.76%
Cooperatives			                                                           1,986,702                                                            Western Area Power Administration
  Harney Electric Coop, Inc.[1]                                             101,324                                                                          0.08%
                                                                                                                                   Cooperative
  Mt. Wheeler Power, Inc.[1]                                                548,837                                                  6.12%
  Plumas-Sierra Rural Elec. Coop[1]                                           4,580
  Raft Rural Elec. Coop Inc.[1]                                              50,426
  Surprise Valley Electrification[1]                                            118
  Valley Electric Assn., Inc.[1]                                            544,892
  Wells Rural Electric Co.[1]                                               736,525

Political Subdivision                                                        479,528
  Aha Macav Power Service[1]                                                  23,041
                                                                                             Investor Owned
  Overton Power District No. 5[1]                                            397,504             88.48%
  Lincoln County Power District No. 1[2]                                      45,241
  Alamo Power District No. 3[2]                                               13,742

Municipal		                                                                  245,052
 Boulder City[1]                                                             151,086
 City of Fallon[2]                                                            87,171
 City of Pioche[2]                                                             6,795

Colorado River Comm. of NV (Bundled)[1]                                     618,564
Western Area Power Administration[1]                                         26,812
                                                                                                  Figure 3 - Electric Energy Consumption by Provider
Behind the Meter                                                             259,595
  Greenbacker Renewable Energy Corp.[1]                                          360
  Greenskies Renewable Energy, LLC.[1]                                         7,847          Energy Only Providers                                               9,597,554
  SolarCity Corporation[1]                                                   125,106            Nevada Power Co. (Delivered)                                      2,612,572
  Spruce Finance[1]                                                            1,021            Sierra Pacific Power Co. (Delivered)                              1,713,132
  SunEdison LLC[1]                                                               273            Exelon Generation Company[1]                                        146,018
  Sunnova[1]                                                                  23,176            Macquarie Energy LLC                                                 53,618
  SunPower Capital, LLC[1]                                                     7,888            Morgan Stanley Capital Grp. Inc.                                    690,050
  Sunrun Inc.[1]                                                              67,529            Shell Energy North America (US), L.P.                             1,601,569
  Vivint Solar, Inc.[1]                                                       26,395            Silver State Energy Association[1]                                  969,534
                                                                                                Tenaska Power Services Co.[1]                                     1,570,053
EIA Net Bundled Adjustment                                                   120,482            Colorado River Comm. of Nevada (Delivered)[1]                       664,433
                                                                                                Colorado River Comm. of Nevada                                       21,922
Total 2019 Nevada Bundled                                            32,437,596
                                                                                              EIA Energy Only Adjustment[1]                                         -507,974
  Source: U.S. Energy Information Administration (EIA) 2019 Form 861 (Utility Sales)
[1]

  Source: EIA 2019 Form 891 (Short Form)
[2]                                                                                           Total 2019 Nevada Delivered (MWh)                                 9,089,580
                                                                                         4
Nevada’s Electric Energy Generation Portfolio
                                                                                                                        Petroleum
As shown in Figure 4, Nevada uses several sources to generate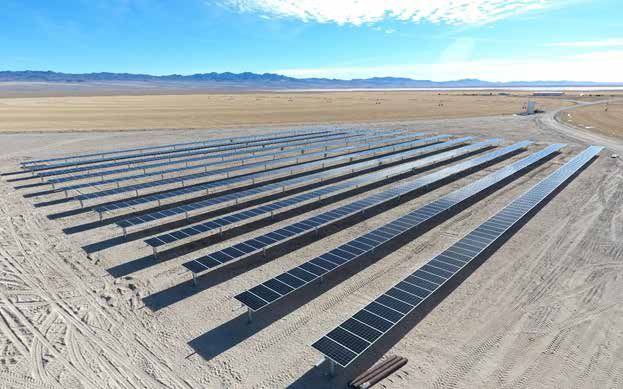
Nevada’s Climate Action
      Energy in                                          Background and Emissions Status

      Nevada            Climate change refers to the changes happening to our planet. Changes include
                        rising sea levels; shrinking glaciers; accelerating ice melt in polar regions; and
                        shifts in flower/plant blooming times. These changes are all consequences of the
                        warming, which is caused mainly by the burning of fossil fuels and releasing
heat-trapped gases into the air.                                  [1]

These impacts from climate change are seen statewide. Las Vegas has been identified as the fastest-
warming city in the United States with an increase in temperature of 5.76 degrees since the 1970’s. With                                                                        [2]

this increase in temperature comes an expected increase in heatwaves, and heat-related deaths stressing
the productivity of the Southern Nevada economy. A report from the Union of Concerned Scientists
warns that absent global action to reduce carbon emissions, Las Vegas will likely experience 96 days of
heat above 100F by the end of the century, including 60 days of temperatures above 105F and seven “off
the chart” days, i.e. those that would break the current heat index. The Reno-Tahoe region is also feeling                 [3]

the impacts of climate change, with rising temperatures in Reno and ecological impacts to Lake Tahoe.                                                                                  [4]

                                 Nevada Statewide Greenhouse Gas Inventory and Projections, 1990 to 2039
                                48                                                                                                                2005 Net Emissions
                                44                                                                           Projections

                                40

                                36
                                                                                                                                            2025 Goal, 28% Reduction
                                32
      GHG Emissions (MMTCO2e)

                                28

                                24                                                                                                                               2030 Goal, 45% Reduction

                                20

                                16

                                12

                                 8

                                 4

                                 0

                                 -4

                                 -8

                                -12

                                      Transportation                                Electricity Generation                                    Industry
                                      Residential and Commercial                    Waste                                                     Agriculture
                                      Land Use, Land Use Change, and Forestry       Net Emissions                                             2025 Projections
                                      2030 Projections                              Projections
 Figure 7 - This chart from the Nevada Division of Environmental Protection’s green-house gas inventory, depicts projected reductions
 in greenhouse gas emissions under current policies and the size and status of the reported sectors. Absent innovative and robust poli-
              cies, current predictions by Nevada’s air regulators conclude Nevada will not meet its carbon reduction goals.
                                                           (Source: https://ndep.nv.gov/uploads/air-pollutants-docs/ghg_report_2020.pdf).
[1]
   Source: NASA: https://climate.nasa.gov/faq/12/whats-the-difference-between-climate-change-and-global-warming/
[2]
   Source: Climate Central Research: https://assets.climatecentral.org/pdfs/April2019_Report_EarthDay.pdf?pdf=AmericanWarming-Report
[3]
   Source: Union of Concerned Scientists: https://www.ucsusa.org/resources/killer-heat-united-states-0#ucs-report-downloads
[4]
   Source: Reno Gazette Journal: https://www.rgj.com/story/life/outdoors/2017/08/10/how-climate-change-harms-lake-tahoe-and-how-stop/558083001/

                                                                                                  6
Nevada’s Climate Action
Additionally, these effects have disproportionate impacts on Nevada’s most
vulnerable communities: communities of color, low-income communities and
                                                                                                                                                          Energy in
indigenous populations. In major cities, including Nevada’s major urban areas,
low-income neighborhoods are likely hotter than more affluent areas, subjecting
                                                                                                                                                            Nevada
these at-risk populations to even greater climate change impacts.                                                      [1]

In 2019, Nevada’s action to reduce carbon emissions economy-wide included:
 • Joining the U.S. Climate Alliance in March of 2019 ;                                        [2]

 • Passing Senate Bill 254 (2019) ;                       [3]

 • Governor Sisolak’s signing Executive Order 2019-22 (EO) ; and                                               [4]

 • Completion of a greenhouse gas inventory with identification of policy options for further emission
   reductions.           [5]

In 2020, as directed in Governor Sisolak’s Executive Order 2019-22, Nevada produced its first-ever
comprehensive State Climate Strategy (“Climate Strategy”) and issued its 2020 Supplemental Report        [6]

to its Nevada Statewide Greenhouse Gas Emissions Inventory and Projections, 1990-2040 (2020 GHG
Report). The Climate Strategy, discussed in the following pages, and 2020 GHG Report are available
online at https://climateaction.nv.gov/our-strategy/ and https://ndep.nv.gov/uploads/air-pollutants-docs/
ghg_report_2020.pdf.
                                                       Nevada Net GHG Emissions Comparison with
The 2020 GHG
Report, prepared in
                                                Nevada’s Emission Reduction Goals (MMTCO2e and Percent)
accordance with SB                                                                                                   2005                 2025                    2030
254, tallies current                        Net Emissions                                                            49.397              37.387                   36.063
and projected
emissions across                            Projected Emissions Reductions                                             -                  12.01                   13.334
multiple economic                           Projected Percent Reduction                                                -                  24%                     27%
sectors, including:
Transportation,
Electricity                                 SB 254 Emissions Goals                                                     -                 35.566                   27.168
Generation,                                 SB 254 Emissions Reductions                                                -                 13.831                   22.229
Industry, Residential                       SB 254 Percent Reduction                                                   -                   28%                     45%
and Commercial
                                            SB 254 Percent Deficit                                                     -                    4%                     18%
Construction, Waste,
Agriculture and Land                        Estimated Additional Emissions
                                                                                                                       -                 1.821                    8.895
Use, Land Use Change                        Reductions Required
and Forestry.                             (Above): This chart from the Nevada Division of Environmental Protection’s green-house gas inventory, p. ES-6.
                                          (Source: https://ndep.nv.gov/uploads/air-pollutants-docs/ghg_report_2020.pdf).

[1]
   Source: NPR: https://www.npr.org/2019/09/03/754044732/as-rising-heat-bakes-u-s-cities-the-poor-often-feel-it-most
[2]
   Source: U.S. Climate Alliance: http://www.usclimatealliance.org/publications/2019/3/12/nevada-governor-steve-sisolak-joins-us-climate-alliance?rq=nevada
[3]
   Source: Nevada Legislature: https://www.leg.state.nv.us/App/NELIS/REL/80th2019/Bill/6431/Text
[4]
   Source: Nevada Governor: https://gov.nv.gov/News/Executive_Orders/2019/Executive_Order_2019-22_Directing_Executive_Branch_to_Advance_Nevada_s_Climate_Goals/
[5]
   Source: NDEP: https://ndep.nv.gov/uploads/air-pollutants-docs/ghg_report_2019.pdf
[6]
   Source: Nevada Climate Initiative: https://climateaction.nv.gov/our-strategy/

                                                                                              7
Nevada’s Climate Action
 Energy in              The overwhelming majority of emissions cited in the 2020 GHG Report come
                        from the combustion of fossil fuels in energy-consuming sectors. These sectors,
 Nevada                 accounting for 92 percent of Nevada’s gross emissions, include transportation,
                        electricity generation, industry, and the residential and commercial sectors.
                        Currently, transportation is the largest source of emissions at 36 percent of
statewide totals and emissions from electricity generation constitute 30 percent of statewide emissions.
Addressing emissions will require ongoing collaboration between state agencies, local and tribal
governments, and businesses to develop and implement innovative policies, as outlined in the Climate
Strategy.

As policies supporting renewable energy development are implemented, electricity generation sector
emissions continue to fall from their 2005 levels. However, the transportation sector remains the largest
percentage of emissions and reducing these emissions will require innovative policies and a variety of
technologies in low to no carbon fuels across all mobile sources of emissions: highway vehicles, aircraft,
locomotive, and all manner of motorized non-road equipment and vehicles, including construction
equipment, farm
equipment,           Relative Contributions of Nevada’s Gross GHG Emission by Sector:
airport ground                                    2005, 2017, 2025, 2030
support
                    2005
equipment, and
recreational
vehicles.

Under current
policies and
science, Nevada
will fall short of its
GHG emissions-
reduction targets.

                     Figure 8 - This chart from the Nevada Division of Environmental Protection’s green-house gas inventory, p. ES-6.
                                          (Source: https://ndep.nv.gov/uploads/air-pollutants-docs/ghg_report_2020.pdf).

                                                                  8
Nevada’s Climate Action
 Nevada Climate Initiative and State Climate Strategy                                                                                 Energy in
 In spring of 2020, the Nevada Climate Initiative (NCI) was launched, building                                                          Nevada
 on 2019’s climate actions and resulting in the December 1, 2020 release of the
 Nevada State Climate Strategy (Climate Strategy). The Climate Strategy sets out
 three overarching goals: establish a GHG reduction framework for all economic sectors, set a climate
 adaptation and resilience foundation and establish a structure to allow ongoing climate action statewide.

 The Climate Strategy was developed through the coordination and strategic direction of the directors
 of the Department
 of Conservation and
 Natural Resources
 and the Governor’s
 Office of Energy, and
 collaboration across state
 agencies. It includes
 significant input from
 thousands of Nevadans
 through a climate survey,
 listening sessions on
 diverse topics, input
 gathered from subject-
 matter expert and
 stakeholder meetings
 and webinars. The NCI
 website includes not
 only the State Climate Strategy, but the recordings of all the listening sessions as well. It was highlighted                       [1]

 by the creation of interagency working groups, found under “Nevada’s Climate Governance” on the NCI
 website, that included representatives from the Department of Conservation and Natural Resources and
 the Governor’s Office of Energy, as well as:

      • the departments and offices of Transportation, Economic Development Agriculture, Administration,
        Motor Vehicles, Corrections, and State Historic Preservation;
      • UNLV, UNLV’s Boyd School of Law, Desert Research Institute, and UNR
      • the Divisions of Environmental Protection, Forestry and Natural Heritage, Outdoor Recreation,
        Administrative Services, Housing; and
      • the Public Utilities Commission.

 The strategy also recognizes the need for harmonization of local, regional, state and federal policies
 to ensure needed GHG reductions, including a framework for intergovernmental and interagency
 coordination, stakeholder and community engagement, executive leadership and staff, adaptive
 governance, science-based climate assessments, and dedicated resources.

  All the listening sessions have been archived and can be found at: https://climateaction.nv.gov/our-strategy/listening-sessions/
[1]

                                                                                                          9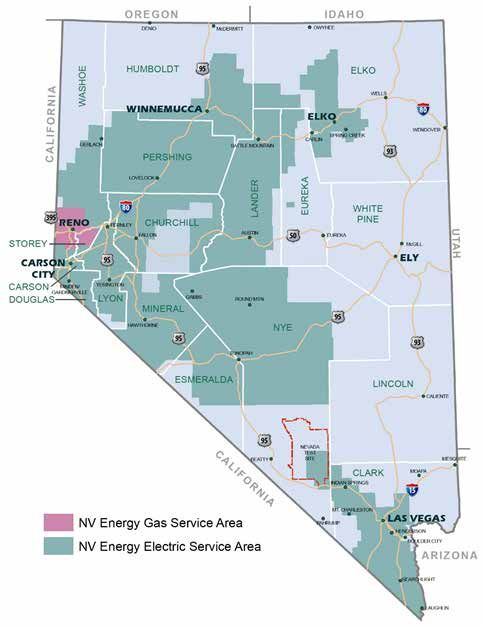
Nevada’s Climate Action
 Energy in                         Nevada Climate Initiative and State Climate Strategy
 Nevada                 The Climate Strategy evaluates policies and programs by emissions sector,
                        including: transportation, electricity, industry, residential & commercial
                        construction and land use and change. It offers policymakers opportunities to
reduce emissions in a framework that makes sense for Nevada, including a set of Climate Mitigation
Policy Evaluation metrics to assess each proposed policy’s effectiveness and benefits for all Nevadans. The
metrics include:
Executive Summary - Climate Action NV                                                           1/12/21, 9'57 AM
• GHG emission-reduction potential
• Climate justice considerations
• Budgetary and economic implications
    The policies and programs evaluated are organized by emissions sector.
• Implementation feasibility

                                                               Industry
              Transportation
                                                              Replace, capture, and recycle ozone-
              Adopt low- and zero-emissions                   depleting substance substitutes
              vehicle standards
              Implement clean truck program                    Residential & Commercial

              Adopt low-carbon fuel standards
                                                              Adopt appliance and equipment
              Implement state car allowance
                                                              efficiency standards
              rebate system (“Cash for Clunkers”)
                                                              Implement a statewide
              Close emissions inspection
                                                              benchmarking program
              loopholes for classic cars license
                                                              Require residential energy labeling
              plates
                                                              and energy audits
             Electricity                                      Adopt energy codes for net-zero
                                                              buildings
              Transition from fossil-fueled                   Expand the property-assessed clean
              electricity generation to clean energy          energy (PACE) program
              sources                                         Expand energy savings performance
              Require GHG reduction plans and                 contracting (ESPC)
              prioritize decarbonization in utility           Transition from residential and
              integrated resource plans (IRPs)                commercial use of gas
              Prioritize energy efficiency and
                                                               Land Use & Land Change
              demand response programs

                                                              Expand urban forestry programs

                                                         10
Nevada’s Climate Action
The Climate Strategy also provides opportunities for economic recovery and Energy in
diversification as Nevada works to rebuild after the COVID-19 pandemic. The
Climate Strategy itself is not a revenue-neutral proposition, but did find that Nevada
meeting Nevada’s emission reduction targets would prevent between $172
and $786 million in economic damages by 2030 and up to $4 billion by 2050.
According to the 2020 GHG Report, “Climate-conscious economic development efforts and investments
can spur the expansion of renewable energy, reduce emissions, build climate resilience, and expand the
use of sustainable resources, all while creating valuable new jobs and skilled workforces.” Additionally,
the Climate Strategy
“Climate-conscious economic development highlights that economic
efforts and investments can spur the expansion of diversification and development
renewable energy, reduce emissions, build climate opportunities exist in clean
energy technologies, energy
resilience, and expand the use of sustainable efficiency and green buildings,
resources, all while creating valuable new jobs and alternative transportation, grid
modernization and storage, and
skilled workforces.” - 2020 GHG Report water conservation technologies
and recycling.
The Climate Strategy concludes that mitigation-focused policies, programs, regulations and investment
would be needed for Nevada to realize its 2050 net-zero GHG emissions target, with work continuing for
this 2021 legislative session and beyond.
11Energy Usage by Sector
Energy in A majority of fossil fuels (jet fuel, gasoline, diesel fuel, aviation gas) are imported
into Nevada. Transitioning to domestically produced sources like renewables
Nevada can, among other benefits, offer cost savings to Nevadans powering their
homes, businesses and vehicles. In particular, the transportation sector accounts
for approximately one third of energy consumption and one half of energy
expenditures. Transitioning Nevada’s transportation infrastructure to electric
vehicles will lessen the state’s dependency on out-of-state resources and provide a fuel source that is not
vulnerable to pricing fluctuations or pipeline supply disruptions. The figures below show the energy
consumption and expenditures by sector in Nevada, as opposed to the previous charts on page 8 which
show GHG emissions.
Energy Consumption
Energy consumption is the amount of energy used in a process, organization, or society. The chart below
on the left shows the breakdown of energy consumption in Nevada by percentage. About 86 percent of
the fuel for energy that Nevada consumes comes from outside the state (Source: EIA Quick Facts on
Nevada).
Energy Expenditures
Energy expenditure is the amount of money used to purchase energy in order to power a process,
organization, or society. The chart below on the right shows the breakdown of energy expenditures in
Nevada by percentage. Almost half of all energy expenditures in Nevada is for transportation, which falls
Energy Consumption
into both byand
the fossil fuel category
ethanol, and certain blends).
End-Use
alternativeSector
fuel category (natural gas, electricity, propane, methanol,
Energy Expenditures by End-Use Sector
Residential
Residential 20%
24%
Transportation
31%
Transportation
52% Commercial
13%
Commercial
21%
Industrial
24% Industrial
15%
Figure 9 - Energy Consumption Figure 10 - Energy Expenditures
Source: EIA Nevada Energy Consumption & Source: EIA Nevada Energy Consumption &
Expenditures End-Use Sector 2018 Expenditures End-Use Sector 2018
12Renewable Portfolio Standard
Nevada’s Renewable Portfolio Standard (RPS), NRS 704.7801 was first adopted
by the Nevada Legislature in 1997 and most recently amended in 2019. The
Energy in
RPS establishes the percentage of electricity sold to Nevada retail customers by
providers of electric service, that must come from renewable sources.
Nevada
Qualifying renewable sources include biomass, geothermal energy, solar energy,
waterpower and wind. Specifically, providers of electric service are required to generate, acquire, or save
with portfolio energy systems utilizing renewable resources or energy efficiency measures to meet the
annual RPS percentage. It should be noted that the renewable energy generated in the state does not
directly translate to RPS compliance. This difference is due to the fact that RPS carry-forward credits and
credits from energy efficiency and conservation (through Demand Side Management [DSM]) are not
accounted for in the generation data.
50% by 2030
SB 358 (2019) increased the RPS requirement to 50% by 2030. The percentage of renewable energy
required by the RPS will increase every two years until it reaches 50% in 2030.
SB 358 tasked the Governor’s Office of Energy with receiving RPS compliance reports from electric
service providers subject to NRS 704.787[1]. These compliance reports are required to be submitted to the
Governor’s Office of Energy on or before July 1 of each year and must contain information delineated in
NRS 704.7825. Submitted reports can be found at: http://energy.nv.gov/Resources/Renewable_Portfolio_
Standard_Reporting/
NV Energy RPS Compliance
70% 70%
60% 60%
50% 50%
42.2% 41.2%
38.2% 39.1%
40% 40%
27.5% 28.2% 28.5%
30% 30%
24.0%
20% 20%
10% 10%
0% 0%
2014 2015 2016 2017 2018 2019 2020* 2021*
Renewable Generation Carry Forward Credits DSM Total RPS
Figure 11 - NV Energy RPS Compliance
Source: NV Energy annual RPS compliance reports (2014-2019)
Notes: Carry-forward credits include both DSM and Generation; 2020 & 2021 is forecasted based on NV Energy’s 2019 RPS compliance report.
[1]
All other defined providers of electric service submit compliance reports to the Public Utilities Commission of Nevada (PUCN). These reports can be found
as individual dockets for each provider on the PUCN’s website: http://puc.nv.gov
13Nevada’s Renewable Energy Portfolio
Biomass / Biogas / Landfill
Power Plant Name Capacity (MW)
1 Clark County Landfill Energy (DCO Energy LLC)* 12.0
2 Waste Management Lockwood LFGTE (WM Renewable Energy LLC) 3.2
Subtotal (Biomass) 15.2
Geothermal Waste Heat
Power Plant Name Capacity Power Plant Name Capacity
(MW) (MW)
3 Beowawe Power (Terra-Gen) 20.6 25 Goodsprings Waste Heat Recov- 7.5
4 Blue Mountain (NGP/AltaRock) 63.9 ery (Nevada Power Co.)
5 Brady Complex (Ormat)* 21.5 Subtotal (Waste Heat) 7.5
6 Dixie Valley (Terra-Gen) 70.9
7 Don A. Campbell (I & II) (Ormat)* 47.5
8 Jersey Valley (Ormat)* 23.5
9 McGinness Hills (I & II) (Ormat)* 100.0
10 Patua Phase 1A (Cyrq)* 48.0
11 Salt Wells (Enel)* 23.6
12 San Emidio (U.S. Geothermal) 11.8
13 Soda Lake No I II (Cyrq)* 21.0
14 Steamboat Complex (Ormat)* 58.2
15 Stillwater (Enel)* 47.2
16 Tungsten Mountain (Ormat)* 37.0
17 Tuscarora (Ormat)* 32.0
18 Wabuska (Homestretch) 5.4
19 Desert Peak Power (Ormat) 26.0
20 Richard Burdette (Ormat) 30.0
21 Galena II & III (Ormat) 43.5
22 McGinness Hills III (Ormat)* 74.0
23 Whitegrass (Open Mtn Energy) 6.4
Figure 12 - Renewable
24 Soda Lake III* (Cyrq)* 26.0 Project Map
Subtotal (Geothermal) 838.0
Hydroelectric
Power Plant Name Capacity (MW)
26 Fleish (Truckee Meadows Water Authority) 2.0
27 Hoover Dam (NV Allocation) 1,039.4
28 Lahontan (Truckee-Carson Irrigation District) 1.8
29 New Lahontan (Truckee-Carson Irrigation District) 4.0
30 Verdi (Truckee Meadows Water Authority) 2.4 Source: EIA 2019 Form
31 Washoe (Truckee Meadows Water Authority) 2.6 860. Schedule 3.
* Indicates participation in
Subtotal (Hydroelectric) 1,052.2 the RETA program.
14Nevada’s Renewable Energy Portfolio
Solar
Power Plant Name Capacity (MW)
Energy in
32 Apex Solar (Southern Power Co.)* 20.0 Nevada
33 Boulder Solar (Southern Power Co.)* 100.0
34 Boulder Solar II (AEP Renewables)* 50.0
35 Copper Mountain 1-4 (Sempra)* 560.6
36 Crescent Dunes (SolarReserve) [1]*
125.0
37 Ft. Churchill (Apple) 19.9
Out-of-state
38 IKEA Las Vegas (IKEA) 1.0 (35%)
In-state
39 Las Vegas WPCF (City of Las Vegas) 3.3 (65%)
40 Luning Energy (Algonquin Power Co.)* 50.0
41 Mandalay Bay (I & II) (MGM) 6.9
42 Moapa Southern Paiute (First Solar)* 250.0
43 Mountain View (NextEra)* 20.0
Figure 13 - Where the energy goes
44 Nellis Air Force Base (Solar Star NAFB)* 14.0
45 Nellis PV II (Nevada Power Co.)* 15.0 Over one-third of the nameplate
capacity of Nevada’s renewable
46 Nevada Solar One (Acciona Solar Power) [1] 75.7 projects have Power Purchase
47 Nevada Valley Solar Solutions II (VEA)* 15.0 Agreements (PPAs) out of the state.
48 Patua Geothermal (Cyrq)* 10.6
49 Playa Solar (Switch I & II) (EDF)* 179.0
50 River Mountains Solar (SNWA) 14.4
51 Searchlight Solar (Searchlight Solar)* 17.5
52 Silver State Solar North (Enbridge)* 52.0
53 Silver State Solar South (NextEra)* 250.0
Non-RETA: out-of-state
54 Spectrum Solar (Southern Power Co.)* 30.0 (11%)
55 Stillwater (Enel)* 22.0
56 Techren Solar (I & II) (Global Atlantic Fin. Co.)* 300.0
57 Western 102 (Barrick Goldstrike Mines) 1.0
RETA: in-state
58 Sunshine Valley Solar (First Solar)* 103.5 Non-RETA: in-state
(36%)
(29%)
59 Solar Las Vegas MB2 (Invenergy) 2.0
60 Tungsten Mountain (Ormat) 7.3
61 Dignity (2) (Dignity) 3.1 RETA: out-of-state
(24%)
62 Turquoise Liberty Solar (Turquoise Liberty)* 10.0
Subtotal (Solar) 2,357.3
Figure 14 - Renewable projects and
participation in the Renewable Energy
Net Metered Tax Abatement (RETA) Program
Subtotal (Net Metered, All Technologies, MW) 425 relating to in/out of state PPAs
Note: refer to page 24 for more
information on RETA.
Wind
Power Plant Name Capacity (MW)
63 Spring Valley Wind Project (Pattern) 150.0 Source: EIA 2019 Form 860. Schedule 3.
Subtotal (Wind) 150.0 Net Metered: EIA 2019 Form 861M.
Concentrated Solar Plant.
Total 4,845.2
[1]
* Indicates participation in the RETA
15 program.Nevada Rural Utility Service Areas
Energy in The Nevada Rural Electric Association (NREA) was founded in 1974 to represent
the collective interests of one municipal utility, six rural electric cooperatives and
Nevada two power districts and their consumers across Nevada. Five NREA members are
based in Nevada while four serve consumers in Nevada but have headquarters in
the adjacent states of Idaho, Utah, Oregon and California.
The NREA collaborates with national and regional affiliates and provides a forum within which rural
utilities communicate and work together to achieve mutually beneficial goals. NREA’s purpose is to
power communities with safe, reliable and affordable electricity, and empower consumers to improve the
quality of their lives.
NREA advocates for consumers with national and state legislators, agencies, local governments and like-
minded associations about the importance of the services our utility members provide. NREA utility
members also provide programs to educate the public and youth about public power and to promote
participation in the democratic process of local board elections.
NREA General Members
• Alamo Power District No.
3, Alamo, NV
• Harney Electric
Cooperative, Hines, OR
• Lincoln County Power
District No. 1, Pioche, NV
• Mount Wheeler Power, Ely,
NV
• Overton Power District #5,
Overton, NV
• Plumas-Sierra Rural
Electric Co-op, Portola, CA
• Raft River Rural Electric
Company, Malta, ID
• Wells Rural Electric
Company, Wells, NV
NREA Associate Members
• Boulder City Municipal
Utility, Boulder City, NV
• Deseret Power, South
Jordan, UT
• Surprise Valley
Electrification Corporation,
Alturas, CA
https://www.nrea.coop/
16Utilities & Energy Service Providers
Electric energy consumption in Nevada consists of customers of the state’s largest
investor-owned utility (NV Energy), rural electric cooperatives, municipal
Energy in
utilities, and general improvement districts.
Nevada
NV Energy has served citizens in
northern Nevada for more than
150 years, and southern Nevada
since 1906. Today, NV Energy
has a service area that covers
nearly 46,000 square miles
of one of the fastest growing
states in the U.S., including
the communities of Las Vegas,
Reno-Sparks, Henderson and
Elko. NV Energy provides a wide
range of energy services to 1.3
million customers throughout
the state and more than 50
million tourists annually. NV
Energy also provides natural gas
to more than 168,000 residents
in the Reno-Sparks area.
Nevada Power, Sierra Pacific
Power and Sierra Pacific
Resources merged in July 1999.
In 2008, the subsidiaries began
doing business as NV Energy.
NV Energy, headquartered
in Las Vegas, was acquired by Source: NV Energy
Berkshire Hathaway Energy in
2013.
17Valley Electric Association
Energy in Valley Electric Association, Inc. (VEA) is a member-owned electric cooperative
headquartered in Pahrump, which provides service to more than 45,000 people
Nevada within a 6,800-square-mile service area along the California-Nevada border.
VEA’s residential members are the co-op’s largest single consumer group.
VEA was the first non-California utility
to join the California Independent System
Operator (CAISO) in 2013.
Southwest Gas
Based in Las Vegas, Southwest Gas Corporation was
founded in 1931 and is a subsidiary of Southwest
Gas Holdings Inc. With more than 2,200 employees,
they serve more than 2 million customers located in
Arizona, California and Nevada.
18Electricity Markets
Serviced by the California Independent System Operator (CAISO), many utilities
in the West participate in a sub-hourly, real-time market, known as the Western
Energy in
Energy Imbalance Market (EIM), to balance supply and demand in five-minute
and fifteen-minute intervals. NV Energy was the second utility to join the EIM in
Nevada
2015 (following PacifiCorp in 2014).
The EIM footprint includes portions of British Columbia, Washington, Oregon, California, Nevada,
Arizona, Idaho, Utah, and Wyoming, and will be expanding to include Montana and New Mexico. Since
inception, the EIM has resulted in gross benefits of over
$800 million, with Nevada customers having seen a benefit
of $82 million. CAISO has initiated expansion of the EIM to
add an “Extended Day Ahead Market (EDAM),” that would
likely result in even more customer benefits.
As more and more western states and utilities pursue
higher renewable portfolio standards, carbon policies, and
aggressive climate goals, states need to work together to
keep costs down and maintain reliability for customers.
Nevada is currently engaged in electricity markets-related
planning on multiple fronts:
• Governor’s Office of Energy and other western states
energy advisors are working with the Center for the New
Energy Economy (CNEE) to facilitate a conversation
among governors for regional cooperation on electricity
issues such as transmission, resource adequacy, GHG
accounting, and clean energy standards. Known as the
Western Interconnection Regional Electricity Dialogue
(WIRED) Initiative, the Governor’s Office of Energy
Director serves as co-chair of the transmission work
group.
• Governor’s Office of Energy and the Public Utilities
Commission of Nevada represent Nevada, alongside ten
other western states, on the lead team for the State-Led
Market Options Study. Funded by the U.S. Department
of Energy, the goal of the study is to provide a neutral
forum and neutral analysis for Western states to independently and jointly evaluate options and
potential impacts associated with new or more centralized wholesale energy markets.
• Nevada participates in the Body of State Regulators (BOSR), a forum for state regulators to learn
about the EIM, EIM Governing Body and related Independent System Operator (ISO) developments
that may be relevant to their jurisdictional responsibilities. The Body may express a common position
in the ISO stakeholder process or to the EIM Governing Body on EIM issues; and its members are not
restricted from taking any position before the Federal Energy Regulatory Commission (FERC) or any
other forum concerning matters related to the EIM or the ISO.
192020 Nevada Energy Policy Updates
General Service Lamps
Energy in In August 2020, the Director of the Governor’s Office of Energy adopted
Nevada regulation R100-19 pursuant to NRS 701.260 as amended under AB 54 (2019).
Regulation R100-19 sets a minimum standard of energy efficiency of 45 lumens
per watt of electricity consumed that must be produced by General Service
Lamps sold in Nevada on and after January 1, 2021.
General Service Lamps refer to lighting applications traditionally served by incandescent lamps, also
known as “A-type” bulbs. The majority of lighting in a residence is covered under the new standard and
definitions.
Included in the new standard are:
• General Service Incandescent Lamps
• Compact Fluorescent Lamps
• General Service LED Lamps
• General Service Organic LED Lamps
• Reflector Lamps
These are the most commonly used lightbulbs, generally the
pear-shaped bulbs. Common applications are table side lamps
and light fixtures that are used daily.
“General service lamp” encompasses the list above, and is a lamp
that has a medium, candelabra or intermediate screw base; is
able to operate at a voltage of 12 volts or 24 volts, at or between
100 to 130 volts, at or between 220 to 240 volts, or of 277 volts for integrated lamps, or is able to operate
at any voltage for nonintegrated lamps; has an initial lumen output of greater than or equal to 310 lumens
(or 232 lumens for modified spectrum general service incandescent lamps) and less than or equal to
3,300 lumens; is not a light fixture; is not an LED downlight retrofit kit; and is used in general lighting
applications.
According to the Appliance Standards Awareness Project, Nevada is predicted to save an average of 788
gigawatt hours, $85 million on electricity bills compared to 2017, and 280 thousand metric tons of CO2
by 2025 with the adoption of general service lamps standards. This will save Nevadans an average of
$81.00 per household annually on their electricity bills. [1]
ACEEE Recognition
Each year, the Governor’s Office of Energy reports on energy efficiency improvements in the state to the
American Council for an Energy Efficient Economy (ACEEE) through an annual scorecard which ranks
and compares the efforts of each state. The ACEEE 2020 State Energy Efficiency Scorecard highlighted
Nevada’s efforts to strengthen building energy code adoption, increase appliance efficiency standards,
and the pursuit of low-emission vehicle and zero-emissions vehicle standards. Nevada was named as the
‘most improved’ state in 2020 due to these efforts, moving up five places on the scorecard compared to
the 2019 report. [2]
Appliance Standards Awareness Project: https://appliance-standards.org/sites/default/files/light_bulb_electricity_and_bill_savings_in_2025.pdf
[1]
ACEEE: https://www.aceee.org/research-report/u2011
[2]
202020 Nevada Energy Policy Updates
Clean Cars Nevada
Energy in
[1]
Governor Sisolak’s Executive Order 2019-22 directed the administration
to evaluate policies and regulatory strategies that will help Nevada meet the
greenhouse gas (GHG) emissions targets consistent with Senate Bill 254 (2019)
Nevada
and Nevada’s commitment to the Paris Accord through its membership in the
U.S. Climate Alliance. Transportation now represents the largest source of GHG
emissions in Nevada and innovative policies and programs will be needed to reduce the emissions from
this sector. In recognition of this challenge, Nevada’s Division of Environmental Protection, the state’s air
quality regulators, commenced a rulemaking process in June 2020 to assess adoption of low emission and
zero emission standards for light duty vehicles, more commonly known as LEV/ZEV standards.
The proposed regulation seeks to reduce GHG and other criteria pollutant emissions in light duty
vehicles by providing rules and standards, that generally mirror California’s emission standards, for the
fleets of vehicles sold annually by Nevada’s motor vehicle manufacturers starting in 2025.
• The proposed LEV standard would adopt rules requiring motor vehicle manufactures to deliver
vehicles for sale in the Nevada market that produce lower emissions of GHG and other harmful air
pollutants like nitrogen oxides (NOx), particulate matter (PM) and carbon monoxide (CO).
• The proposed ZEV standard would set minimum sales goals for electric vehicles as a percentage of all
vehicles available for sale in Nevada’s market.
Electric Vehicles in Nevada
Nevada continues to invest in electric vehicle charging infrastructure along with steady growth of all
electric vehicles entering into the market. While electric vehicles represent less than 1% of the total
vehicle registration in Nevada, the graph below shows a solid trend of growth in the electric vehicle
market while Nevada continues to invest in electric vehicle charging infrastructure.
EV Registrations in Nevada
9,296
10,000 10,000
9,000 9,000
8,000 8,000
7,000 7,000
6,000 6,000
5,000 5,000
4,000 4,000
3,000 3,000
2,000 2,000
1,000 1,000
- -
FY2009 FY2010 FY2011 FY2012 FY2013 FY2014 FY2015 FY2016 FY2017 FY2018 FY2019 FY2020
Figure 15 - Number of registered all electric vehicles in 21 Source: Nevada Division of Environmental Protection:
[1]
Nevada. (Source: Nevada DMV). https://ndep.nv.gov/air/clean-cars-nevada2020 Nevada Energy Policy Updates
REV West
Energy in Nevada, through the Governor’s Office of Energy, continues to play a leadership
Nevada role in the Regional Electric Vehicle Plan for the West (“REV West”) partnership
made up of eight intermountain west states including: Arizona, Colorado, Idaho,
Montana, Nevada, New Mexico, Utah, and Wyoming. The group, authorized
by the eight governors through a Memorandum of Understanding (MOU),
works to bring light-duty electric vehicle charging infrastructure to bear. Initiated in 2017, these eight
intermountain west governors re-committed to REV West by executing an updated December 2019
MOU.
In December 2020, the group released a progress report highlighting its work since the MOU’s launch:
• More than 100 DC fast-charging stations built by private and public sectors, with at least 75 additional
stations in the planning phase;
• Collectively engaged the Federal Highway Administration for federal support through the Alternative
Fuels Corridor program, leading to nearly 1,250 miles of designated electric charging corridors, and
more than 7,500 miles of “corridor pending” highways;
• Electric Vehicle Policy Baseline for the Intermountain States report released in October 2018;
• Voluntary Minimum Standards for DC fast-charging stations released in December 2019;
• Leveraged U.S. State Energy Program funds and other sources to enhance coordination between State
Energy Offices and transportation agencies on:
• Addressing regulatory barriers to station development and signage;
• Identifying infrastructure gaps;
• Developing DC fast-charging
station analysis maps for internal
planning;
• Exchanging model electric
vehicle programs and sharing
strategies for electric vehicle
program design;
• Obtained funding from the U.S.
Department of Energy under the
Corridors for the West (CORWest)
grant led by the Utah Clean Cities
Coalition, which identifies barriers to
electric vehicle adoption and supports
infrastructure deployment in rural
and remote areas, while engaging key
stakeholders and increasing public
awareness; and
• Enhanced state engagement with
electric service providers as partners
on infrastructure development.
Photo (Right): REV West Regional Planning
Map highlighting existing DCFC stations and
proximity to Interstate Highway corridors
as of December 2020. (Source: Utah
Department of Transportation).
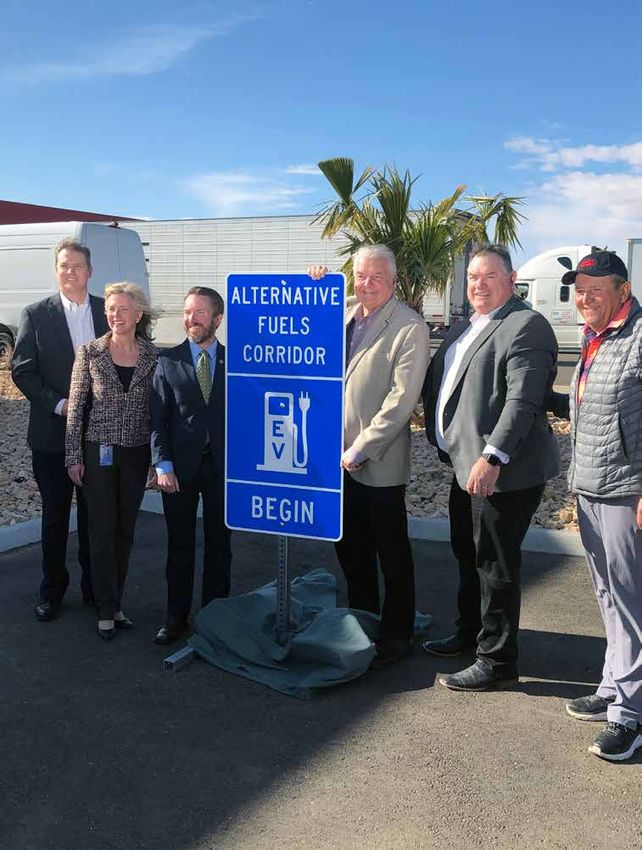
22Nevada Electric Highway
Governor’s
The Nevada Electric Highway (NEH) began as a partnership between the
Governor’s Office of Energy, NV Energy, and Valley Electric Association to Office of
expand the state’s electric vehicle charging infrastructure by placing charging Energy
stations at cost-effective and strategic locations, initially along U.S. 95 between
I-80 and Las Vegas. With the influx of the Volkswagen Mitigation Trust Programs
Settlement funds allocated to Nevada in 2018, the program grew to include
I-80, I-15, US-50, US-93, and additional locations on US-95. The program is a partnership with the
energy service providers in the state including, NV Energy, Valley Electric Association, Harney Electric
Cooperative, Raft Rural Electric Cooperative, Wells Rural Electric, Mt. Wheeler Power Co., Lincoln
County Power District No. 1 and Overton Power District No. 5.
In 2020, the NEH program races towards its anticipated finish. There are a few projects still in motion, all
of which are anticipated to be completed and operational by June 2021.
Completed/Active Projects
• Beatty (Feb. 2016)
• Fallon (Nov. 2016)
• Panaca (Sept. 2017)
• Hawthorne (May 2018)
• Tonopah (May 2019)
• Jean (Sept. 2019)
• Moapa (Oct. 2019)
• Mesquite (Oct. 2019)
• McDermitt (Jan. 2020) Photo (Above): NV Energy’s NEH project in
Luning NV. (Source: NV Energy).
• Alamo (Jan. 2020)
• Orovada (Feb. 2020)
• Ely (Mar. 2020)
• Amargosa Valley (Apr. 2020)
• Indian Springs (June 2020)
• Jackpot (July 2020)
• Austin (July 2020)
• Luning (Aug. 2020)
• Cold Springs (Aug. 2020)
• Schurz (Oct. 2020)
• West Wendover (Oct. 2020)
• Goldfield (Dec. 2020)
• Silver Springs (Est. Feb. 2021)
• Wells (Est. June 2021)
• Carlin (Est. June 2021)
• Baker (Est. June 2021)
• Eureka (Est. June 2021)
• Rye Patch (Est. June 2021)
• N. Las Vegas (Est. June 2021)
Photo (Above): Amargosa Valley NEH
• Trinity (pending)
charging station at the NDOT rest stop in
• Middlegate (pending) Lathrop Wells, NV. (Source: Valley Electric
Association).
23119°0'0"W 118°0'0"W 42°0'0"N 117°0'0"W 116°0'0"W 115°0'0"W
120°0'0"W
Raft River Rural Electric Cooperative
McDermitt Jackpot
30
65
120°0'0"W
Orovada
Humboldt
45
Pequop
Button Point
Valmy 58
Elko
41°0'0"N
45 #14 Wells 41°0'0"N 41°0'0"N
NV Energy
58 Wells Rural Electric Company
25
120°0'0"W 24
Washoe
#12 Carlin 79
Cosgrave
#08 Rye Patch State Park 46
44
Pershing Beowawe 60
#07 Lovelock
23
40°0'0"N #06 I-80 / US-95 Jct Eureka 40°0'0"N
Lander
Wadsworth Trinity Schellbourne
32 62
33
48
120°0'0"W 32 70
27 Churchill
Storey 40
37 FOX PEAK FALLON Austin #29 Eureka
#24 Silver Springs #25 Middlegate Cold 14
36Power
White Pine Mt. Wheeler
Springs
47
38 Bean Flat Eureka 25
Carson City Ely
69
39°0'0"N Lyon 36 39°0'0"N
Douglas
Schurz
35
34 NV Energy
Mineral Luning Pony Springs
Hawthorne Park Site9
Sunnyside
Luning
Hawthorne 90
Millers
119°0'0"W
71
82
38°0'0"N
Tonopah
38°0'0"N 27
Esmeralda
Nye
70
Lincoln PANACA - Y
Lincoln County Power District No. 1
#20 Goldfield
118°0'0"W
Crystal Springs
NV Energy
66
#01 Jean (Built Sept. 2019) Alamo
Valley Electric Association
#02 I-15 / U.S. 93 Jct. (Est. June 2021)
74
#06 I-80 / U.S. 95 Jct. (Est. June 2021)
#07 Lovelock (EA building) 37°0'0"N 37°0'0"N
#08 Rye Patch (Est. Feb. 2021) 37°0'0"N
Amargosa Valley
#17 Schurz (Built Oct. 2020) BEATTY STATION
117°0'0"W
#18a Luning (Est. Dec. 2020) 32
#20 Goldfield (Est. Dec. 2020) 30
#23 Indian Springs (Built June 2020) 28
Amargosa Valley Moapa
#24 Silver Springs (Est. Dec. 2020) 45 Overton Power District No. 5
Indian Springs
#25 Middlegate (Est. June 2021) 23
#26 Cold Springs (Built Aug. 2020) Overton Power District 32
#02 I-15 / US-93 Jct.
#27 Austin (Built July 2020) #03 Moapa (Built Oct. 2019) Clark
#04 Mesquite (Built Oct. 2019)
Harney Electric Cooperative 116°0'0"W
NV Energy
#34 McDermitt (Built Jan. 2020)
Wells Rural Electric Company 36°0'0"N
36°0'0"N
#39 Orovada (Built Feb. 2020) #12 Carlin (Est. June 2021) 26
#14 Wells (Est. June 2021)
Mt. Wheeler Power
#16 West Wendover (Built Feb. 2020) Jean
#29 Eureka (Est. June 2021)
Valley Electric Association
#31 Ely (Built Mar. 2020)
#33 Baker (Est. June 2021) #22 Amargosa Valley (Built April 2020)
65
115°0'0"W
Lincoln County Power District Raft River Rural Electric Cooperative
#35 Alamo (Built Dec. 2019) #38 Jackpot (Built July 2020) Sources: Esri, HERE, Garmin, USGS, Intermap, INCREMENT P, NRCan, Esri Japan, METI, Esri
Panaca (Built Sept. 2017) China (Hong Kong), Esri Korea, Esri (Thailand), NGCC, (c) OpenStreetMap contributors, and the GIS
User Community
Nevada Electric Highway
DC Fast Charging Station GOE planned DC Fast Charging Station
NDOT Rest Area DC Fast Charging Station In-Construction
Nevada Governor's 0 50 100 200 Miles
Office of Energy Updated 11/2020; v2.12
24Renewable Energy Tax Abatement Program
Governor’s
{See NRS 701A.300-390 & NAC 701A.500-660}
Office of
The Renewable Energy Tax Abatement (RETA) Program awards partial sales and
use tax and partial property tax abatements to renewable energy facilities. To be Energy
eligible, projects must employ at least 50% Nevada workers, pay 175% of Nevada’s Programs
average wage during construction, and offer health care benefits to workers and
their dependents. The Governor’s Office of Energy reviews the applications,
conducts public hearings to determine eligibility, and reviews annual compliance reports after
abatements are granted.
The Governor’s Office of Energy recently adopted regulations which
align with statutory changes approved during the 2019 Legislative
Session (SB 298, 2019). These changes ensure maximum benefits
to Nevadans as well as broaden the use fees to benefit the state. The
Agency was approved to increase administrative fees to better serve
Nevada in expanding renewable energy development in projects such
as:
• Renewable resource development
• Land use
• Regional market development
• Transmission planning
The Renewable Energy Tax Abatement Program is a crucial tool in
attracting developers to Nevada because it provides an incentive for
the construction of commercial power plants. These projects increase
Nevada’s tax revenue and lead to job creation in a growing industry.
Since the program’s inception, Nevada’s investment of $1 billion
in tax abatements has attracted more than $9 billion in capital
investments, payroll, and taxes paid. The projects that have received
an abatement from the Governor’s Office of Energy created more
than 10,000 jobs that paid an average wage of over $42 an hour.
This represents a total of 54 renewable power plants and one transmission Photo: Copper Mountain 5
(Source: Sempra Energy).
project in Nevada.
Projects granted a tax abatement in 2020:
COMPANY TYPE MW PPA ABATEMENT / INVESTMENT
Battle Mountain Solar 100 NVE $26,379,282 / $70,706,355
Dodge Flat Solar 200 NVE $15,876,266 / $105,112,512
Townsite Solar 193 VEA $24,705,774 / $134,640,020
Fish Springs Solar 100 NVE $7,595,064 / $53,122,163
Eagle Shadow Mtn Solar 300 NVE $17,601,260 / $356,062,543
Techren Solar Solar 100 NVE $3,009,000 / $44,105,138
Yellow Pine I Solar 125 SVCE $12,017,867 / $73,276,306
Dixie Meadows Geothermal 19 SCPPA $6,279,264 / $74,731,561
25Renewable Energy Fund
Governor’s
{See NRS 701.545-595 & NAC 701.600-700}
Office of
The Governor’s Office of Energy created a targeted grant program as a result of
Energy Senate Bill 536 (2019) and after receiving approval from the U.S. Department
Programs of Energy. This program is funded by repurposed American Recovery and Re-
investment Act (ARRA) funds which were previously utilized to administer the
Revolving Loan Program. The repurposed funds will be available to all market
sectors: residential, commercial, industrial and/or public. These funds and any subsequent recipients are
subject to ARRA requirements such as NEPA, Davis Bacon, and Buy American. The newly created grant
program will address goals and initiatives of the State of Nevada and these newly designated grant funds
will be utilized by directly investing through an open competitive solicitation for projects which support:
• Renewable energy and energy efficiency
• Grid modernization and energy resilience
• Energy storage and innovative clean energy technologies
• Energy education and workforce development
• Climate change initiatives
• Transportation electrification and alternative fuels
Photo (Above): Railroad Valley Farms (Source: Railroad Valley Farms, LLC).
26Nevada Clean Energy Fund (NCEF)
Governor’s
{See NRS 701B.930-995}
Office of
Established by Senate Bill 407 (2017), NCEF is an independent, nonprofit
corporation to provide funding for, and increase significantly, the pace and Energy
amount of financing available for qualified clean energy projects in the state. Programs
Goals of the fund include:
• Improve the standard of living by promoting more efficient and lower cost
clean energy projects that create high-paying, long-term jobs;
• Foster the development of transparent underwriting standards, standard contractual terms, and
measurement and verification protocols for clean energy projects;
• Promote the creation of performance data that enables effective underwriting, risk management
and pro forma modeling of financial performance of qualified clean energy projects to stimulate the
development of secondary investment markets; and
• Achieve a level of financing support for clean energy projects in the state.
NRS 701B.930-995 specifies the composition of the NCEF’s Board of Directors and sets forth its duties.
Nevada Clean Energy Fund Board of Directors (section 16 of SB 407)
(a) The Director of the Office of Energy – David Bobzien
(b) The Executive Director of the Office of Economic Development or his or her designee – Michael
Brown
(c) The Real Estate Administrator of the Department of Business and Industry or his or her designee
– Sharath Chandra
(d) The Commissioner of Financial Institutions or his or her designee – Sandy O’Laughlin
(e) One member appointed by the Governor from among a list of nominees submitted by the State
Contractors’ Board – Guy Snow
(f) One member appointed by the Governor from among a list of nominees submitted by labor
organizations in this State - Jesse Newman
(g) One member appointed by the Governor from among a list of nominees submitted by the board
of county commissioners of the county in this State with the largest population – Les Lazareck
(h) One member appointed by the Governor from among a list of nominees submitted by the board
of county commissioners of the county in this State with the second largest population – Jason
Geddes
(i) One member appointed by the Governor from among a list of nominees submitted by the boards
of county commissioners of the counties in this State not described in paragraph (g) or (h) –
Robert Johnston
The Coalition for Green Capital continues to provide pro bono consulting services to the NCEF to assist
with the startup of the organization including business planning and staffing, fund-raising and operating
support. This activity is funded with philanthropic grants provided to the Coalition for Green Capital.
NCEF held two 2020 Board of Directors meetings, one in February and one in September, after NCEF’s
work was temporarily paused at the request of the Governor’s Finance Office due to the COVID-19
pandemic. In August 2020, the Interim Finance Committee authorized the Governor’s Office of Energy to
provide operational start-up funding to NCEF over the next two years in the amount of $400,000. During
the September meeting, the board elected officers. The board has commenced the search for NCEF’s first
executive director, and expects to fill the position in early 2021.
27Property Assessed Clean Energy (PACE)
Governor’s
{See NRS 271.265-271.630}
Office of
During the 2017 legislative session, the Governor’s Office of Energy sponsored
Energy Assembly Bill 5 which enabled local governments to implement commercial
Programs PACE programs. PACE is a financing mechanism that supplies upfront costs for
renewable energy and energy efficiency projects. It is a loan that is paid back over
time through a voluntary special assessment and allows for the transfer of the loan obligation to the next
owner.
Benefits of PACE
PACE funding covers 100% of a project’s hard and soft costs and will often have guaranteed low interest
rates for terms of up to 20 years. The long loan amortization enables positive cash flow resulting in annual
energy savings that are larger than the annual repayment. PACE increases the value of properties, creates
jobs, helps the state achieve its policy goals and boosts the local economy bringing private investment
dollars to local communities.
State of Nevada Updates
The Governor’s Office of Energy, along with the City of Las Vegas and City of Reno, have been selected
to participate in the U.S. Department of Energy Commercial PACE Working Group. The goal of this
working group is to develop tools and solutions to barriers facing state and local government. In order
to create awareness and provide resources for local governments, the Governor’s Office of Energy
hosted a PACE webinar in 2018. The webinar provided an overview of PACE, a discussion on benefits to
property owners and local governments and an overview of the first steps a local government must take
when implementing PACE.
The City of Las Vegas launched the first Commercial PACE program in Nevada in September 2019. The
program is administered by Sustainable Real Estate Solutions, Inc. (SRS). The program administrator
is responsible for program management and quality assurance as well as property owner project
application processing and support services to stakeholders. The City of Reno followed close behind and
in October 2019 established a Commercial PACE program in Reno. The City of Reno has hired a third-
party administrator to develop and administer the program. The City of Fernley adopted a resolution in
September 2020 creating an energy improvement district for the purpose of implementing a C-PACE
Program.
28You can also read