Energy Transition 101 PRIMER - Vivan Sorab April 2021 - Squarespace
←
→
Page content transcription
If your browser does not render page correctly, please read the page content below

1 0 1 P RIMER

Energy
Transition
Learn about the global energy transition and its major investment theses.

Vivan Sorab
April 2021

Limited release for CREO Members, Affiliate Members,
and Prospects. Please do not distribute.
Contents

1. Introduction. . . . . . . . . . . . . . . . . . . . . . . . . . . . . . . . . . . . . . . . . . . . . . . . . . . . . . . . . . . . . .          3
1.1 Energy Transition Indicators. . . . . . . . . . . . . . . . . . . . . . . . . . . . . . . . . . . . . . . . . . . . . . . . . . .               3
1.2 Growth in Forward Energy Demand . . . . . . . . . . . . . . . . . . . . . . . . . . . . . . . . . . . . . . . . . . . . .                       5
1.3 Electricity Access. . . . . . . . . . . . . . . . . . . . . . . . . . . . . . . . . . . . . . . . . . . . . . . . . . . . . . . . . . .         6
1.4 Electricity and Hydrogen as Modern Energy Carriers . . . . . . . . . . . . . . . . . . . . . . . . . . . . . . .                                7
1.5 Energy Costs and Outlooks. . . . . . . . . . . . . . . . . . . . . . . . . . . . . . . . . . . . . . . . . . . . . . . . . . . .                8
2. Negawatts. . . . . . . . . . . . . . . . . . . . . . . . . . . . . . . . . . . . . . . . . . . . . . . . . . . . . . . . . . . . . . .           9
2.1 Energy Efficiency by End-Use Sector . . . . . . . . . . . . . . . . . . . . . . . . . . . . . . . . . . . . . . . . . . . .                     10
2.2 Additional Commentary for Investors . . . . . . . . . . . . . . . . . . . . . . . . . . . . . . . . . . . . . . . . . . .                       11
3. Renewables + Electrify Everything . . . . . . . . . . . . . . . . . . . . . . . . . . . . . . . . . . . . . . . . . . . .                        12
3.1 Generation and Generation Software. . . . . . . . . . . . . . . . . . . . . . . . . . . . . . . . . . . . . . . . . . . .                       13
3.2 Smart Grid and Storage. . . . . . . . . . . . . . . . . . . . . . . . . . . . . . . . . . . . . . . . . . . . . . . . . . . . . . .             14
3.3 End-Use. . . . . . . . . . . . . . . . . . . . . . . . . . . . . . . . . . . . . . . . . . . . . . . . . . . . . . . . . . . . . . . . . . .    14
3.4 Additional Commentary for Investors . . . . . . . . . . . . . . . . . . . . . . . . . . . . . . . . . . . . . . . . . . .                       15
4. Hard-to-Electrify Sectors . . . . . . . . . . . . . . . . . . . . . . . . . . . . . . . . . . . . . . . . . . . . . . . . . . .                  16
4.1 Chemicals. . . . . . . . . . . . . . . . . . . . . . . . . . . . . . . . . . . . . . . . . . . . . . . . . . . . . . . . . . . . . . . . . .    17
4.2 Iron and Steel. . . . . . . . . . . . . . . . . . . . . . . . . . . . . . . . . . . . . . . . . . . . . . . . . . . . . . . . . . . . . . .     18
4.3 Cement. . . . . . . . . . . . . . . . . . . . . . . . . . . . . . . . . . . . . . . . . . . . . . . . . . . . . . . . . . . . . . . . . . . .   18
4.4 Long-Haul Transport, Shipping, and Aviation. . . . . . . . . . . . . . . . . . . . . . . . . . . . . . . . . . . . . .                          19
4.5 Additional Commentary for Investors . . . . . . . . . . . . . . . . . . . . . . . . . . . . . . . . . . . . . . . . . . .                       19
5. Increased Energy Demand . . . . . . . . . . . . . . . . . . . . . . . . . . . . . . . . . . . . . . . . . . . . . . . . . .                      21
5.1 Advanced Wind and Solar. . . . . . . . . . . . . . . . . . . . . . . . . . . . . . . . . . . . . . . . . . . . . . . . . . . . .                21
5.2 Advanced Nuclear. . . . . . . . . . . . . . . . . . . . . . . . . . . . . . . . . . . . . . . . . . . . . . . . . . . . . . . . . . .           22
5.3 Geothermal Energy . . . . . . . . . . . . . . . . . . . . . . . . . . . . . . . . . . . . . . . . . . . . . . . . . . . . . . . . . .           23
5.4 Transmission and Storage. . . . . . . . . . . . . . . . . . . . . . . . . . . . . . . . . . . . . . . . . . . . . . . . . . . . .               23
5.5 Additional Commentary for Investors . . . . . . . . . . . . . . . . . . . . . . . . . . . . . . . . . . . . . . . . . . .                       24
6. Energy Access. . . . . . . . . . . . . . . . . . . . . . . . . . . . . . . . . . . . . . . . . . . . . . . . . . . . . . . . . . . .             24
6.1 Off-Grid Solar (OGS) Systems. . . . . . . . . . . . . . . . . . . . . . . . . . . . . . . . . . . . . . . . . . . . . . . . . .                 25
6.2 Mini Grids. . . . . . . . . . . . . . . . . . . . . . . . . . . . . . . . . . . . . . . . . . . . . . . . . . . . . . . . . . . . . . . . . .   26
6.3 Additional Commentary for Investors . . . . . . . . . . . . . . . . . . . . . . . . . . . . . . . . . . . . . . . . . . .                       26
7. Conclusions and Key Takeaways . . . . . . . . . . . . . . . . . . . . . . . . . . . . . . . . . . . . . . . . . . . . .                          27
Works Cited. . . . . . . . . . . . . . . . . . . . . . . . . . . . . . . . . . . . . . . . . . . . . . . . . . . . . . . . . . . . . . . .          28
Interview Acknowledgments. . . . . . . . . . . . . . . . . . . . . . . . . . . . . . . . . . . . . . . . . . . . . . . . . . .                      31

Please consider the environment before printing this document.
We can provide a consolidated text-only version if printing is necessary.

                                                                                                                            Energy Transition Primer | 2
1. Introduction
The need to decarbonize the global economy together with a drop in prices of renewable power have
accelerated the energy transition, though its magnitude remains its greatest hurdle. In 2019, for
instance, fossil fuels supplied 84% of the world’s primary energy needs, with renewables (including
biofuels and excluding hydropower) supplying only 5%. In the same year, however, renewables

       Figure 1: Renewables are occupying increasing shares of global energy demand growth.

supplied 41% of the world’s incremental primary energy, led by wind (18%) and solar (16%) [1].
Navigating the energy transition is complex, and there is significant uncertainty in how it will play out
in the future. This primer presents several macro trends characterizing the current state of the energy
transition and outlines five umbrella theses that investors are deploying to capitalize on those trends.
Although a comprehensive treatment of the energy transition is beyond the scope of a 101 primer,
this document aims to provide a broad overview of the energy transition and its accompanying
investment opportunities for investors with limited energy experience.

1.1 Energy Transition Indicators

The current energy transition differs from previous ones in that carbon emissions reduction is among
its core pillars. Although no single set of metrics can capture the energy transition in its entirety,
macro trends in energy-related emissions, carbon intensity of final energy use, and energy intensity
shed light on the current state of the energy transition. Investments, which are far ranging and
encompass diverse sectors from renewables to oil and gas and electrified end uses and advanced

                                                                                              Energy Transition Primer | 3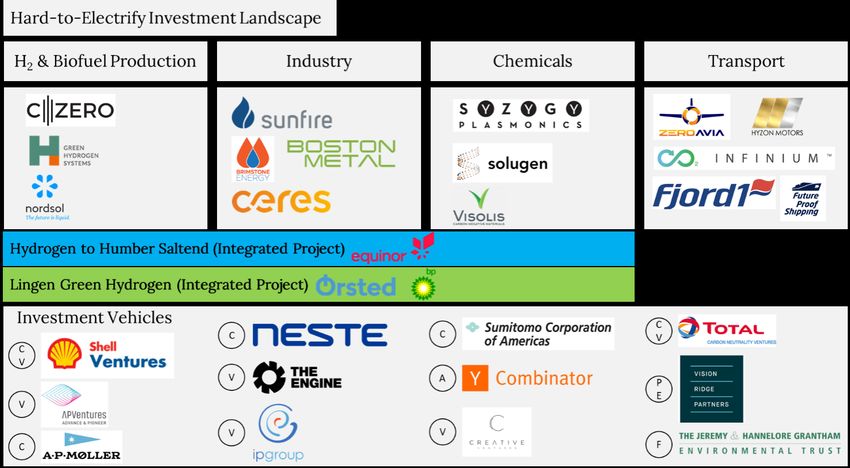
technologies, are showing early signs of growth in non-traditional areas as well.

Emissions from energy have been declining in advanced economies1 over the past decade (-0.5%
per year on average), but have seen steady growth in emerging economies (+2.76% per year on
average). Global energy-related CO2 emissions stabilized at 33 Gt in 2018 and 2019, thanks to a ~0.4
Gt drop in emissions from advanced economies which offset increases from the rest of the world
[2]. Declines have been attributed to the power sector, with growth in renewables capacity (mostly
through solar PV and wind), an increase in natural gas use over coal, growth in nuclear power output,
and energy efficiency improvements. Industry accounted for 48% of emissions, while buildings and
transportation accounted for 26% and 24% respectively in 2018.

Average global carbon intensity has been largely steady at ~3.5tCO2e/toe for two decades, but
has seen slow reduction (at 1% annually) since 2013 [3]. This decline is the net result of significant
reductions in geographies like the USA and Europe (16% and 12.5% respectively between 2000–
2018) and increases in fossil fuel demand starting 2016, especially in China and India. While
encouraging, the IEA points out that this rate of reduction is insufficient to meet the targets of its
Sustainable Development Scenario, which requires a rate of 2.2% to stay on track with the United
Nations’ Sustainable Development Goals. The lowering of carbon intensity of final energy use is being
driven by growth in demand for renewable power accompanied by declines in costs of wind and solar,
alongside a reduction in coal consumption in many geographies. These concepts lie at the core of
the Electrify Everything investment thesis, which emphasizes renewable electrification as the fastest
path to decarbonization.

Energy intensity quantifies an economy’s use of energy to produce monetary value, measured as
primary energy demand per unit of GDP. Although energy intensities have been reducing globally, their
rates of decline (1.7% in 2017, and 1.2% in 2018) are lower than the target rate of 2.9% per annum
under the IEA’s Sustainable Development Scenario. Energy efficiency interventions are key to reducing
energy intensity and depend on policies like fuel efficiency standards and financial incentives like tax
relief on building efficiency improvements.

Investments in the energy transition are reaching record highs. Research from Bloomberg New
Energy Finance [4] shows that global government, corporate, and household investments in the
energy transition2 stood at USD 500 billion in 2020, increasing 9% from 2019 despite challenges
posed by the COVID-19 pandemic, and 73% higher than the 2011 figure of USD 290 billion.
Investments in renewable energy reached USD 304 billion in 2020, the majority coming from wind
($142.7 billion) and solar ($148.6 billion), while investments in electrified transportation (USD 139
billion) and heating ($51 billion) have stayed robust. Data on hydrogen extend to 2018 and exclude
blue hydrogen projects but reveal that $1.5 billion was spent in 2020, down from $1.9 billion in 2019
on lower levels of investment in fuel cell buses. From a regional standpoint, China’s 2020 energy
transition investments ($135 billion) far outpace its closest competition in the US ($85 billion),

1      Australia, Canada, Chile, European Union, Iceland, Israel, Japan, Korea, Mexico, Norway, New Zealand, Switzerland, Turkey, and United States
2      Into technologies across renewable energy, electrified transport and heat, energy storage, Carbon Capture and Storage (CCS), and hydrogen

                                                                                                                              Energy Transition Primer | 4
Germany ($29 billion), Japan ($27 billion), and the UK ($26 billion). European cumulative investments
grew 67% from 2019, driven by the growth of offshore wind and electric vehicles. While encouraging,
investments will need to rise significantly to enable the global energy transition. The IEA estimates
that total annual energy investments between 2018 and 2040 will reach $3.2 trillion, and as much as
70% this will need to be focused on renewable energy by 2040.

1.2 Growth in Forward Energy Demand
Forward energy demand is highly uncertain in its magnitude and direction. Long-term energy
projections approach this uncertainty by defining policy- or geopolitically-driven scenarios that vary
in their scope and ambition. These usually assume a continuation of current policies with little to
no change (Reference), those that specifically target net-zero (or similar) emissions reductions in

              Figure 2: Energy demand projections to 2050 show broad variations. Starred entries represent projections to 2040. Data
              sourced from respective company reports.

                                                                                                                        Energy Transition Primer | 5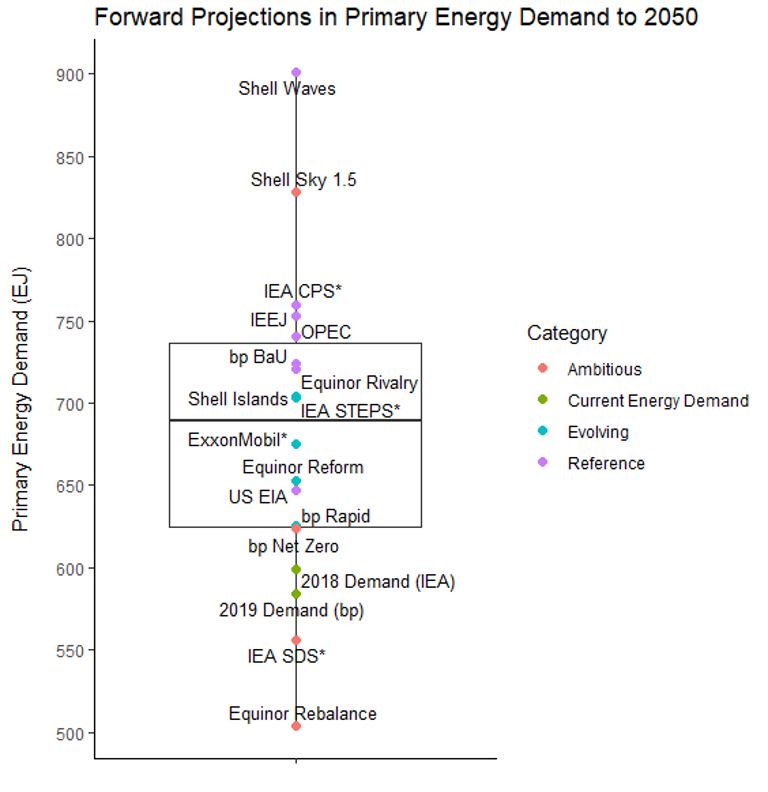
a specified time frame (Ambitious), and those that represent an evolution from current policies
(Evolving). Although these projections vary in their underlying assumptions, they largely agree that
global energy demand will rise without ambitious policy interventions to align global emissions with
2oC or 1.5oC warming pathways.

These projections are based on several factors, including economic growth, policy, technology
development, and population. However, few forward projections make explicit mention of the
potentially substantial energy footprint of climate change mitigation itself. Studies suggest that
mid-century energy demand could increase between 11–27% under conditions of moderate warming,
and between 25–58% under conditions of vigorous warming [5], over and above projected increases
due to economic growth and population rise. Climate change mitigation, via technologies like Direct
Air Capture (DAC), Carbon Capture and Storage (CCS),3 and desalination, will also account for
substantial energy demand. Combined DAC and CCS, a category of Negative Emissions Technologies
(NETs) critical to achieving a 1.5oC global warming pathway, could alone require 300 EJ of energy
input (~50% of today’s primary energy consumption globally) by 2100 [6], were they to achieve global
scale. Desalination, another technology anticipated to grow in response to climate change effects,
has sizeable energy requirements as well. In the Middle East, for example, which accounts for 47% [7]
of global desalination capacity, the technology accounts for roughly 5% of total energy consumption
despite providing only about 3% of the region’s water [8]. Water scarcity in the Middle East is forecast
to increase significantly in the coming decades, reaching a gap ranging between 85–83 billion cubic
meters (bcm)/year by 2050. The projected rise in necessary desalination capacity will require 250
TWh of electricity, or 500 million solar panels for desalination alone in the Middle East, per year by
2040 [9]. Energy demand for air conditioning is projected to increase to 6,205 TWh per year by 2050,
driven by the growth of air conditioning demand in India, China, and Indonesia. The IEA projects that
energy efficiency interventions, such as through more efficient air-conditioners, can almost halve this
projected demand to 3,405 TWh, saving $3 trillion by 2050 [10].

1.3 Electricity Access

The world has made significant progress on enabling access to electricity, though this progress has
been uneven. The global population without electricity access went from 1.2 billion in 2010 to 789
million in 2018, with several regions and countries on the way to achieving universal access. Latin
America, the Caribbean, and South-East and East Asia for example had achieved a 98% electrification
by 2018, while Central and Southern Asia saw a 92% electrification rate. Sub-Saharan Africa has seen
stagnation in the meantime—having achieved electricity access for 47% of its population in 2016, the
region has since seen no improvement with population rise and electrification rate keeping pace with
one another. The most recent data (2018) from United Nations (UN) statistics show that 548 million
people in Sub-Saharan Africa lacked electricity. Electricity access deficits are heavily skewed—20
countries account for 78% of the global population without electricity, with the greatest deficits being
in Nigeria (85m), the Democratic Republic of the Congo (DRC) (68m) and India (64m) [11].

3          Readers are referred to CREO’s 101 Primer on Atmospheric Carbon Dioxide Removal for an overview of technologies and investment opportunities
including DAC and CCS.

                                                                                                                             Energy Transition Primer | 6
Electricity access increased at 0.77% per year on average from 2010–2016 and accelerated to 0.82% from 2016 to 2018. While encouraging, this is below the projected annual required rate of 0.87% which would enable universal access to electricity by 2030. At current rates, 620 million people would still lack electricity access in 2030, with 85% of that number concentrated in Sub-Saharan Africa. Rural and urban areas differ in their extents of electrification around the world. While electrification had yet to reach 668 million rural residents in 2018 versus 121 million who had it in urban areas, the rate of rural electrification has been faster than that in urban settings. Key challenges for bringing electricity access to urban populations in large cities include large informal settlements that present legal and ownership challenges to utilities, as well as low demand. Rural electrification has also benefited from philanthropic donations and media campaigns to a greater extent than urban settings. The deployment of off-grid technologies such as standalone home energy systems and mini-grids has helped enable electricity access to 136 million people in 2018, rising from 1 million in 2010. This has been facilitated by the advent of innovative business models and financing solutions such as the PAYGO model that are being picked up by local entrepreneurs backed by private and corporate investors. While encouraging, it is important to note that electricity access as defined by monitoring agencies like the UN does not guarantee consistency of supply and often precludes the ability to power anything but selected basic household necessities. Ensuring true energy access to enable robust economic development will necessitate capital for the build-out of generation capacity and infrastructure. 1.4 Electricity and Hydrogen as Modern Energy Carriers Replacing fossil fuels with electricity as the world’s dominant energy carrier can have substantial effects on global CO2 emissions. Estimates from the International Renewable Energy Agency (IRENA) suggest that electrification powered by renewable energy can deliver up to 75% of CO2 emissions reductions by 2050 as required to meet Paris Agreement goals. Achieving this will require significant growth in electricity for end uses in transportation (growing from 1% currently to 40% in 2050), industry, and buildings. In 2019, electricity formed 20% of end-use energy consumption, increasing from 18% in 2010. Under IRENA energy scenarios that align with the Paris Agreement, electricity would need to form 50% of end-use energy by 2050, 86% of which would come from renewable sources like solar PV and wind. These reach 8519 GW and 6044 GW respectively of installed capacity globally in that timeframe, though other technologies like hydropower, geothermal, and nuclear would also contribute. Key technologies enabling the electrification of energy end-use include passenger electric vehicles and heat pumps. While passenger electric vehicles have grown significantly over the past decade, going from
low (74 Mt in 2018), stems primarily from oil and gas refining and the chemicals industry rather
than for energy, and is served mostly by “grey” hydrogen4 produced through coal gasification or
Steam Methane Reforming (SMR) of natural gas. Though markets are growing for applications
like Fuel Cell Electric Vehicles (FCEVs), gas-grid injection, industrial processes, electricity storage,
and synthetic fuels, widespread hydrogen production and deployment will be challenging in the
short term. Nevertheless, 30 countries have released hydrogen strategy roadmaps, $70 billion in
governmental funding has been committed, and 228 projects (potentially amounting to $300 billion
in total investments to 2030 if they are realized) have been announced across all segments of the
hydrogen value chain [13]. Countries are also launching massive green hydrogen projects aimed at
transforming their natural endowments of renewable energy resources into exportable hydrogen
and ammonia. Examples include a USD 5b joint-venture project between Air Products & Chemicals,
and Saudi Arabia’s ACWA Power and planned smart city, Neom, and the Asian Renewable Energy
Hub, a 26 GW, a $22bn renewable energy project in Australia, with 23 GW devoted to green hydrogen
production.

Production cost is a key challenge to the scaling of green hydrogen. Currently, grey hydrogen
production costs are lower than $1/kg in certain locations and are significantly lower than green
hydrogen production costs ($5.5/kg on average, and $4.0/kg in optimal locations). Costs are
expected to converge in the 2030s, as the CAPEX requirements of electrolyzers and Levelized
Costs of Energy (LCOE) of renewables decline, and electrolyzer utilization rates improve via large-
scale integrated renewable hydrogen projects coming onstream. Blue hydrogen, which depends on
Carbon Capture and Storage (CCS) to prevent atmospheric emissions, will reach cost parity with
grey hydrogen sooner. Breakeven costs of green hydrogen, blue hydrogen, and grey hydrogen are an
interplay between local resource availability, natural gas prices (the main cost component to blue
hydrogen production by steam methane reforming), and carbon pricing, and different geographies will
achieve cost parity at different times. Experienced investors expect that green hydrogen will become
cost competitive with blue and grey hydrogen at costs of $1–$2/kg depending on geography, making
it a viable target in the future especially with further anticipated reductions in the cost of renewable
power (currently the greatest component of cost for green hydrogen production). Assuming low
electricity prices ($30/MWh) and reductions in electrolyzer CAPEX accompanying growth in deployed
capacity, IRENA forecasts that production costs of $1–$2/kg for green hydrogen can be met in the
2030s, and can reach levels of $1.0–$1.5/kg by 2050 [14].

1.5 Energy Costs and Outlooks

The costs of generating energy from renewables, as measured using the Levelized Cost of Energy
(LCOE), continue to trend downwards, driven by reductions in costs of system components and
improvements in efficiency. Since 2009, the LCOEs of utility-scale renewable generation have reduced
significantly, with crystalline solar PV and onshore wind dropping 90% and 70% respectively though

4            Hydrogen’s “color” depends on its production process and the fate of any emissions produced. “Grey” hydrogen is produced from fossil fuel precursors
with CO2 emissions vented to the atmosphere. If emissions are sequestered underground instead, the hydrogen is “blue”. “Green” hydrogen is produced via
electrolysis of water using renewable energy and produces no downstream CO2 emissions.

                                                                                                                                  Energy Transition Primer | 8
the rates of decline are slowing. These cost reductions are driving renewable generation globally.
Between 2018 and 2020, for example, corporate procurements of solar energy increased 44%,
reaching 9.6 GW in 2019.
The latest annual LCOE estimates from Lazard [15] saw unsubsidized utility scale crystalline solar PV
reach $31–$42 per MWh, onshore wind reach $26–$54 per MWh, and offshore wind reach $86 per
MWh. These costs are competitive with new-build coal, gas peaker, nuclear, and gas combined cycle
plants in many cases, though the marginal costs of running fully depreciated conventional generation
facilities remain low enough to compete with new renewables buildout. The competitiveness of
renewable generation continues to be influenced by several factors, including fuel costs, carbon
prices, and government subsidies, such as the US Investment Tax Credit (ITC) and Production Tax
Credit (PTC) which further reduce LCOE. Fuel costs can have significant impacts on LCOE. Lazard’s
analysis shows that a 25% reduction in natural gas price can produce a 14% reduction in the LCOE
of combined cycle power plants, making the future trajectory of fossil fuel prices a key factor in
determining the competitiveness of renewable generation. Carbon pricing can have sizeable impacts
on LCOE as well, with prices between $20 and $40/ton pushing LCOEs of conventional fossil-fuel
generation5 higher. Despite impressive reductions in cost, the ability of renewables to compete
with fossil generation still falls short in terms of characteristics like dispatch, a key gap that energy
storage technology will play a role in filling. Forwards costs of renewable generation are expected to
fall further. Projections by IRENA indicate that solar PV costs will fall 58% from 2018 levels by 2030,
driven by advances in solar cell architecture and optimization across the solar cell manufacturing
value chain. Onshore wind over the same timeframe will see cost declines of 25%, driven by the
deployment of larger turbines that improve capacity factors. Offshore wind will also see costs fall
as larger turbines are deployed, operations and maintenance costs are reduced, and increasing
competition for projects drives consolidation across the industry. IRENA projects a 55% reduction in
offshore wind energy costs to 2030. Across both onshore and offshore wind, LCOE reductions will be
facilitated by the real-time data analytics and predictive maintenance.
2. Negawatts
Energy efficiency gains underpin every major projection that achieves substantial emissions
reductions. Their attractiveness stems from their negative marginal abatement costs—investments
in energy efficiency tend to pay for themselves—and are often the easiest measures to implement in
decarbonizing the buildings, industrial, and transportation sectors. The idea of boosting efficiency
measures to conserve energy goes back to the 1980s, when the Rocky Mountain Institute in the USA
began using the term Negawatts to describe energy savings achievable exclusively by better design.
5 Onshore wind, whose LCOE ranges overlap with conventional generation at higher levels, becomes fully cheaper than the latter once carbon prices are
considered.
Energy Transition Primer | 92.1 Energy Efficiency by End-Use Sector
Energy efficiency is often examined through the lens of end-use sector. In commercial and residential
buildings, privately held companies are deploying several technologies to reduce and optimize energy
consumption. In many cases these leverage the growing wave of digitalization, for example through
AI-driven “energy savings-as-a-service” (Carbon Lighthouse), smart actuators (ecobee), and hybrid
solutions like smart glass that uses electrochemical technology (Kinestral) to deliver energy savings
in addition to other benefits. Pure-play energy efficiency companies in industry and transportation
Figure 3: Negawatts investment landscape showing companies and investment vehicles. IF - Infrastructure Finance; V - Venture Capital; F - Family Office,
CV - Corporate Venture Capital; PPP - Public - Private Partnership
are fewer, reflecting sectoral challenges in deploying efficiency interventions, such as prioritization
of operational efficiency. In industry and commercial transportation, for example, energy efficiency
savings are sometimes a lower priority than production and operational efficiency and implementing
retrofits or new technologies in existing systems can create downtime or other connected issues
downstream. Operational and energy efficiency are not mutually exclusive however, and energy and
resource efficiency gain that industry 4.0 and transport optimization companies provide in addition
to their core offerings make them fruitful avenues for impact-minded early- and growth-stage
equity investors. Another vertical seeing entrepreneurial activity is energy efficiency financing and
enablement, which is seeing companies develop and deploy structured financial solutions to advance
large-scale energy efficiency projects (Alturus) and enable Property Assessed Clean Energy (PACE)
financing for residential customers (Renew Financial).
Energy Transition Primer | 10Determining a market size for energy efficiency is not straightforward. Although the purchase of
a single product, such as an efficient appliance, could represent expenditure on energy efficiency,
larger, more complex projects at the scale of a building, an industrial facility, or even a city can have
mandates to improve energy efficiency as well. As such, a few lenses can be used to examine trends
in energy efficiency. The first, incremental spending on energy efficient equipment (such as lighting
fixtures, efficient transportation, or efficient industrial equipment), stood at USD 240 billion in 2018,
with the bulk flowing into buildings (58%), followed by transportation (26%), and industry (16%). The
second, spending on energy efficiency projects by Energy Service Companies (ESCOs), stood at $30.9
billion in 2018, and achieved 7% annual growth on average between 2015 and 2018 [16]. The ESCO
model is growing in popularity around the world as a means for customers to access the financial
benefits of energy efficiency upgrades and retrofits without upfront capital expenditure. ESCOs front
the costs of the equipment on their own or through third-party financing, and work on long-term
contracts with customers with payment tied to energy savings obtained from the efficiency upgrades.
China currently dominates the global ESCO market, with 2018 revenue totaling $16.4 billion. A third
measure is spending on mortgage-based loans for energy efficiency upgrades in homes. These are
enabled through so-called green mortgages such as the Green Rewards Program of the US Federal
National Mortgage Association (FNMA) and the Energy Efficiency Mortgages Action Plan (EeMAP)
of the European Union. In 2018, FNMA issued USD 45 billion worth of financing. Finally, Property-
Assessed Clean Energy (PACE) financing enables energy efficiency improvements through loans that
are repaid through property taxes. This model, which has gained most traction in the US, has seen
$6.6 billion invested since 2014 [17].
2.2 Additional Commentary for Investors
Opportunities to invest in energy efficiency span several asset classes. In the public equities markets,
companies like Johnson Controls (NYSE: JCI), and CBRE (NYSE: CBRE) offer a range of energy
efficiency products and services. Hanon Armstrong (NYSE: HASI), a publicly traded infrastructure
finance firm, provides financial backing to companies in several sectors, including energy efficiency
companies. Private infrastructure finance firms are also active in energy efficiency, such as Generate
Capital’s $65 million investment into commercial energy efficiency startup Carbon Lighthouse
[18] and a $600 million financing for Alturus LLC, a company providing energy efficiency project
services to Fortune 1,000 companies [19]. In the private equity space, New York City based American
Industrial Partners acquired GE’s energy efficiency unit, Current, in 2019, and the UK’s Earth Capital
saw energy efficiency investment success after exiting the UK Energy Efficiency Investments fund via
a £100m IPO in 2019 [20]. Venture capital firms, both private and corporate, have invested in energy
efficiency as well. An example is ecobee, a Toronto-based smart actuator company that produces
thermostats for commercial and residential applications. Ecobee received early-stage financing
from the Amazon Alexa Fund and raised a subsequent financing round with New York based venture
capital firm Energy Impact Partners. The company has raised close to $150 million to date, and
includes the Caisse de Depot et Placement du Quebec pension fund among its later stage investors.
Energy efficiency is also benefiting from investment by governments and public-private partnerships,
who are deploying investment vehicles dedicated to energy efficiency intervention. Examples include
Energy Transition Primer | 11the Government of India’s Venture Capital Fund for Energy Efficiency (VCFEE), Canada’s Center for
Excellence in Energy Efficiency, which focuses on energy efficiency in the transportation sector, and
the European Energy Efficiency Fund (EEEF).
Energy efficiency is also policy driven, so changes in government regulations can have material
impacts on efficiency projects and investments. In China, for example, the ESCO market saw 25%
annual growth from 2011–2015 but saw only 3% growth from 2017 to 2018. This was due to removal
of subsidies that rewarded ESCOs for energy savings. The energy efficiency space is becoming
increasingly crowded as well. The number of companies developing energy efficiency solutions, and
especially digitally enabled ones, is growing rapidly and makes finding truly differentiated companies
that innovate beyond IoT, “smart” actuators, and sensor-based systems challenging. Efficiency
interventions can suffer from the Principal-Agent problem,6 which arises when incentives do not align
between the asset owner, who must make CAPEX investments to enhance energy efficiency, and the
asset user, who will enjoy the benefits of the investment. And despite their potential for cost savings,
energy efficiency investments, particularly as they pertain to retrofits on existing equipment, are
sometimes lower priority for industrial and commercial customers who might choose to spend on
operational efficiency, safety, or other considerations.
3. Renewables + Electrify Everything
Electrifying energy end-use applications and powering them with renewables has garnered
significant attention from private investors. As an investment thesis that mostly targets mature
and commercially deployable technologies with attractive unit economics, Renewables + Electrify
Everything has strong near-term potential to address greenhouse gas emissions and improve societal
outcomes while generating competitive returns. Underlying the popularity of this thesis are the fall
in costs of renewable power from solar and wind, rapid cost reductions in lithium-ion batteries for
short-duration energy storage, and a growing number of economic sectors, such as transportation,
that are embracing electrification. It has also benefited from the growth of digitalization and presents
opportunities for investors to combine the CAPEX-light world of traditional technology companies
with positive environmental impact.
The maturity of Renewables + Electrify Everything is reflected in the breadth of its technology and
investment landscape, which is presented using a standard energy value chain framework going from
power generation through transmission, distribution, and storage, and to end-use. The framework
is layered, comprising an infrastructure base of assets like wind and solar farms, energy storage
projects, and transmission and distribution lines, and a software layer with companies attempting to
bring the power of digitalization to improve individual value chain segments enabling their interaction
through smart grid technologies. Digitalization and innovation are allowing companies to operate
across value chain segments. Behind-the-meter storage companies, for example, are merging
distributed energy generation technologies like rooftop solar with in-house energy storage systems.
6 https://www.resourcesmag.org/archives/resources-radio-energy-inefficiency-and-principal-agent-problem/
Energy Transition Primer | 12Vehicle-to-grid companies are enabling electric vehicles to interface with electric grids. Companies
and investors are also tapping opportunities that reflect cascading effects of electrification and
digitalization. Cybersecurity is drawing interest from prominent clean energy investors as increased
grid digitalization heightens the risk of cyberattacks, and specialized insurance and sales companies
catering to clean energy are attracting large private investments as well.
3.1 Generation and Generation Software
Investments in renewable energy generation can be approached via equity or debt investing in
renewable energy projects or investments in renewable energy project development companies.
Equity investments at the early, higher-risk stages of a renewable energy project development provide
investors with tax benefits and future exit opportunities via project acquisitions by institutional
investors. Data compiled by US-based investment firm Cambridge Associates over the 2000–2018
period show $23.6 billion of private capital invested in renewable power development, and pooled
gross IRR of 10.5% [21]. Growing alongside generation projects are several software plays that are
attractive options for early- and growth-stage venture capital investors. These companies focus
on solving pain-points in renewable energy project development such as optimizing power output
from wind and solar farms through the application of data analytics (Clir Renewables, Greenbyte)
and streamlining the installation of solar PV facilities to reduce “soft” costs such as permitting
and financing, which can comprise significant proportions of a project’s final costs (Aurora Solar,
PV Stream). While wind and solar projects currently dominate renewables projects, opportunities
in sectors like waste to energy, hydropower, and ocean energy are seeing interest from equity
investors as well. Many of these, especially in areas like advanced geothermal and nuclear, are still at
demonstration phases or earlier, and are considered among the investor community under different
Figure 4: Renewables + Electrify Everything investment landscape with example companies and investment vehicles. PF - Pension Fund; F -
Family Office; V - Venture Capital; CV - Corporate Venture Capital; HF - Hedge Fund
Energy Transition Primer | 13frameworks.
3.2 Smart Grid and Storage
The case for investments in grid enhancement and storage is growing, driven by factors that include
the rise of variable renewable generation and distributed energy resources, changing customer
behavior, electrification of end-use sectors, and new operational risks in the form of climate change
adaptation and cybersecurity concerns. While investments in core transmission and distribution
infrastructure to create larger and more interconnected grids are critical to enabling this thesis,
they are driven by utilities and corporations, the investment ecosystem for smart grid and energy
storage technologies is proving fertile ground for private equity investors. Data from Cambridge
Associates show $839 million of private investment into the smart grid sector with and gross pooled
IRR of 32.2%. Energy storage technologies, which are covered more comprehensively in CREO’s
Energy Storage investment primer, have seen close to $2 billion in private investments between
2000–2018 and a pooled gross IRR of 29%. Investment opportunities in the smart grid vertical are
vast and cover a breadth of technologies and business models. Although capturing this range in a
comprehensive framework is challenging, the smart grid technology landscape can be broken down
at a high level into three segments: network enhancement, grid optimization and monitoring, and
customer interface. Companies operating in network enhancement seek to boost the grid’s ability for
physical transfer of power through technologies like Dynamic Line Rating (Ampacimon) and Flexible
Alternating Current Transmission Systems (FACTS) (Smart Wires). Grid optimization and monitoring
companies operate across a spectrum of services, including artificial intelligence for load prediction
(BluWave-ai), cybersecurity (Dragos), and overhead line monitoring (LineVision). Companies in the
customer interface segment enable interactions between various stakeholders in the value chain
through demand response (leap), vehicle-to-grid (WeaveGrid), energy trading (Power Ledger), and
more. On the storage front, behind-the-meter company Sonnen provides a smart energy storage
solution for home owners.
3.3 End-Use
Transportation: The electrification of energy end-use has made most progress in the transportation
sector and will continue to accelerate in the coming decades. Research from Bloomberg New Energy
Finance (BNEF) sees electric vehicles (EVs) rising to 10% of global passenger vehicle sales in 2025,
28% in 2030, and 58% in 2050, though EV penetration will be slower in emerging markets such as
India where price parity between EVs and Internal Combustion Engine (ICE) vehicles will not be
achieved until the 2030s. In contrast, price parity for most transportation segments is expected in the
2020s in geographies like Europe. Electrification is proceeding rapidly in other vehicular segments
as well, with 30% of existing two- and three-wheeler sales around the world being electric, according
to BNEF. Supporting segments, such as EV batteries and charging infrastructure, are poised for high
growth as well. Demand for EV batteries, for example, is forecast to reach 1,755 GWh in 2030, a 14-
fold increase from 2020 levels. Cumulative investments in EV charging infrastructure are forecast
to reach $500 billion globally by 2040, with China leading in investments until 2025 when the US and
Europe begin to increase their share [22]. Investment opportunities in transportation electrification
Energy Transition Primer | 14are vast, and readers are referred to CREO’s 101 Primer on Transportation & Logistics for a deeper
introduction to opportunities, electric and otherwise, in the sector.
Buildings: Energy-related CO2 emissions from the building sector reached 10 GtCO2e in 2019, their
highest ever level, driven by factors that included demand growth from air conditioning and heating.
Although electricity supplied a third of building energy demand in 2019, fossil fuel share has been
rising at a rate of 0.7% per year since 2010 leading to a steady rise in emissions from the building
sector. Final energy demand in buildings is a function of location, with space and water heating
driving demand in cold climates and water heating and cooking driving demand in warm and
moderate climates. On a global level, building energy intensity (measured in final energy use per m2
of floor space) has been decreasing by 0.5% to 1.0% per year since 2010. This has been outpaced
by annual growth in floor area however, which has averaged 2.5% per year over the same timeframe
[23]. Lowering building energy consumption involves a mix of policy interventions through building
construction and renovation codes, increasing the efficiency of appliances and lighting, and switching
fossil fuel driven applications like boilers and furnaces for electrical alternatives. Investment
opportunities will therefore be specific to geographies that facilitate building decarbonization
policies. Key technologies to electrify energy end-use in buildings include heat pumps (e.g., Dandelion
Energy, a geothermal startup using heat pumps to exchange heat with the ground) and solar thermal
technologies for heating.
Industry: 20% of industrial energy consumption is in the form of electricity, most of which is used in
the manufacturing sector for machine drive applications like motors, conveyor belts, and assembly
lines [24]. Investment and technology development in industrial electrification are driven mostly by
corporations, although early- and growth-stage companies like Infinitum Electric, a manufacturer
of advanced motors, are active in industrial electrification. Key factors influencing industrial
electrification include fossil fuel and electricity prices (fuel costs can be as much as 10-times
higher than capital expenditures over equipment lifetime), equipment useful lifespan, and regulatory
incentives.
3.4 Additional Commentary for Investors
Renewables + Electrify Everything has gained significant traction amongst cleantech investors while
generating compelling returns and a few exits. A popular model among venture capitalists sees funds
use electric utilities as limited partners. Besides their financial backing, these limited partnerships
give portfolio companies access to potential sales pipelines and to corporate and market expertise.
Meanwhile, electric utilities seek to structurally increase their own demand. New York City based
Energy Impact Partners (EIP), for example, manages $1.5 billion on behalf of 30 industrial partners
such as National Grid, Southern Company, and Xcel Energy, and invests in growth-stage companies
across various parts of the energy value chain. Energize Ventures, based in Chicago, invests in
software and asset-light solutions under the Electrify Everything thesis, and is backed by multiple
electric utility companies, institutional investors, and high-net-worth families. Corporate venture
capital funds are active in this space as well, and include companies like National Grid, Schneider
Electric, Shell, and Total S.A., that are making strategic investments in companies across the
Energy Transition Primer | 15electrification value chain. Leading funds investing through the Renewables + Electrify Everything
thesis have recorded gross IRRs in the mid 20% range.
Although the Renewables + Electrify Everything landscape is broad, technological innovation, risk,
and investment flows are not evenly distributed. While digitalization has proven a fertile ground
for private, generalist investors, other segments are better suited to investors with specialized
knowledge. Two experts interviewed for this primer pointed out challenges in investing in battery
storage, for example. Technological defensibility is difficult to establish and maintain with advanced
battery chemistries, and investments in these fields are better suited to investors with significant
experience in deep technology or those with in-house technical expertise. Commercialization and
high CAPEX costs associated with battery manufacturing are other barriers to companies in this
space, as are local market and regulatory risks for manufacturing facilities.
Software and digitalization have their own challenges as well, brought on primarily by the breadth
of technologies. Investors without prior experience in the space can partner with specialist firms
for expertise and deal flow or bring in expertise from the utility industry to their investment teams
to address these issues. Certain end-use sectors can be challenging to navigate as well. In logistics
and ports, for example, electrification faces hurdles such as the need for high asset utilization rates
as well as difficulties with maintenance and higher up-front costs of electrified equipment. The
latter has led to operators relying on state-sponsored grants, which have finite lifetimes. Investors
looking to tap these segments of the value chain are usually closely connected to the relevant end-
use industry, and invest in hardware solutions like electrified forklifts, cranes, and other equipment.
Ineffective policy can also be a hindrance—when electrification goals vary by geography, less-
stringent geographies can attract logistics operators looking to avoid the higher costs of equipment
electrification. Even in more attractive investment areas, such as smart grid and digitalization,
investors point out that a growing number of new companies and increasing valuations are making
it harder to identify and back winners. One investor pointed to a 2x rise in early-stage company
valuations over the past year, part of a trend which seems to be apparent in North America as well
as Europe. And although investment opportunities in renewable energy infrastructure and distributed
energy generation are significant in developing countries experienced investors point to significant
government and regulatory hurdles and emphasize the need for local experience.
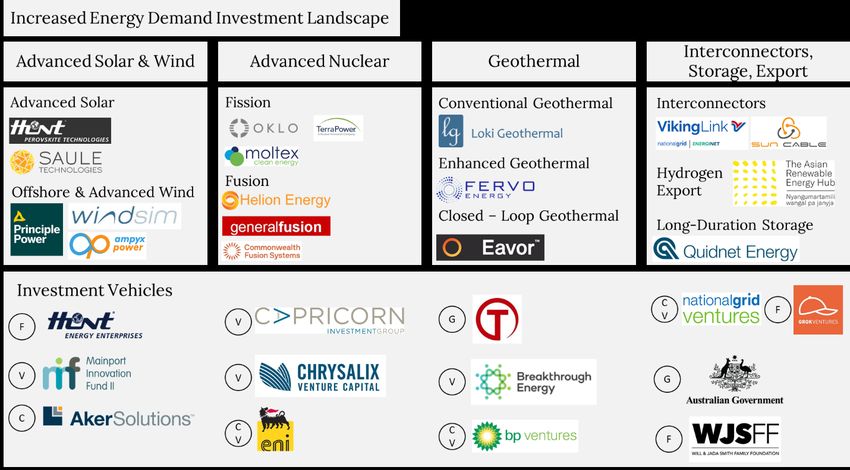
4. Hard-to-Electrify Sectors
In 2018, energy-related emissions from the hard-to-abate sectors of iron and steel manufacturing,
cement, shipping, aviation, and long-haul road transport stood at approximately 13 GtCO2e, or
about 38% of global energy-related CO2 emissions. Displacing fossil fuel use from these sectors
is challenging because of the need for energy density, which prevent batteries and electrification
from playing a more direct role, and the inability of electric technology to generate the temperatures
required by manufacturing processes (called high-temperature heat). However, the imperative behind
decarbonizing these sectors is clear. Estimates from the World Steel Association pegged global steel
demand in 2020 at 1.7 Gt, and forecasts suggest 1% annual growth up to 2040 [25]. IEA estimates
place global cement production in 2019 at 4.1 Gt and expect it to experience a 23% increase by 2050,
Energy Transition Primer | 16driven by population increases and urbanization [26]. The US Energy Information Administration
forecasts strong demand growth for jet fuel, driven by both commercial freight and passenger travel.
Demand is forecast to more than double between 2018 and 2050, with non-OECD nations being the
main contributors to this growth. China and SE Asia will contribute heavily to this growth as their
middle classes expand.
While energy and material efficiency are essential first steps in countering emissions from these
sectors, their effectiveness is limited by manufacturing process efficiency limits, process emissions,
and rising forward demand. Complete decarbonization by fossil-fuel displacement may not be viable
for a long time. In many cases, the required technologies do not exist (e.g., a means to electrify
cement production), exist only at the demonstration or pilot scale (e.g., electrolytic steel production),
or are more expensive than fossil-fuel incumbents (e.g., synthetic aviation fuel). Finally, even if
solutions should become available sooner, the long life of many industrial manufacturing assets,
alongside established supply chains and supporting infrastructure hinder their replacement.
Interest is growing in using hydrogen to decarbonize the hard-to-abate sectors. Hydrogen is an
attractive candidate thanks to its high energy density (120 MJ/kg, compared to 45.8 MJ/kg for
gasoline and 24 MJ/kg for coal) and capability of producing high-temperature heat for industrial
processes. However, hydrogen’s low volumetric density introduces challenges in transportation
and storage. Hydrogen can also replace coal as a reducing agent in steel making and be used as
a feedstock for ammonia production—a potential alternative fuel for shipping as well as a route to
decarbonizing the agriculture sector.
4.1 Chemicals
Chemical manufacturing consumes a significant amount of fossil fuel for chemical feedstock
and for energy. Decarbonizing chemicals manufacturing is challenging for several reasons. Aside
from the requirement of high temperature heat to run steam crackers (which break down complex
hydrocarbon molecules into simpler primary chemicals), existing, fossil-fuel driven manufacturing
plants are often fully depreciated and benefit from economies of scale that drive down OPEX.
New technologies producing commodity chemicals require up-front capital expenditure to develop
manufacturing infrastructure, costs that are often not incorporated in unit economics comparisons
by entrepreneurs and investors. Most such chemicals are traded on highly competitive and globalized
markets at razor-thin margins. Finally, there is no ready substitute for the hydrocarbon feedstocks
themselves, although attempts at producing synthetic feedstocks (such as from atmosphere-
captured CO2 and electrolytic hydrogen) are gaining momentum, as are bio-based, biodegradable,
and recyclable (BBR) materials.7 Early- and growth-stage investment opportunities exist in alternative
feedstocks, sustainable materials, and advanced catalysis companies, though electrification of the
chemicals sector is currently driven by industrial partnerships such as the Cracker of the Future
Consortium (which includes bp, BASF, Borealis, Total, and other petrochemical companies) and a
7 Readers are referred to CREO’s 101 Primer on Sustainable Materials for an overview of opportunities in this sector.
Energy Transition Primer | 17partnership between Dow Chemical and Shell to develop an electric ethylene cracker [27].
4.2 Iron and Steel
The iron and steel industry consumes significant quantities of coal, which aside from providing the
high temperature heat needed for the process also acts as a reducing agent to convert iron ore to
iron. The sector consumed 22% of industrial energy in 2019, and 8% of total final energy, making
its decarbonization a vital component of the energy transition. The sector accounted for 28% of
industrial CO2 emissions in 2019, amounting to 2.6 Gt [28]. Short-term solutions for replacing coal
in steelmaking are scarce, and deep decarbonization of the steel sector will likely rely on Carbon
Capture, Utilization, and Storage (CCUS).8 Electrolytic hydrogen can completely replace coal in
primary steel production while requiring no change in existing equipment and reducing process
energy requirements by 30% in blast furnaces. The IEA projects that this technology could reach wide
deployment in the mid-2030s. Like the chemicals sector, there are currently few private investment
opportunities in companies developing alternative steelmaking processes. A notable exception is
Boston Metal, an early-stage company spun off from MIT, which has developed an electricity-powered
metals production process called Molten Oxide Electrolysis (MOE). Boston Metal has raised at least
$76 million to-date from investors that include Breakthrough Energy Ventures and Prelude Ventures.
Companies operating in the broader hydrogen and biomass value chains could cater to the iron
and steel industry and could create pathways for investors seeking equity investments. Sunfire, for
example, is a growth-stage electrolyzer company based out of Germany that is deploying its HyLink
electrolyzers to produce green hydrogen for annealing steel. Sunfire has raised at least €39m and
closed a March 2020 corporate investment round from Finnish refining company Neste. Energy
and emissions savings can also be achieved through materials efficiency as a first step. Sortera
Alloys, for example, is an early-stage venture-backed company that uses machine learning, artificial
intelligence, and optical sensors to enhance the sorting of scrap metal for recycling and domestic
manufacturing. Corporate interest in steel decarbonization has been strong, such as through the
HYBRIT project, a SEK 1.4 billion (USD 166m) joint venture between the Swedish companies LKAB,
SSAB, and Vattenfall, that uses green hydrogen as a reducing agent, followed by the production of
crude steel using an electric arc furnace (EAF).
4.3 Cement
Energy consumption in the manufacture of cement primarily goes towards the production of clinker,
cement’s key ingredient, from limestone by heating it to high temperatures in kilns. This process is
fueled by coal; substituting coal for other fuels or energy carriers is immensely challenging due to
very specific requirements of the kilns, the need to reengineer many of the core technologies such
as kiln burners, and thermodynamic limitations. Although substituting for fossil fuels in cement
production may not yet be feasible, the use of CCUS technologies shows promise to reduce cement
emissions over time. Another alternative is modification of the cement manufacturing process itself,
8 Key technologies that could facilitate a net-zero future for the steelmaking industry include Natural Gas based Direct Reduced Iron with CCUS, Electrolytic
Hydrogen Based Reduction, Oxygen Rich Smelting Reduction with CCUS, and Blast Furnaces with CCUS.
Energy Transition Primer | 18using alternative materials such as industrial fly ash or geopolymers to reduce the carbon intensity
of cement, or replacing concrete altogether. The low-carbon concrete investment ecosystem is very
active, with several early- and growth-stage companies raising venture capital (e.g., CarbonCure
Technologies, Solidia Technologies Inc., Carbicrete) and trading on public exchanges (e.g., Calix
Limited, ASX: CXL).
4.4 Long-Haul Transport, Shipping, and Aviation
Long-Haul Transport, Shipping, and Aviation produced 3.5 GtCO2e of emissions in 2018, representing
roughly 10% of global energy-related emissions. High energy-density of the chosen fuel source is
of primary importance, especially in aviation, making electrification of long-haul routes through
batteries impossible. Heavy battery packs are similarly inefficient for long-haul road transport and
trucking, where excess loads and long recharging times hamper efficiency.9 Hydrogen fuel cells are a
promising option to decarbonize long-haul trucking, due to their high energy density and fast refueling
times. In shipping, the backbone of global trade, energy dense fuel oil is difficult to displace due to
the higher costs of alternatives, and the long replacement cycles of existing assets. The combined
need for a highly energy-dense fuel type, together with the high utilization times of these assets make
electrification through batteries, with their low energy density and relatively longer recharge times,
comparatively inefficient. In time, ammonia could prove a substitute fuel, especially if produced via
green hydrogen, though this is currently uneconomic. Synthetic aviation fuel is currently the only
clear path to decarbonizing long-distance flight. Although complete decarbonization is unlikely in
the short term, private investment opportunities exist across growth stages that address short-haul
flights, electrified short-route shipping, and hydrogen fuel cell vehicles. Examples include Fjord1, a
Norwegian company providing electrified ferry services, backed by Vision Ridge Partners, a US-based
private equity firm, and ZeroAvia, a California-based, early-stage aviation company using hydrogen
fuel-cells to power short-haul aircraft drivetrains. ZeroAvia has received backing from a number of
investors, including Breakthrough Energy Ventures, Shell Ventures, SystemIQ, and the UK government.
Hyzon Motors, a supplier of hydrogen fuel cell heavy vehicles including trucks and coaches, secured
financing from Total Carbon Neutrality Ventures and the Hydrogen Ascent Fund in early 2020, and
has since announced a SPAC merger in February 2021 (NASDAQ: DCRB). Synthetic fuels are gaining
significant private investment, with examples that include venture-backed Canadian DAC company
Carbon Engineering, and US-based CO2-to-fuels company LanzaJet, which raised $85 million in June
2020 from Japanese trading firm Mitsui & Co., Suncor Energy, and All-Nippon Airways. Infinium, a
synthetic fuels manufacturing company, recently raised funds from backers including the Amazon
Climate Pledge Fund and the Grantham Environmental Trust.
4.5 Additional Commentary for Investors
Despite its promise to decarbonize the hard-to-abate sectors, the utility of hydrogen (and derivative
energy carriers like ammonia and synthetic fuels) is currently limited to niche applications, and the
9 The latter is not as much of a constraint in certain geographies however, such as in parts of Europe where labor regulations mandate periods of rest time
for truck drivers that could be used for charging.
Energy Transition Primer | 19buildout of a larger market is in its earliest stages. However, early momentum around hydrogen is
very strong, and estimates suggest that the total investment opportunity in hydrogen up to 2030
could be as high as $475 billion [29]. Hydrogen is seeing growing interest among private investors
as well. HydrogenOne Capital, a London-based £250 million fund, will make equity investments in
publicly listed hydrogen-focused energy companies [30], and AP Ventures, a UK-based investor,
secured $200 million in fund commitments from institutional partners to invest in hydrogen
infrastructure, fuel-cell mobility technology, and energy storage [31] in 2018.
Investors with experience in the sector suggest that the prior false starts of the industry will
be countered by strong policy support and project infrastructure buildout. Companies working
in hydrogen production, especially green, will be well poised to take advantage of these trends,
though investors caution that rising valuations and a rapidly growing number of early-stage
electrolyzer companies could portend a “bubble” and subsequent valuation corrections, with blue
hydrogen playing a more important role in the near-term than is widely accepted. Given the highly
industry-specific contexts of many of hydrogen’s use cases, opportunities in this ecosystem are
being approached via strategic institutional investments in specialized funds. Co-investments
with industrial partners is another option, especially for family offices with greater flexibility than
Figure 5: Investment landscape for hard-to-electrify sectors showing technology companies, integrated projects (blue and green hydrogen), and investment
vehicles. CV - Corporate Venture Capital; V - Venture Capital; C - Corporation; A - Accelerator; PE - Private Equity; F - Family Office
Energy Transition Primer | 20You can also read