PUE: A COMPREHENSIVE EXAMINATION OF THE METRIC
←
→
Page content transcription
If your browser does not render page correctly, please read the page content below
WHITE PAPER #49
PUE™: A COMPREHENSIVE
EXAMINATION OF THE METRIC
EDITORS:
Victor Avelar, Schneider Electric
Dan Azevedo, Disney
Alan French, Emerson Network Power
2012 The Green Grid. All rights reserved. No part of this publication may be used, reproduced, photocopied, transmitted, or stored in any
retrieval system of any nature without the written permission of the copyright owner.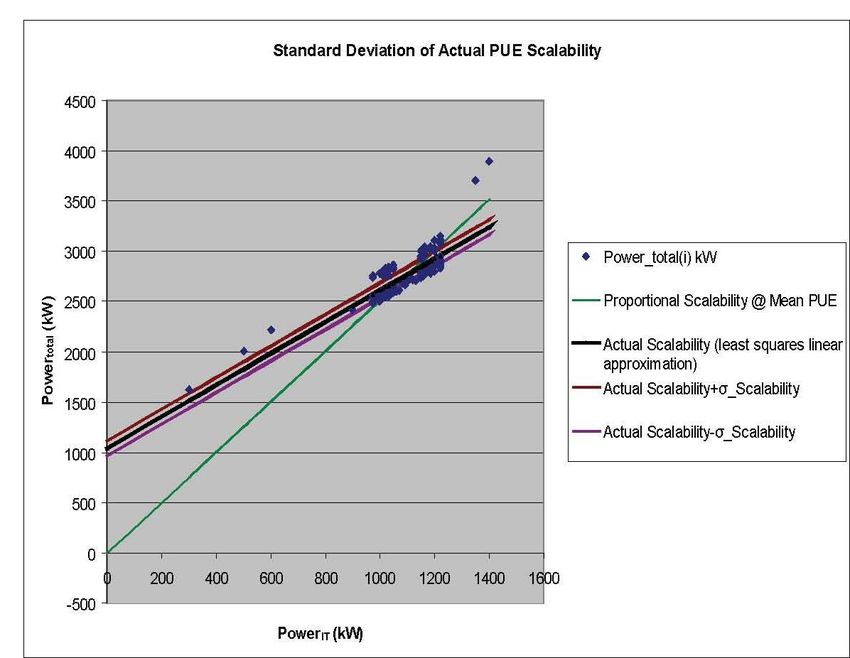
PAGE 2
The Green Grid Association would like to thank the following people for contributing
to this and other PUE-related materials over the last several years.
CONTRIBUTORS:
Hugh Barrass, Cisco Eric Jewitt, Nationwide
Christian Belady, Microsoft Christine Long, APC
Stephen Berard, Microsoft Bob MacArthur, EMC
Mark Bramfitt, PG&E Phil Morris, Sun Microsystems
Tahir Cader, Hewlett-Packard Zeydy Ortiz, IBM
Henry Coles, Lawrence John Pflueger, Dell
Berkeley National Laboratory Andy Rawson, AMD
Jud Cooley, Oracle Jim Simonelli, APC
Lex Coors, Interxion Harkeeret Singh, BT
Tommy Darby, TI Roger Tipley, Hewlett-Packard
Jamie Froedge, Emerson Robert Tozer, Hewlett-Packard
Network Power Gary Verdun, Dell
Nick Gruendler, IBM John Wallerich, Intel
Jon Haas, Intel Randall Wofford, Dell
[Please note: Contributors are listed with The Green Grid member company they worked for at the time
of their contribution.]
2012 The Green Grid. All rights reserved. No part of this publication may be used, reproduced, photocopied, transmitted, or stored in any
retrieval system of any nature without the written permission of the copyright owner.
PAGE 3 Executive Summary Power usage effectiveness (PUE™) has become the industry-preferred metric for measuring infrastructure energy efficiency for data centers. The PUE metric is an end-user tool that helps boost energy efficiency in data center operations. It was developed by The Green Grid Association, a non-profit, open industry consortium of end users, policy makers, technology providers, facility architects, and utility companies working to improve the resource efficiency of information technology and data centers throughout the world. Since its original publication in 2007, PUE has been globally adopted by the industry. Over the past years, The Green Grid has continued to refine the metric measurement methodology with collaborative industry feedback. This collective work has been brought together here to simplify the absorption and use of the PUE metric. To produce this document, The Green Grid consolidated all its previously published material related to PUE and included new material as well. This document supersedes prior white papers and consolidates all things that The Green Grid has developed and published relating to PUE. As such, this document is recommended by The Green Grid to those implementing, using, and reporting PUE. Quick access to various levels of information is provided via the links embedded throughout the document. This document allows executives to gain a high level of understanding of the concepts surrounding PUE, while providing in-depth application knowledge and resources to those implementing and reporting data center metrics. 2012 The Green Grid. All rights reserved. No part of this publication may be used, reproduced, photocopied, transmitted, or stored in any retrieval system of any nature without the written permission of the copyright owner.

PAGE 4
Table of Contents
Executive Summary .................................................................................................................................................... 3
I. Introduction ........................................................................................................................................................ 6
II. Metric List and Intended Use ........................................................................................................................... 9
III. An Overview of PUE ......................................................................................................................................... 10
3.1 PUE DEFINITION ....................................................................................................................................... 11
IV. More About PUE............................................................................................................................................... 12
4.1 PUE CALCULATION CONSIDERATIONS .................................................................................................... 13
4.2 PUE MEASUREMENT LEVELS .................................................................................................................. 14
4.3 COMPONENT CLASSIFICATION ................................................................................................................ 17
4.4 MEASURING ENERGY USAGE .................................................................................................................. 20
4.5 FACTORS AFFECTING PUE ....................................................................................................................... 26
4.6 SOMETIMES PUE SEEMS TO GO THE WRONG WAY ............................................................................... 28
4.7 IMPROVING PUE ....................................................................................................................................... 28
4.8 PARTICIPANTS IN AND INFLUENCES ON THE DEVELOPMENT OF PUE ................................................. 29
4.9 SOURCE ENERGY ..................................................................................................................................... 31
4.10 ENERGY OR POWER ................................................................................................................................. 33
V. Example Calculations—How to Measure PUE .............................................................................................. 34
5.1 HOW TO MEASURE PUE IN A DEDICATED DATA CENTER FACILITY ....................................................... 35
5.2 HOW TO MEASURE PUE IN A MIXED-USE BUILDING .............................................................................. 42
VI. How to Report PUE .......................................................................................................................................... 47
6.1 REQUIREMENTS FOR THE ACKNOWLEDGEMENT OR REGISTRATION OF PUE RESULTS .................... 49
6.2 PUE NOMENCLATURE .............................................................................................................................. 52
6.3 SUPPORTING DATA REQUIRED FOR REPORTED, REGISTERED, & CERTIFIED PUE MEASUREMENTS 54
6.4 ADDITIONAL DETAILS ON THE PUE REPORTING GUIDELINES ............................................................... 55
6.5 REPORTING RESULTS TO THE GREEN GRID ........................................................................................... 56
6.6 COMMON ISSUES WITH REPORTING OR INTERPRETING PUE............................................................... 56
VII. Partial PUE ....................................................................................................................................................... 59
7.1 DEFINITION OF PARTIAL PUE ................................................................................................................... 60
7.2 MATHEMATICAL RELATIONSHIP TO PUE ................................................................................................. 63
VIII. PUE Scalability and Statistical Analyses ...................................................................................................... 69
8.1 PROPORTIONAL DATA CENTER POWER SCALABILITY ............................................................................ 70
2012 The Green Grid. All rights reserved. No part of this publication may be used, reproduced, photocopied, transmitted, or stored in any
retrieval system of any nature without the written permission of the copyright owner.
PAGE 5
8.2 DETERMINING ACTUAL PUE SCALABILITY ............................................................................................... 71
8.3 STATISTICAL ANALYSES OF DATA ............................................................................................................ 73
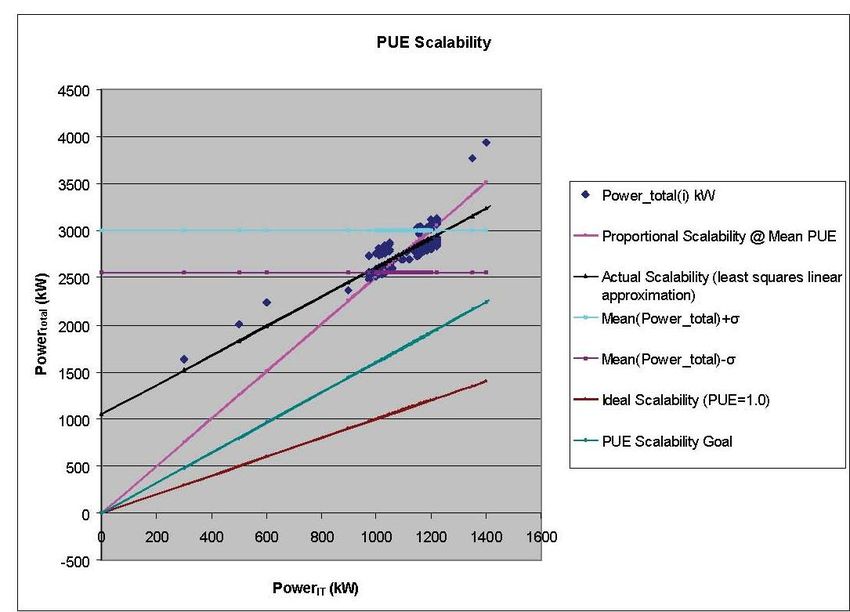
8.4 PUE SCALABILITY ...................................................................................................................................... 76
8.5 INTERPRETING PUE SCALABILITY ............................................................................................................ 79
IX. Conclusion ........................................................................................................................................................ 80
X. References ....................................................................................................................................................... 82
XI. About The Green Grid ...................................................................................................................................... 83
2012 The Green Grid. All rights reserved. No part of this publication may be used, reproduced, photocopied, transmitted, or stored in any
retrieval system of any nature without the written permission of the copyright owner.
PAGE 6
I. Introduction
The Green Grid Association (TGG) works to improve the resource efficiency of information technology (IT) and
data centers throughout the world. In 2007, The Green Grid published two “self-help” data center energy
efficiency metrics for end users: power usage effectiveness (PUE™) and its inverse, data center infrastructure
efficiency (DCiE™). Since the original publications, PUE has surpassed DCiE in industry adoption. In fact, PUE is
currently viewed as the industry-preferred metric for measuring infrastructure energy efficiency in data centers.
In 2009, The Green Grid—in collaboration with organizations around the globe—began driving toward a set of
metrics and indices that can be formally adopted by all participating organizations to improve worldwide data
center energy efficiency. As a result, global agreement has been reached that affirms PUE as the industry’s
preferred data center infrastructure efficiency metric. The following are the two task forces and supporting
organizations1 that have agreed on the PUE metric, measurement methodology, and reporting convention:
Data Center Metrics Coordination Task Force (U.S. Regional Task Force)
7x24 Exchange
The American Society of Heating, Refrigeration, and Air Conditioning Engineers (ASHRAE)
The Green Grid
Silicon Valley Leadership Group
Uptime Institute
U.S. Department of Energy Save Energy Now and Federal Energy Management Programs
U.S. Environmental Protection Agency’s ENERGY STAR Program
U.S. Green Building Council
Global Harmonization of Data Center Efficiency Metrics Task Force (Global Task Force)
European Commission – Joint Research Centre Data Centers Code of Conduct
The Green Grid
Green IT Promotion Council, Japan
Ministry of Economy, Trade, and Industry, Japan
1 For additional information on task force activities, see
www.thegreengrid.org/Home/alliances/HarmonizationOfMetrics.aspx
2012 The Green Grid. All rights reserved. No part of this publication may be used, reproduced, photocopied, transmitted, or stored in any
retrieval system of any nature without the written permission of the copyright owner.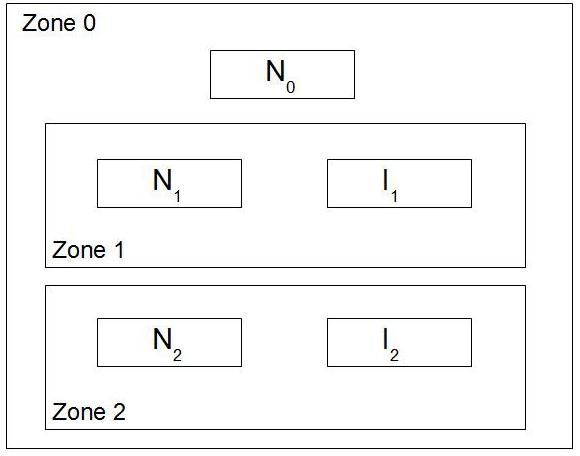
PAGE 7
U.S. Department of Energy Save Energy Now and Federal Energy Management Programs
U.S. Environmental Protection Agency’s ENERGY STAR Program
PUE is an excellent metric for understanding how well a data center is delivering energy to its information
technology equipment. The metric is best applied for looking at trends in an individual facility over time and
measuring the effects of different design and operational decisions within a specific facility.
Therefore, comparing two data centers based on public reports of their PUE results was not initially
recommended because many attributes of data center design, engineering, implementation, and operations
affect PUE. However, since the original publications, the industry has globally adopted the PUE metric and
begun to compare PUEs among data centers, raising further questions around how to interpret individual
results, how to compare different results for the same data center, and how to compare results across
different data centers. As there are various ways to calculate PUE, stakeholders in the industry have expressed
concerns around the consistency and repeatability of publicly reported measurements. In response, The Green
Grid has published a set of rules and guidelines regarding the process that organizations should follow when
making public claims regarding their data centers’ PUE measurements and has provided a free PUE reporting
tool.2 Section VI of this document outlines the PUE reporting requirements and also includes the definition of
standard nomenclature that will enable individual claimants to communicate key information about their
measurements.
Standardized PUE nomenclature, proper and transparent public reporting guidelines, and the availability of key
information about reported results will enhance both the credibility and usefulness of the PUE metric. To
further enable equitable comparison of PUE results among data centers, additional attributes, such as age,
geographic location, capacity loading, size of facility, and the like, should be taken into consideration.
Provided the measurement guidelines, reporting guidelines, and the additional data attributes (as mentioned
above) are obtained, The Green Grid believes PUE can be used to compare data center infrastructure
efficiency.
2 www.thegreengrid.org/register/pue-reporting-form.aspx
2012 The Green Grid. All rights reserved. No part of this publication may be used, reproduced, photocopied, transmitted, or stored in any
retrieval system of any nature without the written permission of the copyright owner.PAGE 8 The PUE metric is associated with the data center infrastructure. PUE is not a data center productivity metric, nor is it a standalone, comprehensive efficiency metric. PUE measures the relationship between the total facility energy consumed and the IT equipment energy consumed. When viewed in the proper context, PUE provides strong guidance for and useful insight into the design of efficient power and cooling architectures, the deployment of equipment within those architectures, and the day-to-day operation of that equipment. Changes in PUE are most meaningful when they are seen as the data center’s response to changes in infrastructure equipment or infrastructure operations. Studies investigating the effect on PUE of changes in infrastructure equipment or operations should ensure that any changes occurring to the IT load over the study’s period of time are properly accounted. This document provides guidelines for determining the PUE of a dedicated data center and that of a mixed-use facility or specialized facility, along with results, scalability analyses, and case studies. It also outlines the approach to reuse waste heat. Issues such as availability of equipment and the productivity of the data center require different metrics and different analyses. Data centers are complex systems. Frequently, changing certain aspects of the facility (e.g., commissioning a new class of server) can produce apparent changes in PUE results for another aspect of the facility. The Green Grid advises data center owners and operators to take the greatest care around issues of availability. If an action or initiative taken to improve PUE has a negative effect on the availability of the IT equipment in the data center, owners and operators should review the potential impact on the data center and determine whether or not to proceed any further with that action or initiative. In addition, PUE does not provide any guidance or insight into the operation or productivity of IT equipment. The Green Grid is currently investigating additional metrics and approaches to provide guidance and insight into these areas.3 It is also possible, even likely, that changes in the deployment or operation of IT equipment will affect PUE results. For example, organizations implementing virtualization in their data centers may reduce overall IT load but see an increase in PUE. In these instances, the fixed overhead for power distribution and cooling has not changed, but the reduction in IT load delivers a seemingly poorer PUE result. PUE metric users 3 The Green Grid, Proxy Proposals For Measuring Data Center Productivity White Paper #17 (2009) www.thegreengrid.org/Global/Content/white-papers/Proxy-Proposals-for-Measuring-Data-Center-Efficiency 2012 The Green Grid. All rights reserved. No part of this publication may be used, reproduced, photocopied, transmitted, or stored in any retrieval system of any nature without the written permission of the copyright owner.
PAGE 9
should not become overly concerned when changes in one area affect results in another, but rather consider
the factors that contributed to the PUE increase as further opportunities for improvements.
Source energy represents the total amount of raw fuel that is required to operate the data center and includes
transmission, delivery, and production losses. A source energy–based PUE must be used when energy sources
other than electricity are delivered to the data center. The Green Grid’s recommended approach for measuring
and calculating PUE by source energy will yield the same output as an all-electric data center calculating a site-
based PUE. Please see section 4.9 for more information.
Numerous underlined internal references have been incorporated and linked throughout this document with a
goal of maintaining an executive overview of each metric and key topic, while enabling end users and
operators to obtain more detailed information, including implementation data, lessons learned, and best
practices. This also allows those in particular verticals (e.g., government or healthcare) and business areas
(e.g., executive management, marketing, or sales) to pull the level of information required in a quick and
efficient manner. This is intended to enhance the use of this document and of PUE-related metrics.
II. Metric List and Intended Use
PUE for a dedicated building is the total facility energy divided by the IT equipment energy. PUE is an end-user
metric used to help improve energy efficiency in data center operations. (Please see section 5.1 for more
information.)
PUE for a data center in a mixed-use facility is highlighted in this document due to the need voiced
throughout the industry to better define the contributions of data center total energy within a mixed-use facility.
This refers to a data center that is located within a larger building that may support other functions. For
example, a data center may occupy a single floor within a larger office building that contains some combination
of non-IT operations, such as general administrative office space. A mixed-use facility may have its own
dedicated infrastructure (including uninterruptible power supply [UPS] and cooling systems) or may have
shared infrastructure. Because the majority of data centers are within mixed-use facilities, this section of the
document provides practical guidelines on how to measure the PUE contribution of shared infrastructure
resources. (Please see section 5.2 for a more in-depth discussion.)
Partial PUE (pPUE™) allows a data center manager to focus on the energy efficiency of a particular portion of
the data center or mixed-use facility. This may be needed because some measurements of the total data
2012 The Green Grid. All rights reserved. No part of this publication may be used, reproduced, photocopied, transmitted, or stored in any
retrieval system of any nature without the written permission of the copyright owner.PAGE 10 center energy are unobtainable (because of a leasing arrangement, for example). Partial PUE is the total energy inside a boundary divided by the IT equipment energy inside the boundary. (Please see section VII for details.) The PUE Scalability and statistical analysis metrics provide scalability metrics associated with changes in IT loads typically seen in the data center. PUE Scalability is used to show how well a data center’s total energy consumption scales with changes in its IT equipment loads. (These metrics are described in section VIII.) Data center infrastructure efficiency (DCiE) is the inverse of PUE: it is IT equipment energy divided by total facility energy. Since The Green Grid’s introduction of these two metrics, PUE has surpassed DCiE in industry adoption. Moving forward, The Green Grid will use PUE and views it as the industry-preferred metric for measuring infrastructure energy efficiency in data centers. III. An Overview of PUE The Green Grid believes that metrics can help data center owners and operators better understand and improve the energy efficiency of their existing data centers, as well as help them make better decisions on new data center deployments. In addition, these metrics provide a dependable way to measure results against comparable IT organizations. Why the need for greater energy efficiency? Because data center power and cooling are two of the biggest issues facing IT organizations today, and growing companies need a way to control these costs while enabling future expansion. Many traditional businesses are migrating their data to digital form and leveraging technology as a key business enabler. With more efficient data centers, IT organizations can better manage increased computing, network, and storage demands, cut energy costs, and reduce total cost of ownership (TCO)—all while remaining competitive and able to meet future business needs. 4 The Green Grid recognizes the importance of establishing metrics for data center efficiency and offers guidance on technologies that claim to improve performance-per-watt. Ideally, these metrics, tools, and 4 Patterson, M.K., Costello, D., Grimm, P., Loeffler, M. “Data Center TCO; A Comparison of High-density and Low-density Spaces.” THERMES 2007, Santa Fe, NM (2007) 2012 The Green Grid. All rights reserved. No part of this publication may be used, reproduced, photocopied, transmitted, or stored in any retrieval system of any nature without the written permission of the copyright owner.
PAGE 11
associated processes will help organizations determine if an existing data center can be optimized before a
new data center is needed.
3.1 PUE DEFINITION
PUE is defined as the ratio of total facilities energy to IT equipment energy, as shown in Equation 1 below.
Equation 1
Total facility energy is defined as the energy dedicated solely to the data center (e.g., the energy measured at
the utility meter of a dedicated data center facility or at the meter for a data center or data room in a mixed-
use facility). The IT equipment energy is defined as the energy consumed by equipment that is used to
manage, process, store, or route data within the compute space.
It is important to understand the components for the energy in these measurements, which can be described
as follows:
IT equipment energy includes the energy associated with all of the IT equipment (e.g., compute,
storage, and network equipment) along with supplemental equipment (e.g., KVM switches, monitors,
and workstations/laptops used to monitor or otherwise control the data center).
Total facility energy includes all IT equipment energy as described in the bullet above plus everything
that supports the IT equipment using energy, such as:
Power delivery components, including UPS systems, switchgear, generators, power distribution
units (PDUs), batteries, and distribution losses external to the IT equipment
Cooling system components, such as chillers, cooling towers, pumps, computer room air handling
units (CRAHs), computer room air conditioning units (CRACs), and direct expansion air handler
(DX) units
Other miscellaneous component loads, such as data center lighting
A more detailed component classification is provided in section 4.3.
2012 The Green Grid. All rights reserved. No part of this publication may be used, reproduced, photocopied, transmitted, or stored in any
retrieval system of any nature without the written permission of the copyright owner.PAGE 12
IV. More About PUE
PUE provides a way to determine:
Opportunities to improve a data center’s operational efficiency
How a data center compares with similar data centers
If the data center operators are improving the designs and processes over time
Opportunities to repurpose energy for additional IT equipment
A design target or goal for new data centers
PUE can be used to illustrate a data center’s energy allocation. For example, a PUE of 3.0 indicates that the
data center total energy usage is three times greater than the energy usage for the IT equipment alone. In
addition, PUE can be used as a multiplier to help understand the real impact of an IT component’s energy use.
PUE: Power Usage Effectiveness
Building Load
Demand from grid
Total Power IT IT Load
Facility • Switchgear Equipment • Servers
Energy • UPS Energy • Storage
• Battery • Telco
backup equipment
• Etc. • Etc.
Cooling
• Chillers
• CRACs
• Etc.
Total Facility Energy
PUE =
IT Equipment Energy
Figure 1. Illustration of how PUE would be calculated in a data center
2012 The Green Grid. All rights reserved. No part of this publication may be used, reproduced, photocopied, transmitted, or stored in any
retrieval system of any nature without the written permission of the copyright owner.PAGE 13 In Figure 1, total facility energy is measured at or near the facility’s utility meter(s) to accurately reflect the energy entering the data center. This measurement should represent the total energy used in the data center. The data center–only portion of a facility’s utility meter should be measured, since including in the calculation any energy that is not intended to be used in the data center would result in a faulty PUE metric. For example, if a data center resides in an office building, the total energy drawn from the utility will be the sum of the total facility energy for the data center and the total energy used by the non-data center offices in the building. In this case, the data center administrator could measure and subtract the amount of energy being used by the non-data center offices in order to calculate an accurate PUE. IT equipment energy should be measured after all facility power conversion, switching, and conditioning is completed and before the energy is used by the IT equipment itself. The most likely measurement point is at the output of the computer room PDUs. This measurement should represent the total energy delivered to the compute equipment racks in the data center. PUE values can range from 1.0 to infinity. Ideally, a PUE value approaching 1.0 would indicate 100% efficiency (i.e., all energy is used by IT equipment only). Currently, there is no comprehensive data set that shows the true spread of PUE for data centers. Some work indicates that many data centers may have a PUE of 3.0 or greater, but, with proper design, a PUE value of 1.6 (or better) should be achievable.5 This is supported by measurements completed by Lawrence Berkeley National Labs,6 which show that 22 data centers measured had PUE values in the 1.3 to 3.0 range. 4.1 PUE CALCULATION CONSIDERATIONS A mixed-use building may house any number of functions, such as data center(s), labs, offices, etc. For mixed- use facilities, determining the energy usage of just the data center environment may be difficult. This is particularly true when the utility power grid enters the building through a single entrance point (e.g., a utility 5 Belady, C., “Getting the Most Out of Your Data Center.” AFCOM Data Center World presentation (March 2007) ftp://ftp.compaq.com/pub/products/servers/afcom-032607-final.pdf 6 Greenberg, S., Mills, E., Tschudi, W., Rumsey, P., and Myatt, B., “Best Practices for Data Centers: Lessons Learned from Benchmarking 22 Data Centers.” Proceedings of the 2006 ACEEE Summer Study on Energy Efficiency in Buildings (2006) http://hightech.lbl.gov/presentations/datacenter-2006aceee.ppt 2012 The Green Grid. All rights reserved. No part of this publication may be used, reproduced, photocopied, transmitted, or stored in any retrieval system of any nature without the written permission of the copyright owner.
PAGE 14
room) and is then distributed to various building locations. These building configurations also make it difficult
to determine the losses between the power entry into the building and its delivery to the data center.
To further complicate PUE calculation, some cooling technologies integrate cooling elements such as pumps,
refrigeration, blowers, and heat exchangers within the IT equipment itself. These technologies blur what has
traditionally been a clear delineation between facility equipment and IT equipment. However, equipment used
to provide power and cooling to the data center must be accounted for in the metrics described in this
document.
As part of its ongoing effort to promote continuous efficiency improvements in the data center, The Green Grid
provides clearer distinctions between facility and IT equipment and recommends the use of energy measuring
techniques throughout the data center, as well as for the equipment itself. This document covers these
subjects in greater detail in the following sections.
4.2 PUE MEASUREMENT LEVELS
A three-level approach for measuring PUE, which includes basic, intermediate, and advanced levels of
measurements is outlined in Table 1, below. The diagram (Figure 2) that follows the table shows a typical data
center with measurement points identified for the proposed PUE measurement levels listed in Table 1. These
points are indicated by meters in the diagram, which bear their associated Level 1 through Level 3 (L1 to L3)
labels.
Table 1. High-level breakdown of The Green Grid’s three-level approach to PUE measurement
Level 1 (L1) Level 2 (L2) Level 3 (L3)
Basic Intermediate Advanced
IT Equipment Energy UPS Outputs PDU Outputs IT Equipment Input
Total Facility Energy Utility Inputs Utility Inputs Utility Inputs
Measurement Interval Monthly/Weekly Daily/Hourly Continuous
(15 minutes or less)
2012 The Green Grid. All rights reserved. No part of this publication may be used, reproduced, photocopied, transmitted, or stored in any
retrieval system of any nature without the written permission of the copyright owner.PAGE 15
Note: To report Level 1, Level 2, or Level 3, the required measurement location for that level must be used. For
example, Level 2 must be measured at the PDU output and utility input. If measurements are made using
power (versus energy), then the “measurement interval” is also required to report a certain level.
Additional measurement points are recommended to provide further insight into a data center infrastructure’s
energy efficiency. Monitoring various components of the mechanical and electrical distribution will provide
further insight as to the large energy consumers and where possible efficiency gains can be made (e.g.,
chillers, pumps, towers, PDUs, switchgear, etc.).
Backup Backup Backup
A Utility metering point Generator Generator Generator
AC 2 MW 2 MW
2 MW
Substation
15 kV – 480 V / 277 V
L1, L2, L3
Utility Feed
Generator Switchgear
ATS ATS
2500A Automatic Automatic ATS
2500A
Transfer Transfer 2500A
Switch Switches
Standby Switchboard 2500 A, 480 V
Mechanical Mechanical
Switch Gear Switch Gear
UPS UPS UPS UPS Mechanical Mechanical
B Side A Side A Side A Side Equipment Equipment
320 kW 400 kW 400 kW 400 kW
400 kVA 500 kVA 500 kVA 500 kVA
B
L 1 Building Building
Management Management
Facility Power Facility Power
CRAC Units CRAC Units
B Glycol Pumps Glycol Pumps
L 1
Panel 800A, 480 V Maintenance Bypass Switch 2500 A, 480 V
PDU PDU PDU PDU PDU PDU PDU PDU PDU PDU PDU PDU PDU PDU
100 100 100 100 100 100 100 100 100 100 100 100 100 100
kVA kVA kVA kVA kVA kVA kVA kVA kVA kVA kVA kVA kVA kVA
L 2 L 2 L 2 L 2 L 2 L 2 L 2 L 2 L 2 L 2 L 2 L 2 L 2 L 2
Telco Backup Servers
Devices
L 3 Storage Switches L 3
L 3
Routers
L 3 Security L 3
L 3 L 3 L 3 L 3 Encryption
Printers L 3
Redundant Feeds KVM/
For IT Equipment L 3 Console
PC’s & L 3
Workstations
L 3
L 3
Figure 2. Graphical representation of the three PUE measurement levels for a typical data center
2012 The Green Grid. All rights reserved. No part of this publication may be used, reproduced, photocopied, transmitted, or stored in any
retrieval system of any nature without the written permission of the copyright owner.PAGE 16 Level 1 Basic: The IT load is measured at the output of the UPS equipment and can be read from the UPS front panel, through a meter on the UPS output, or, in cases of multiple UPS modules, through a single meter on the common UPS output bus. The incoming energy is measured from the utility service entrance that feeds all of the electrical and mechanical equipment used to power, cool, and condition the data center. Basic monitoring requires, at a minimum, the collection of power measurements once a month; for energy measurements, that frequency is recommended. This typically involves some level of human activity to perform measurements. Level 2 Intermediate: The IT load is measured at the output of the PDUs within the data center and can typically be read from the PDU front panel or through a meter on the secondary of the PDU transformer. Individual branch circuit measurement is also acceptable for Level 2. The incoming energy is measured from the utility service entrance that feeds all of the electrical and mechanical equipment used to power, cool, and condition the data center. Intermediate monitoring requires, at a minimum, the collection of power measurements once a day; for energy measurements, that frequency is recommended. This may require less human activity than Level 1 involves, as the data would be collected electronically through meters. For Level 2, it is expected that data will be logged in real-time with extensive trending possible. Level 3 Advanced: The IT load is measured at each individual piece of IT equipment within the data center, either by metered rack PDUs (i.e., plug strips) that monitor at the strip or receptacle level or by the IT device itself. Note that non-IT loads must be excluded from these measurements. The incoming energy is measured from the utility service entrance that feeds all of the electrical and mechanical equipment used to power, cool, and condition the data center. Advanced monitoring requires, at a minimum, the collection of power measurements once every 15 minutes or less; for energy measurements, that frequency is recommended. Level 3 measurements should not require human activity to gather and record data; data will be collected by automated systems in real-time and should support extensive trending and analysis. The challenge is to collect the data in a simple format that serves various users’ needs and ultimately to aggregate this data for a complete picture of the data center. For the Level 1 and Level 2 measurement processes, it is recommended that measurements be taken at approximately the same time of day, when the loading in the data center is as consistent as possible with prior measurements. When making week-to-week comparisons, the day of the week should also be kept constant for comparable measurements. 2012 The Green Grid. All rights reserved. No part of this publication may be used, reproduced, photocopied, transmitted, or stored in any retrieval system of any nature without the written permission of the copyright owner.
PAGE 17
The primary benefits of moving from Level 1 to 2 (Basic to Intermediate) or Level 2 to 3 (Intermediate to
Advanced) are:
Measurement Period. 7 Each level provides increased measurement frequency:
Basic = Monthly or weekly
Intermediate = Daily/hourly (same day/time)
Advanced = Continuous (e.g., 15-minute intervals or less)
Measurement Placement. Each level provides a more accurate measurement of energy usage, as the
measurements are taken closer to the devices that consume the energy. For example, for IT
equipment, measurements are taken:
Basic = at UPS output (kilowatt-hour measurement taken either at the UPS display or through a
meter on the UPS output; in cases of multiple UPS modules, a single meter on the common UPS
output bus can be used)
Intermediate = at PDU output (kilowatt-hour measurement taken either at the PDU display or
through a meter on the secondary of the PDU transformer)
Advanced = at IT equipment input (or rack PDU or smart plug)
It is important to note that The Green Grid discourages use of the PUE metric to compare different data centers
without proper research and analysis. However, if the goal is to benchmark PUE against other data centers, it is
critical to account for all devices that support the data center regardless of which PUE measurement level is
chosen. A comprehensive list of devices is included in Table 2 in the following section.
4.3 COMPONENT CLASSIFICATION
In order for PUE to remain a global metric, there are two critical requirements that data center owners and
operators must follow:
Correctly classify each subcomponent that comprises the metric’s two core contributors: IT equipment
energy and total facility energy. (See Figure 3 for a subcomponent overview.)
Use the same method to obtain the data inputs that create PUE’s two core contributors (i.e., use a
consistent method for data capture and always use actual measurements).
7 As described in The Green Grid Metrics: Data Center Infrastructure Efficiency (DCiE) Detailed Analysis, White Paper #14
from The Green Grid, a “Measurement Period” is the total interval of time over which many periodic samples are taken.
2012 The Green Grid. All rights reserved. No part of this publication may be used, reproduced, photocopied, transmitted, or stored in any
retrieval system of any nature without the written permission of the copyright owner.PAGE 18
A data center’s network operations center (NOC) is a function of IT. Therefore, if the NOC supports the
data center, the associated energy would be captured within the IT portion. If the NOC does not
support the data center, then it is a separate function and the facility is mixed-use. (For specific
information around mixed-use buildings, please see section 5.2.)
PUE Subcomponents
PUE
Facility IT Equipment
Storage
Compute
Facility Devices
Building Power Miscellaneous
Mgmt. Network Devices
Devices
HVAC
IT Support Telecommunications
Physical
Systems
Security
Figure 3. Overview of the subcomponents within a typical data center’s facility and IT equipment
Table 2 below is designed to assist with correctly classifying each subcomponent.
2012 The Green Grid. All rights reserved. No part of this publication may be used, reproduced, photocopied, transmitted, or stored in any
retrieval system of any nature without the written permission of the copyright owner.PAGE 19
Table 2. Classification of subcomponents within IT and facility equipment categories in a typical data center
IT Equipment
Compute Devices
Servers
Network Devices
Switches
Routers
IT Support Systems
Printers
PCs/workstations
Remote management (KVM, consoles, etc.)
Miscellaneous Devices
Security encryption, appliances, etc.
Storage
Storage devices – switches, storage arrays, NAS
systems
Backup devices – media, libraries, virtual media
libraries
Telecommunications
All telco (telecommunications company) devices
Facility Equipment
Power
Automatic transfer switches (ATS)
Switchgear
UPS
DC batteries/rectifiers (non UPS – telco nodes)
Generators
Transformers (step down)
Static transfer switches (STS)
Power distribution units (PDUs)
Rack distribution units (RDUs)
Breaker panels
Distribution wiring
Lighting
Heating Ventilation and Air Conditioning (HVAC)
Cooling towers
2012 The Green Grid. All rights reserved. No part of this publication may be used, reproduced, photocopied, transmitted, or stored in any
retrieval system of any nature without the written permission of the copyright owner.PAGE 20
Facility Equipment
Condensers and condenser water pumps
Chillers
Heating Ventilation and Air Conditioning (HVAC)
Chilled water pumps
Water treatment systems
Well pumps
Computer room air conditioners (CRACs)
Computer room air handlers (CRAHs)
Dry coolers
Air compressors
Supply fans
Return fans
Air economizers
Water-side economizers
Dehumidifiers
Humidifiers
Heaters
In-row and in-rack cooling solutions
Condensate pumps
Physical Security
Fire suppression systems
Water detection
Physical security servers/devices
Building Management System and Controls
Servers/devices used to control/manage the data
center
Probes/sensors
Plant controls
4.4 MEASURING ENERGY USAGE
4.4.1 Estimating Energy Usage for Data Center Design and Planning
Energy usage for the various components necessary to populate the PUE equation can be obtained using
estimates such as efficiency curves and estimated loading conditions. The Green Grid envisions this method
being used to estimate expected PUE and evaluate alternatives during the design and planning stages for
2012 The Green Grid. All rights reserved. No part of this publication may be used, reproduced, photocopied, transmitted, or stored in any
retrieval system of any nature without the written permission of the copyright owner.PAGE 21 future data centers. However, The Green Grid does not recommend this approach for operational data centers and strongly recommends measuring actual energy usage. PUE values cannot be accurately calculated using name plate ratings for any of a data center’s IT equipment or for any of its mechanical infrastructure components. Actual energy measurements must be collected in order for PUE to have any correlation to an operational data center. 4.4.2 Measuring Actual Energy Consumption The Green Grid–recommended approach for obtaining the data necessary to calculate PUE is to measure actual energy usage for the entire data center and IT equipment. The Green Grid recognizes that obtaining actual measurements is not a trivial task, especially in existing data centers that do not have adequate instrumentation to collect the data. The minimum required measurement data would consist of two measurements one being total facility energy (Point A in Figure 2) and IT equipment energy (Point B in Figure 2). Although this would be adequate to calculate PUE, The Green Grid believes that more data is necessary to assess areas for potential improvements and evaluating changes intended to improve PUE within a data center. 4.4.3 Measurement Period Hourly, daily, weekly, monthly, and seasonal variances affect PUE. Increasing the frequency of the measurement cycle provides a larger and more accurate data set to analyze. To truly understand and successfully manage a data center’s efficiency, continuous real-time monitoring should be used so that historical trending and statistical analysis can be done to determine where efficiencies can be gained. Other benefits include early detection of unexpected variations that could indicate systems issues. In cases where continuous real-time monitoring is not practical or economically justifiable, some form of repeatable, defined process should be in place to capture PUE as often as possible for comparison purposes. Measurements should not continue to be taken if maintenance is being performed within the data center or if other significant operational abnormalities are identified or present, any of which could have a negative impact and provide unrealistic PUE measurements. Therefore, The Green Grid–recommended best practice is automated, real-time monitoring with data captured every 15 minutes or less. When reporting a PUE value, data center owners should use the average PUE measured over a one-year period. For data centers without real-time monitoring, PUE should be collected 2012 The Green Grid. All rights reserved. No part of this publication may be used, reproduced, photocopied, transmitted, or stored in any retrieval system of any nature without the written permission of the copyright owner.
PAGE 22
according to Table 1 per the intended level of implementation and reported using the guidelines set out in
section VI (How to Report PUE) of this document.
4.4.4 Required and Recommended Measurement Points and Intervals
Table 3 adds to the PUE measurement levels outlined in Table 1, providing information about The Green Grid’s
additional recommended measurement points and intervals for the three levels.
Table 3. Guidance as to which measurement points and intervals are required and recommended for each
PUE measurement level
Where do I measure? Level 1 (L1) Level 2 (L2) Level 3 (L3)
How often do I measure? Basic Intermediate Advanced
IT Equipment Required UPS outputs PDU outputs IT equipment input
Energy
Total Facility Required Utility inputs Utility inputs Utility inputs
Energy Additional UPS PDU outputs
recommended inputs/outputs
UPS inputs/outputs
measurements*
Mechanical inputs
Mechanical inputs
Measurement Required Monthly Daily 15 minutes
Intervals Additional Weekly Hourly 15 minutes or less
recommended
measurements*
*Recommended measurements are in addition to the required measurements. The additional measurement points are
recommended to provide further insight into the energy efficiency of the infrastructure.
The diagram in Figure 4 depicts the additional recommended measurement points from Table 3 for the three
measurement levels. Figure 4 adds to the measurement points illustrated in Figure 2. Specifically, Level 2
measurement points have been added to the critical load ATS output and to the UPS input. The additional
recommended measurement points are highlighted in yellow.
2012 The Green Grid. All rights reserved. No part of this publication may be used, reproduced, photocopied, transmitted, or stored in any
retrieval system of any nature without the written permission of the copyright owner.PAGE 23
Backup Backup Backup
A Utility metering point Generator Generator Generator
AC 2 MW 2 MW
2 MW
Substation
15 kV – 480 V / 277 V
L1, L2, L3
Utility Feed
Generator Switchgear
ATS ATS
2500A Automatic Automatic ATS
2500A
Transfer Transfer 2500A
Switch Switches
L 2
L 2 L 2
Standby Switchboard 2500 A, 480 V
Mechanical Mechanical
Switch Gear Switch Gear
L 2 L 2 L 2 L 2
UPS UPS UPS UPS Mechanical Mechanical
B Side A Side A Side A Side Equipment Equipment
320 kW 400 kW 400 kW 400 kW
400 kVA 500 kVA 500 kVA 500 kVA
B L 3 L 3 L 3 L 3 L 3 L 3 L 3 L 3
L 1
Building Building
Management Management
Facility Power Facility Power
B CRAC Units CRAC Units
L 1 Glycol Pumps Glycol Pumps
Panel 800A, 480 V Maintenance Bypass Switch 2500 A, 480 V
PDU PDU PDU PDU PDU PDU PDU PDU PDU PDU PDU PDU PDU PDU
100 100 100 100 100 100 100 100 100 100 100 100 100 100
kVA kVA kVA kVA kVA kVA kVA kVA kVA kVA kVA kVA kVA kVA
L 2 L 2 L 2 L 2 L 2 L 2 L 2 L 2 L 2 L 2 L 2 L 2 L 2 L 2
Telco Backup Servers
Devices
L 3 Storage Switches L 3
L 3
Routers
L 3 Security L 3
L 3 L 3 L 3 L 3 Encryption
Printers L 3
Redundant Feeds KVM/
For IT Equipment L 3 Console
PC’s & L 3
Workstations
L 3
L 3
Figure 4. Monitoring and measurement points
2012 The Green Grid. All rights reserved. No part of this publication may be used, reproduced, photocopied, transmitted, or stored in any
retrieval system of any nature without the written permission of the copyright owner.PAGE 24
4.4.5 Critical Power Path Measurement Points
Although monitoring energy usage at the service entrance and the critical loads for PUE data collection is a
simple concept, the complexity of the critical power path can be overwhelming. Moving the monitoring location
closer to the devices that are consuming the energy enables further isolation of distribution component losses.
While this is preferred when measuring IT energy usage, distribution losses should be included in all other
measurements, if possible.
The total critical power path can consist of many elements downstream from the utility meter, such as those
shown in Figure 5 below. (For more detailed lists, see Table 2.)
Service Entrance or
Automatic Transfer Switch
Switchgear and Input Panel
Uninterruptible Power Supply
Cr
itic
Output Power Distribution
al
Po
we
rP
Rack Power Distribution
at
h
IT Loads
Figure 5. Hierarchy of critical power path measurement points
Monitoring energy usage within a critical power path involves many aspects that can prevent it from being easy
and straightforward for the data center operator. Costs can be quite high to install measuring instruments at
every point in the critical power path. Collecting, processing, and interpreting all the data also can be complex.
Currently, there is no commercially available integrated measurement software solution, so the data center
operator must deal with multiple data collection systems. Lastly, there is always some degree of error inherent
in each of the meters measuring energy usage, which can affect results.
For a practical and achievable approach to monitoring, The Green Grid recommends that data center operators
identify where it is most beneficial to measure, taking into account associated improvements in PUE accuracy.
2012 The Green Grid. All rights reserved. No part of this publication may be used, reproduced, photocopied, transmitted, or stored in any
retrieval system of any nature without the written permission of the copyright owner.PAGE 25
4.4.6 Critical Mechanical-Path Measurement Points
Separating the mechanical system’s loads can be even more challenging than dealing with the power path. The
most useful data is obtained when equipment is grouped by system, which allows for energy comparisons with
other systems. Efforts should be directed at determining the energy usage by system, including, but not limited
to, the following examples:
Cooling plant
Chillers
Towers
Pumps
Economizers
Thermal storage
Secondary chill water distribution systems
Computer room air handlers
Lighting
Fans (fresh air and exhaust)
Security
Fire suppression systems
While equipment can be divided into types, most often the electric energy that these loads use cannot be
divided. Mechanical system configurations vary by philosophy and designer. In many instances, energy usage
of different types are fed from the same source.
On a positive note, mechanical systems often include various monitoring information in order to manage
themselves. Thus they provide ready sources of data that can be used, including building management
systems, variable loads such as variable speed drives, equipment provided with metering, and fixed-speed
loads such as some fans and pumps whose load profiles do not vary significantly.
4.4.7 Meter and Measurement Requirements
Most important to measuring the energy usage of equipment is requiring a suitable kilowatt-hour (kWh) meter
that reports the “true” energy usage, via the simultaneous measurement of the voltage, current, and power
factor over time. (Note that kilovolt-ampere [kVA]—the product of voltage and current alone—is not an accurate
representation of the power, or kilowatts [kW], used in alternating current systems). Many watt meters also
have the capability to report energy usage, which is the recommended measurement. For more in-depth
2012 The Green Grid. All rights reserved. No part of this publication may be used, reproduced, photocopied, transmitted, or stored in any
retrieval system of any nature without the written permission of the copyright owner.PAGE 26 guidance specific to energy measuring requirements, The Green Grid recommends ASHRAE Datacom Series Book #9, Real-Time Energy Consumption Measurements in Data Centers,8 which was coauthored by The Green Grid and ASHRAE. 4.5 FACTORS AFFECTING PUE The intent of PUE is to assist decision makers for data center operations, IT, and facilities in their efforts to improve data center efficiency. As with any data point, the PUE metric represents only one part of the entire data center picture. PUE is valuable for monitoring changes in a single data center at an aggregated level. It also can help identify large differences in Power Usage Effectiveness among similar data centers, although further investigation is required to understand why such variations exist. While measuring PUE is the first step in better understanding a data center’s efficiency, subsequent investigation is required to determine the best approach for additional improvement. 4.5.1 Dynamic Nature of a Data Center Data centers are in constant flux. Applications, as well as the IT equipment and infrastructure that support them, are continually evolving to better meet organizations’ business needs. Therefore, the initial design of a data center is obsolete the day after the installation and commissioning is complete. Energy usage calculations are often based on a static design rather than on the dynamic data center configuration. The designed (static) versus actual (dynamic) nature of a data center must be considered. Improvements will come through incremental step changes in infrastructure over time. Also, it is important to keep in mind that as the load changes in a data center, the operating point of the subcomponents on their efficiency curves will change. 4.5.2 Type of Data Center The type of processing done in a data center can greatly affect PUE values. Is the data center mainly used for testing, production, internal processes, networking, or something else? What is the primary business supported by the data center (e.g., financial services, healthcare, telecommunications, etc.)? What level of resiliency is required to support this business? Another aspect to consider is if the data center operations scheme includes disaster recovery, which would certainly affect efficiency. 8 www.ashrae.org/publications/page/1900#9 2012 The Green Grid. All rights reserved. No part of this publication may be used, reproduced, photocopied, transmitted, or stored in any retrieval system of any nature without the written permission of the copyright owner.
PAGE 27
Similarly, the physical attributes of the data center will have an impact on PUE. What temperature and humidity
levels are typically maintained by the data center? What type of cooling system is used and does it include free
cooling? How old is the data center and the subcomponents in it? Was the building intended to be a data
center, or was it retrofitted to be used as one?
Many infrastructure subcomponents and some IT equipment currently support energy-reduction features—are
these employed in the data center? Are they effective? Are dummy loads being run and, if so, why and when?
4.5.3 Climate and Location
A data center’s location can have a significant impact on its PUE. The efficiency of identical mechanical
systems can be drastically different depending on the climate in which the system operates. The local climate
also affects the hours of free cooling available, as shown in Figure 6. (Note: Figure 6 is for illustrative purposes
only, intended to convey the concept of free cooling; it does not capture all variances that could occur.) Free
cooling implies the ability to provide cooling to IT equipment by leveraging local ambient conditions in order to
reduce energy usage. Similarly, some mechanical systems are just not practical in some climates or locations.
Location has a significant impact on utility rates and even energy availability.
3.0
IT load held constant for this graph
2.5
Efficiency
PUE 2.0
1.5 Better efficiency at low temperatures
when free cooling is used
1
0 4 8 12 16 20 24 28 32 36 40
Outdoor temperature (°C)
Figure 6. Sample illustration of the relationship between PUE and outdoor temperature
2012 The Green Grid. All rights reserved. No part of this publication may be used, reproduced, photocopied, transmitted, or stored in any
retrieval system of any nature without the written permission of the copyright owner.You can also read