State of the St. Louis Workforce 2021
←
→
Page content transcription
If your browser does not render page correctly, please read the page content below
State of the St. Louis Workforce 2021
Copyright © 2021 St. Louis Community College
     All rights reserved. No part of this publication may be reproduced, stored in a retrieval system, or transmitted, in
     any form or by any means, electronic, mechanical, photocopying, recording, or otherwise, without the prior written
     permission of the St. Louis Community College.

     Printed in the United States of America.

     Published by
     St. Louis Community College
     Workforce Solutions Group
     Corporate College
     3221 McKelvey Road
     Bridgeton, MO 63044-2551
     stlcc.edu/workforce

     Although every effort has been made to ensure that the information contained herein is accurate, St. Louis
     Community College makes no representation or warranty as to the accuracy of such information. Furthermore,
     St. Louis Community College hereby disclaims any liability or responsibility to any person for loss or damages,
     including expenses, which may arise or result from the use of any information contained herein or following the
     procedures described herein but not limited to, fines or penalties for the violation of any federal, state or local
     regulations. No patent liability is assumed with respect to the use of the information contained herein.
     Most references to manufacturers or their products are registered trade names and are to be treated accordingly.

     Researched and produced by
     St. Louis Community College Workforce Solutions Group

     Visit stlcc.edu/STLworkforce for more information.

ii                                            State of the St. Louis Workforce 2021            stlcc.edu/STLworkforce
FOREWORD
St. Louis Community College’s mission is built on three basic pillars: lifelong
education for our community, preparing students for transfer to four-year
colleges and universities, and educating students to directly enter the workforce
in a wide variety of industries. The importance of this last pillar led STLCC to
initiate this annual regional employer survey and report, now in its thirteenth
year.

For well over a decade, the College and its research partners have surveyed
St. Louis’ employers from the Great Recession through the ten-year economic
recovery to the generational disruption we are facing with the COVID-19
pandemic. This year, the College surveyed more than 500 employers across 16          Jeff Pittman, Ph.D.
employer categories to understand the business climate, hiring trends,               Chancellor
occupational skills and demands from businesses throughout the St. Louis
region. We are very pleased to present this 2021 State of the St. Louis Workforce
report to our community.

Understanding which skills employers will need most after 18 months of a global
pandemic is a unique challenge, made more complex by the fact that many experts
expect our economy to be significantly altered in the years to come as companies
adjust to a post-COVID workplace. The rapid return of the national unemployment
rate from 14.8%—the highest rate observed since data collection began in 1948—
to a reasonable 5.9% is a good sign that the strong pre-COVID economy will
continue. But with very few examples of similar rapid and widespread economic
disruptions to evaluate, we are in somewhat uncharted waters. We hope that
hearing directly from regional employers about their opportunities, plans and    Hart Nelson, M.B.A.
challenges will help civic leaders navigate the trials ahead.                    Associate
                                                                                     Vice-Chancellor for
Our State of the St. Louis Workforce report has normally alternated each year       Workforce Solutions
between a look at a composite of the region’s employers and a focus on
particular sectors or disciplines the next year. However, due to the massive economic
shock caused by the COVID-19 pandemic, we made the decision to skip our deep sector
dive last year and instead conduct an all-industry composite survey to better
understand the magnitude of the changes the pandemic created for St. Louis employers.
This year’s survey is again an all-industry composite, allowing us to make direct
comparisons between what employers were planning and doing before, during and—we
sincerely hope—near the end of the COVID-19 disruption.

As a community, we are well aware that the COVID-19 pandemic has affected different
communities and demographics in different ways. Women and people of color were
more likely to lose their jobs early in the disruption and have higher unemployment
rates than whites, and they still lag behind in returning to the workforce. Minority- and
women-owned businesses were disproportionately affected early in the pandemic, with
the Federal Reserve Bank of St. Louis citing a study that showed a 41% decrease in

State of the St. Louis Workforce 2021   stlcc.edu/STLworkforce                                             iii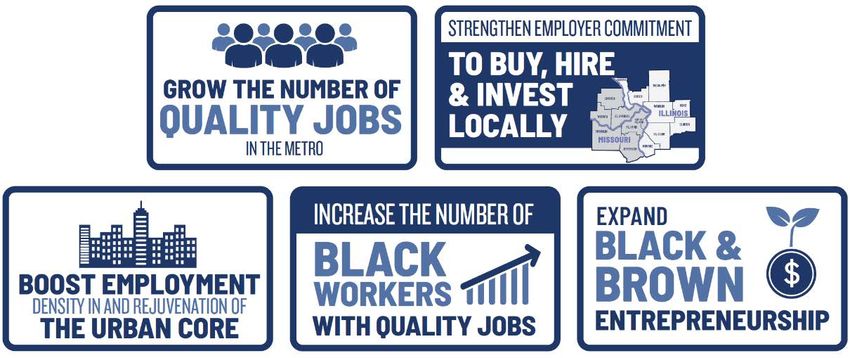
business activity for African American-owned businesses and a 25% decrease for
     women-owned enterprises.

     Last year, we worried whether the recovery would be “K-shaped,” with some groups
     recovering quickly and others—usually the most vulnerable populations with the least
     education—left behind once again. As we plan for the end of the pandemic, we in the
     St. Louis region must commit ourselves to ensuring that the recovery is equitable—that
     those who have historically and systematically been made vulnerable get the support
     they need to thrive and grow in a post-COVID economy.

     Just as it did last year, the pandemic made it more difficult to complete surveys. The
     contact and incidence rates continued to be very low due to business closures, both
     temporary and permanent. Multiple calls were required to reach the correct contact
     persons, many of whom were job-sharing or working from home, thus unreachable via
     the normal business telephone numbers used by our survey partner. Despite these
     challenges, our partner was able to produce a cross-industry and statistically valid
     result.

     This 2021 State of the St. Louis Workforce report is the work of many and is supported
     through the partnership of our region’s top economic and workforce institutions. Along
     with the data from our decade-long partners at the Missouri Economic Research and
     Information Center (MERIC), we appreciate the collaboration with our other long-time
     partners including the Federal Reserve Bank of St. Louis, Nine PBS, and the St. Louis
     Business Journal. We also want to thank our workforce development collaborators
     including the Regional Business Council and the Missouri Chamber of Commerce and
     Industry for their involvement with this report.

     The information in this report includes labor market information from public sources
     such as the Bureau of Labor Statistics and the Census Bureau. We also used advanced
     analytical tools such as Burning Glass Labor Insight, Chmura JobsEQ, and others to
     further understand trends and potential future challenges. We would like to thank and
     acknowledge our employers, our research partners, and our media partners, without
     whom we would not be able to bring this informative workforce report to the region.
     We hope you will find this report valuable and use its findings for the benefit of your
     organization and our community.

iv                                 State of the St. Louis Workforce 2021   stlcc.edu/STLworkforce
TABLE OF CONTENTS
Foreword .................................................................................................................................... iii
Executive Summary................................................................................................................. 1
Methodology .............................................................................................................................. 7
St. Louis Economy .................................................................................................................... 9
   Employment.................................................................................................................................................... 9
   Unemployment ............................................................................................................................................10
   Unemployment Demographics .............................................................................................................11
   Workforce Characteristics ......................................................................................................................12
   Education Attainment...............................................................................................................................12
   Labor Shed .....................................................................................................................................................13
   Current Job Demand ..................................................................................................................................13
   Skills and Certificates ................................................................................................................................15
   Hard-to-fill Jobs ...........................................................................................................................................16
   Projected Job Demand ..............................................................................................................................17

Employer Survey .................................................................................................................... 19
   Hiring Trends ...............................................................................................................................................21
       The Past Year ...........................................................................................................................................21
       Looking Ahead ........................................................................................................................................22
       Future Business Concerns..................................................................................................................23
   Expanding Employment ..........................................................................................................................23
       Skills Gaps .................................................................................................................................................23
       Employer Optimism..............................................................................................................................24
       Importance of Barriers to Expanding Employment................................................................25
       Shortcomings of Job Applicants .......................................................................................................26
       Importance of Applicant Shortcomings .......................................................................................27
       Adding Employees .................................................................................................................................29
       Methods of Skill Acquisition..............................................................................................................30
       Shortage of Applicants .........................................................................................................................31
       Skills Shortages in Functional Areas..............................................................................................32
   Experience and Education ......................................................................................................................35

State of the St. Louis Workforce 2021                              stlcc.edu/STLworkforce                                                                                v
Experience Requirements.................................................................................................................. 35
            Education Requirements .................................................................................................................... 36
            Opportunity and Advancement ....................................................................................................... 37
        Employment Barriers ............................................................................................................................... 38
            Pre-employment Screening Checks ............................................................................................... 38
            Justice-Involved Individuals ............................................................................................................. 39
        Remote Work ............................................................................................................................................... 39
        Workforce Initiatives ................................................................................................................................ 40
        Sharing in the Recovery........................................................................................................................... 41

     Equal recovery, opportunity, growth. ........................................................................... 43
        About the Institute for Economic Equity.......................................................................................... 44
        The Time for Equitable Recovery, Opportunity and Growth .................................................. 44
        Creating Opportunity for All: Valerie Patton .................................................................................. 46
            Raising the Floor—“Quality Jobs” Defined ................................................................................. 46
            The Pipeline to Equitable Opportunity: The Talent Is Here................................................ 47
            The Workforce of the Future Is Inclusive ................................................................................... 48
            Collaborative Roles for Employers, Institutions and Individuals ..................................... 49
        Building Capacity and Capital: Bruce Katz ...................................................................................... 50
            Talent Pipeline Support ...................................................................................................................... 51
        Conclusion ..................................................................................................................................................... 54

     Acknowledgments ................................................................................................................. 55
     Appendix I: State of the St. Louis Workforce Employer Survey 2021............... 56

vi                                                           State of the St. Louis Workforce 2021                                stlcc.edu/STLworkforce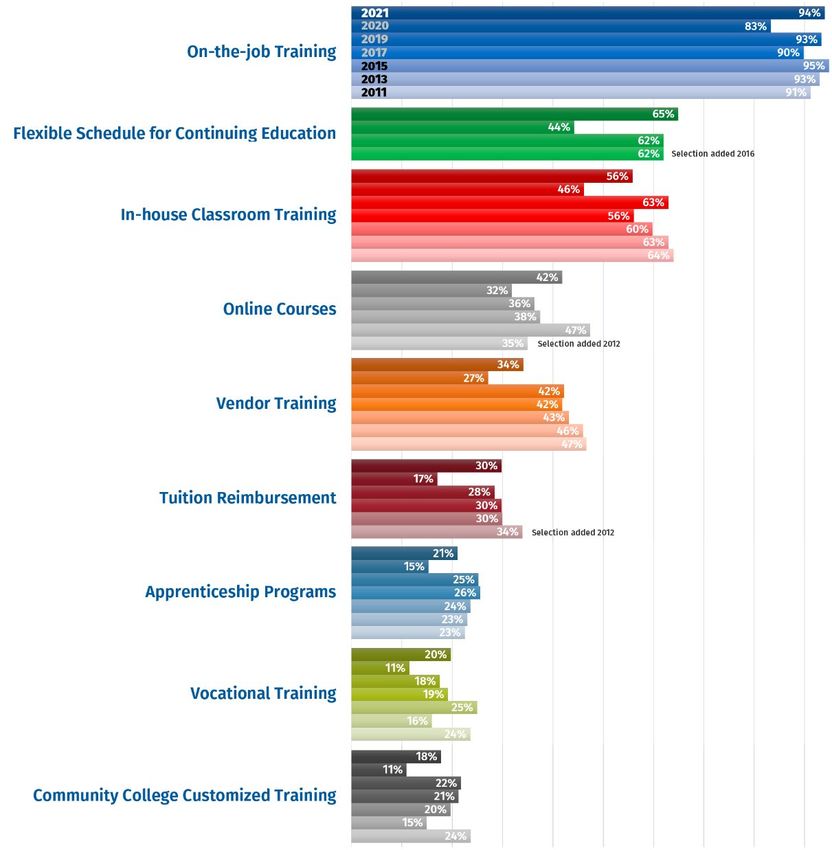
EXECUTIVE SUMMARY

When St. Louis Community College first created the State of the St. Louis Workforce
report in 2009 we expected that—if the project lasted long enough—we would be able
to observe and analyze a full economic cycle: from recession to growth and back again.
However, we certainly did not foresee the rapid and broad economic disruption caused
by a once-in-a-generation global pandemic. Last year, we were somewhat surprised to
observe the high level of optimism employers retained a few months into the massive
COVID-19 economic disruption. Our report this year shows that this result was not a
fluke and that employers are even more bullish about a strong recovery.

At the same time, we are well aware of how many individuals, many of whom are our
students, suffered because of the pandemic. People of color and women—and the
businesses they run—were impacted at a higher rate than the general population. In
this, our 13th State of the St. Louis Workforce report, we seek to understand how
employers view the regional workforce and, more importantly, to investigate what
St. Louis needs to do to ensure that the next economic cycle leaves fewer of our friends
and neighbors behind.

As in years past, the report is divided into three sections. The St. Louis Economy
compiles publicly available labor market information as well as data gathered through
proprietary analytical tools. The Employer Survey is based on a telephone survey of 516
employers across 16 employer categories representing a composite of the region’s
economy. Finally, our narrative section Equitable Recovery, Equitable Opportunity,
Equitable Growth takes a look at how we can ensure that those most affected by the
COVID-19 pandemic—many of the same individuals and groups who did not benefit
from the pre-COVID economic boom—can share in the recovery with quality jobs and
increased opportunity.

The St. Louis Metropolitan Statistical Area (MSA) consists of a diverse economy with a
labor force of over 1.3 million. At 16% of total employment, health care and social
assistance is one of the largest and most crucial industry sectors, with over 20% growth
in the number of employees from 2010 to 2020. This sector is followed closely by
wholesale and retail trade, which makes up 15% of total employment. The St. Louis
economy added over 95,000 employees in the last 10 years, amounting to roughly 8%
growth.

State of the St. Louis Workforce 2021   stlcc.edu/STLworkforce                             1

Due to the effects of COVID-19, national
    Due to the effects of COVID-19,                     unemployment rates peaked at levels unseen
                                                        since data collection began in 1948; St. Louis
    unemployment rates peaked at                        was no exception. Our regional peak of
    levels unseen since data                            unemployment was 11.6% in April and May
                                                        2020, but this dropped significantly to 4.7%
    collection began in 1948.                           in April 2021. This is lower than the 6.1%
                                                        national rate but higher than the Missouri
             rate of 4.1%, consistent with the trend over the past few years.

                 Unemployment rates vary greatly with age and sex. Younger workers, particularly men
                 under age 22, had 2019 unemployment rates at or above 10% in the St. Louis MSA. Men
                 in the 16-19 age range had the highest rate at 11.5%. While there is a large disparity in
                 unemployment rates between males and females in younger age groups, rates were
                 similar in the 35-54 age groups. Interestingly, men over age 75 had the lowest
                 unemployment rate of all groups at 0.7%, while women over the age of 75 had a rate of
                 6.8%.

             Over the last decade, the workforce age groups 55 and older have grown from 19% to
             24%, which means St. Louis mirrors the national trend of an aging workforce.
                                                       Jobholders ages 35-44 represented the slight
    Over the last decade, the 55 and majority at 21.6% of the workforce, with the
                                                       25-34 age group immediately following at
    older workforce age group has                      21.5%. Workers aged 14-21 made up only
                                                       7.4% of the workforce. From 2009 to 2019,
    grown from 19% to 24%, which                       the share of St. Louis workers aged 45-54 has
    means St. Louis mirrors the                        declined 5% while those 55-64 have
                                                       increased 4%.
    national trend of an aging
                                                            Forty-eight percent of the population 25 and
    workforce.                                              older have a high school diploma but no post-
                                                            secondary degree, lower than the state rate of
                 53% and slightly higher than the national rate (47%). Forty-five percent have an
                 associate degree or greater, higher than both the state rate (38%) and the national rate
                 (42%).

                 The massive, pandemic-fueled reduction in workforce we saw last year continued in
                 2021, with 31% of companies cutting employees during the last 12 months. Decreases
                 were more than double the pre-pandemic rate and were slightly higher than results
                 reported last year (29%). Just as we saw in 2020, some companies continued to hire
                 during this timeframe and a greater percentage (7.4%) increased employment
                 significantly when compared to last year (6.5%). Unsurprisingly, nearly two-thirds of
                 employers (65%) that reported significant changes in employment levels attributed
                 them to COVID-19, down slightly from the 2020 results.

2                                               State of the St. Louis Workforce 2021   stlcc.edu/STLworkforce
Companies were even more optimistic than
last year about their plans to increase staffing  Companies were even more
over the next 12 months, with nearly two-
thirds (63%) stating they would increase          optimistic than last year about
employment levels. Continuing a trend seen        plans to increase staffing over
last year, traditional risk mitigation strategies
such as hiring temporary workers or               the next 12 months, with nearly
contractors were out of favor, with fewer than    two-thirds stating they would
15% of employers indicating they would hire
in this manner. Instead, an astounding 80% of     increase employment levels.
employers—the highest level we have
recorded—said they would hire new full-time employees, while 65% reported they
would hire part-time workers.

A headwind to the future hiring optimism, employers reported a shortage of workers
with knowledge or skills as the most common barrier to expanding employment, a
position it has held since 2015. The labor
market appears even more constrained than
last year, with 58% of employers reporting        A headwind to the future hiring
this as a barrier, an increase of 17% from the    optimism, employers reported a
2020 report. Both economic conditions (40%)
and government policies or regulations            shortage of workers with
(36%) increased drastically compared to the
                                                  knowledge or skills as the most
2020 results. While last year a shortage of
workers was cited as the most important           common barrier to expanding
barrier, in 2021 employers were most
concerned with government policies or
                                                  employment.
regulations. This makes sense given the
potential for future public health mandates or other COVID-related regulations.
Shortage of workers with knowledge or skills was rated second-most important, with
economic conditions following in third.

We once again asked employers about the possible shortcomings they were seeing in
applicants for available jobs. Leading the list as the most frequent response, as it has
been since 2013, was poor work habits (65%). This was followed by lack of general
business or industry knowledge (57%), lack of critical thinking and problem solving
(56%), and lack of communication and interpersonal skills (53%). Perhaps surprisingly,
given the focus on preparing young people for STEAM careers, less than half (45%) of
employers cited lack of technical skills specific to the job, although this was a slight
increase over previous years.

Skilled trades was once again the most in-demand business function of the seven
categories we survey, with nearly three-quarters of those firms who employ skilled
trades reporting a shortage of applicants. Patient care (67%) followed in second place.
As with skilled trades and patient care, we saw sharp increases in applicant shortages

State of the St. Louis Workforce 2021   stlcc.edu/STLworkforce                             3
this year for manufacturing/maintenance
    Skilled trades was again the                            (55%), customer service (45%), business
                                                            management (27%), and information
    most in-demand business                                 technology (27%). While the shortages in
    function, with nearly three-                            information technology applicants were
                                                            reported at a higher rate than 2020, this
    quarters of firms who employ                            result still appears significantly lower than
    skilled trades reporting a                              the anecdotal narrative around the shortage
                                                            of IT workers in St. Louis.
    shortage of applicants.
                                                            Results last year that indicated fewer jobs for
                                                            those with no experience or those with short-
                 term training appear to have been a COVID-related blip, as these responses both
                 returned to historical norms. More than half of employers reported having at least some
                 jobs requiring no experience, while over three-fourths (78%) said they had positions
                 available for those with short-term training, the highest percentage recorded.

                 Barriers to employment for justice-involved individuals remain. The vast majority of
                 employers said their willingness to hire a justice-involved individual depends on the
                 felony (50%) or they would hire such candidates only for some jobs (17%). Slightly less
                 than one-fifth of employers (18%) said they would not consider an applicant convicted
                 of a felony offense at all. This tracks with the results from 2020 and 2015. However,
                 16% of employers said they would consider the applicant for any job they were
                 qualified for, which is the highest level reported since we began asking this question in
                 2015.

             We asked employers to rate the importance of future business concerns using a five-
             point scale. While last year the COVID-19 pandemic was top of mind for most of the
             employers surveyed, this year concerns about COVID ranked eighth, a strong sign that
                                                        most employers believe they have figured out
    The COVID-19 pandemic was top how to navigate the COVID economy.
                                                        Employers are much more concerned about
    of mind for most employers                          normal business cycle issues such as

    surveyed last year. This year                       attracting or retaining talent (averaging 3.95
                                                        on a 1 to 5 scale), financial impacts on
    concerns about COVID ranked                         operations (3.73), and supply chain
                                                        disruptions (3.71).
    eighth, a strong sign that most
                                                            Just as we saw last year, St. Louis employers
    employers believe they have                             are not sold on remote work. While last year
    figured out how to navigate the                         61.3% of employers had people working
                                                            remotely, only 22.9% reported this in 2021.
    COVID economy.                                          This reduction occurred even though fewer
                                                            employers reported challenges working
                 remotely than they did last year. This trend away from remote work looks set to
                 continue: 41% of employers with currently remote employees plan to reduce the

4                                               State of the St. Louis Workforce 2021   stlcc.edu/STLworkforce
number of those workers during the next 12 months, and only 10.3% indicated that they will increase remote workers. Finally, a move towards increased workforce resiliency and a focus on employee well- being seem to have broadened after surfacing last year. When asked which workforce policy changes employers were considering, a full 72% of employers stated they are considering cross-training and knowledge transfer, up from 42% last year. Nearly two- thirds (65%) reported reskilling or upskilling employees to new ways of working, while 70% reported increased employee care and engagement, and over half (54%) said they were considering flexible working conditions. Only one initiative lost favor compared to 2020—remote working—which tracks with the results previously noted. COVID-19 shut down restaurants, travel and hotels—industries in which women and people of color hold a larger share of the jobs. And while recessions historically impact economically disadvantaged groups in disproportionate ways, the COVID-19 disruption was in many ways worse than the Great Recession. New research from Washington University in St. Louis’ Olin Business School found that Black women lost 42% more job- months than white workers while Hispanic women fared even worse, with a 60% loss. Our narrative section, entitled Equitable Recovery, Equitable Opportunity, Equitable Growth, looks at ways that St. Louis can ensure that those historically left out of the job market—and those who have been most affected by the pandemic—get back into the workforce in better shape than they were before COVID-19. We study aspects of the recently released STL 2030 Jobs Plan with two of its authors, Greater St. Louis, Inc. Chief Diversity, Equity and Inclusion Officer Valerie Patton, and author and New Localism Associates Co-Founder Bruce Katz. Our conversation explores a number of challenging and timely issues such as the definition of a “quality job,” how employers and civic leaders can build the pipeline to equitable opportunity, and the role employers, institutions and individuals can play in helping our region become a talent engine and magnet for workers living in St. Louis. State of the St. Louis Workforce 2021 stlcc.edu/STLworkforce 5
2021 A Closer Look: St. Louis MSA Unemployment Rate
        Unemployment Rate, St. Louis Metropolitan Area and Its
            Component Counties, Not Seasonally Adjusted
                             May      Jun      Jul   Aug     Sep      Oct    Nov     Dec      Jan    Feb     Mat     Apr
                             2020    2020     2020   2020    2020    2020    2020    2020    2021    2021    2021    2021

    Bond (IL)                 12.7   11.0      9.2    7.0     5.8     4.7     4.4     5.1     6.0     5.3     4.9     4.4

    Calhoun (IL)             14.2    12.3      9.3    6.7     5.4     4.3     4.3     6.0     6.5     6.1     5.2     5.0

    Clinton (IL)              11.4    8.8      7.3    5.3     4.4     3.5     3.6     4.2     4.6     4.2     3.7     3.3

    Jersey (IL)               13.3    11.7     9.6    7.0     6.1     4.9     4.7     5.9     6.0     5.1     4.7     4.5

    Macoupin (IL)             11.9   10.6     9.0     6.7     5.6     4.5     4.3     5.6     6.2     5.3     5.0     4.7

    Madison (IL)             13.8    12.6    10.9     8.1     6.8     5.5     5.1     6.0     6.3     5.3     5.3     5.1

    Monroe (IL)              10.3      9.1     7.5    5.3     4.5     3.5     3.3     3.9     4.2     3.7     3.3     3.2

    St. Clair (IL)           15.6    14.5     12.9    9.9     8.6     6.9     6.4     6.9     7.6     6.6     6.7     6.5

    Crawford (MO)              9.3    8.4      7.7    6.2     4.8     4.1     4.5     4.9     5.8     6.4     5.3     4.2

    Franklin (MO)            10.8     8.5      7.3     5.7    4.4     3.8     4.1     4.4     5.0     5.4     4.2     3.5

    Jefferson (MO)            10.1    8.4      7.1    5.9     4.7     3.9     4.0     4.6     5.1     5.3     4.4     3.7

    Lincoln (MO)              11.1     7.9     6.7    5.3     4.3     3.6     3.8     4.2     4.9     5.6     4.3     3.6

    St. Charles (MO)           9.3     7.4    6.0     4.8     3.8     3.2     3.3     3.7     4.0     3.9     3.4     3.0

    St. Louis (MO)           10.3     9.0      7.9    6.7     5.5     4.4     4.5     4.9     5.1     5.1     4.5     4.3

    Warren (MO)                9.7     7.4     6.6    5.5     4.2     3.5     3.8     4.2     4.6     5.1     4.0     3.4

    St. Louis City (MO)      13.6    12.3     11.1    9.7     8.0     6.4     6.3     6.7     7.0     7.0     6.3     6.2

    St. Louis MSA             11.4    9.9      8.5    6.9     5.7     4.6     4.6     5.1     5.5     5.3     4.7     4.4
    Source: Bureau of Labor Statistics. Current Employment Statistics, St. Louis, Mo.-Ill., Metropolitan Area Data Tables.

    Source: Bureau of Labor Statistics. Current Employment Statistics, St. Louis, Mo.-Ill., Metropolitan Area Data Tables.

6                                            State of the St. Louis Workforce 2021            stlcc.edu/STLworkforce
METHODOLOGY The 2021 State of the St. Louis Workforce report follows the format of previous editions by including three distinct sections: the St. Louis Economy, a compilation of labor market information using public and proprietary sources and tools; the Employer Survey; and a narrative section, which challenges regional thought leaders to consider how the St. Louis region could bring about an equitable recovery and engage those marginalized and left behind during the previous decade’s prosperity. St. Louis Economy This section includes an analysis of available data from public sources, such as the Bureau of Labor Statistics and the United States Census Bureau, which describes the characteristics of the labor force and correlates unemployment with various labor force demographics. Also included is an analysis of real-time labor market demand aggregated through the proprietary Burning Glass Labor Insight tool, which searches web-based job boards to discern the level of demand for certain occupations and the skills and certifications that employers are requesting. Employer Survey The State of the St. Louis Workforce report relies heavily on first-person telephonic interviews of regional employers. Each of the 2021 survey interviews averaged slightly under 23 minutes to complete. As shown in the table on the following page, 516 local companies in 16 industry categories were surveyed between May 7 and June 14, 2021, encompassing the 23 two-digit NAICS (North American Industry Classification System) codes that represent a composite picture of the St. Louis regional economy. This year, for the first time, a pre-notification email was sent to announce and validate the survey prior to its start to all employers for whom email records were available. Survey respondents were asked a series of 16 questions, some with multiple parts, related to hiring trends, skill needs, and COVID-19 impacts. Companies interviewed for the survey were selected from a categorized list of the 38,377 St. Louis Metropolitan Statistical Area (MSA) business establishments listed with five or more employees from the Reference USA employer database provided by the Missouri Economic Research and Information Center (MERIC). The survey instrument is provided as Appendix I. State of the St. Louis Workforce 2021 stlcc.edu/STLworkforce 7
Equitable Recovery, Equitable Opportunity, Equitable Growth
    This year’s narrative section studies aspects of the recently released STL 2030 Jobs Plan
    with two of its authors, Greater St. Louis, Inc. Chief Diversity, Equity and Inclusion
    Officer Valerie Patton, and author and New Localism Associates Co-Founder Bruce Katz.
    Our conversation explores:

    •      The definition of “quality jobs,”
    •      Building the pipeline to equitable opportunity,
    •      The workforce of the future, and
    •      The role employers, institutions and individuals can play in helping our region
           become a talent engine and magnet for workers living in St. Louis.

            2021 State of the St. Louis Workforce Employer Survey
        NAICS                     Category Description                           Businesses             Percent
                                                                                  Surveyed
        NAICS 23         Construction                                                  39                  7.6%
        NAICS 31-33      Manufacturing                                                 32                  6.2%
        NAICS 42         Wholesale trade                                               20                  3.9%
        NAICS 44-45      Retail trade                                                  75                  14.5%
        NAICS 48-49      Transportation and warehousing                                12                  2.3%
        NAICS 51         Information                                                   12                  2.3%
        NAICS 52         Finance and insurance                                         30                  5.8%
        NAICS 53         Real estate and rental and leasing                            16                  3.1%
        NAICS 54         Professional and technical services                           36                  7.0%
        NAICS 56         Administrative and waste services                             13                  2.5%
        NAICS 61         Educational services                                           8                  1.6%
        NAICS 62         Health care and social assistance                             103                20.0%
        NAICS 71         Arts, entertainment, and recreation                           13                  2.5%
        NAICS 72         Accommodation and food services                               54                  10.5%
        NAICS 81         Other services                                                46                  8.9%
                         Other small sectors and Unclassified*                          7                  1.3%
                         Total                                                         516                100.0%

                                               (*) Other small sectors with Less than 1% of STL MSA Establishments:
                                                                   NAICS 11 Agriculture, forestry, fishing and hunting
                                                              NAICS 21 Mining, quarrying, and oil and gas extraction
                                                                                                      NAICS 22 Utilities
                                                                NAICS 55 Management of companies and enterprises

8                                       State of the St. Louis Workforce 2021            stlcc.edu/STLworkforce
ST. LOUIS ECONOMY The bi-state St. Louis Missouri- Illinois Metropolitan Statistical Area (MSA) includes St. Louis City and County and the surrounding 14 counties that straddle the Mississippi River. The St. Louis MSA has an estimated population of over 2.8 million. According to the U.S. Bureau of Economic Analysis, the area had a Gross Domestic Product (GDP) of nearly $173 billion in 2019. The industry with the highest GDP was finance, insurance, real estate, rental & leasing, with $34 billion. Private sector business accounted for 90% of the region’s output, while government accounted for the remaining 10%. Employment The St. Louis MSA has a diverse economy with a labor force of over 1.3 million that work in a wide range of industries. Health care and social assistance make up 16% of total employment, followed closely by wholesale and retail trade, which makes up 15% of total employment. Health care and social assistance has increased 20% over the last 10 years, going from 180,091 employees in 2010 to over 217,000 in 2020. The other services sector had the largest decrease, with employment declining by over 3,000, or 7%. Overall, the St. Louis economy increased by over 95,000 employees, about 8%, in the last 10 years. St. Louis is home to eight Fortune 500 companies: Centene (24), Emerson Electric (181), Reinsurance Group of America (207), Edward Jones (295), Graybar Electric (399), Ameren (469), Olin (472), and Post Holdings (474). State of the St. Louis Workforce 2021 stlcc.edu/STLworkforce 9
St. Louis Industry Employment

                     Source: Quarterly Workforce Indicators, U.S. Census Bureau, Annual Averages.

     Unemployment
     Unemployment rates in the St. Louis MSA peaked at 11.6% in April and May 2020 due to
     the effects of COVID-19. Current estimates from the Bureau of Labor Statistics show the
     St. Louis MSA seasonally adjusted unemployment rate was 4.7% in April 2021. This is
     lower than the national rate of 6.1% and higher than the state rate of 4.1%.
     Unemployment rates in the St. Louis MSA have consistently been below national rates.

           Seasonally Adjusted Unemployment Rate

            Source: Local Area Unemployment Statistics, U.S. Bureau of Labor Statistics.

10                                        State of the St. Louis Workforce 2021            stlcc.edu/STLworkforce
Unemployment Demographics
Unemployment rates vary greatly with age and sex. Younger workers, particularly men
under age 22, had unemployment rates at or above 10.7% in the St. Louis MSA during
2019. Men in the 16-19 age range had the highest rate at 11.5%. Unemployment rates
between males and females were similar in the 35-54 age groups; however, disparities
existed in both the younger and the oldest age groups. Most notably, males over age 75
had the lowest unemployment rate of all groups at 0.7%, while females over the age of
75 had a rate of 6.8%. St. Louis mirrors the state and national trend of higher
unemployment rates in workers less than 22 years of age. Nationally, the
unemployment rates for all ages was 4.6% for males and 4.4% for females. This is higher
than the St. Louis rate of 4.1% for males and 3.6% for females. Missouri unemployment
rates for all ages was the same in both males and females at 3.8%.
St. Louis MSA Unemployment Rates by Age and Sex
Source: 2019 American Community Survey, U.S. Census Bureau.
The old saying “education pays” holds true as it relates to income and risk of
unemployment. St. Louis MSA data for 2019 shows that having some college or an
associate degree, versus a high school diploma, reduces the unemployment rate by
1.6 points and provides $7,825 annually in average extra earnings. A bachelor’s degree
or higher further reduces the unemployment rate by 1.7 points and increases earnings.
St. Louis MSA Unemployment Rates and Earnings by
Education, Population 25 Years and Older
Unemployment Rates Educational Attainment Median Earnings
9.7% Less than high school graduate $25,146
4.9% High school graduate or GED $31,736
3.3% Some college or associate degree $39,561
1.6% Bachelor’s degree or higher $64,794*
* Bachelor’s ($57,452) and graduate ($72,136) degree medians.
Source: 2019 American Community Survey, U.S. Census Bureau.
State of the St. Louis Workforce 2021 stlcc.edu/STLworkforce 11The highest unemployment rates and lowest wages belong to those workers with less
than a high school education. Unemployment rates for workers who do not have a high
school diploma or GED are nearly double those of high school graduates, and more than
six times greater than workers with a bachelor’s degree or higher. Missouri shows
similar trends, with workers who do not have a high school education having an
unemployment rate of 7.2% versus a rate of 4.0% for high school graduates. Young
and/or less educated job seekers have a more difficult time finding employment.
Workforce Characteristics
In 2020, the largest jobholder age group was ages 35-44, representing 22% of the
workforce. The 25-34 age group closely followed, representing 21% of the workforce.
Workers age 14-21 made up only 7% of the workforce. The St. Louis age profile has
changed over time with the 55+ age groups having increased as a share of the
workforce, while the 45-54 age group has decreased. The 55+ age groups have grown
from 19% in 2010 to 24% in 2020. With nearly one-fourth of the workforce in the 55+
age groups, St. Louis mirrors the national trend of an aging workforce.
St. Louis MSA Age of the Workforce
Source: Quarterly Workforce Indicators, U.S. Census Bureau.
Education Attainment
Nearly one-half (48%) of the region’s 25 years and older population have a high school
diploma but no post-secondary degree. This is similar to the national rate of 47% and
lower than the state rate of 52%. Thirty-six percent of the St. Louis population has a
bachelor’s degree or greater, which is higher than both the state (30%) and national
(33%) rates.
12 State of the St. Louis Workforce 2021 stlcc.edu/STLworkforceEducational Attainment of the Population
Source: 2019 American Community Survey, U.S. Census Bureau. Population age 25 and over.
Labor Shed
2018 estimates from the Census Bureau showed that St. Louis
MSA employed over 1.1 million people. Most workers lived in
the area, but 130,701 commuted into the MSA for jobs, while
103,639 of the residents commuted outside of the St. Louis MSA
for work.
Commuting Distance
St. Louis MSA Workforce
Distance % of Workforce
Less than 10 miles 42%
10 to 24 miles 36%
25 to 50 miles 11%
Greater than 50 miles 10%
Source: U.S. Census Bureau, OnTheMap Application, Primary Jobs 2018.
Forty-two percent of the workforce commuted less than 10 miles to work, while 10%
traveled more than 50 miles.
Current Job Demand
Through new job growth or companies needing to fill vacant positions, there are always
job openings. One way to measure current employment demand is to track job postings.
Over the past year, there were over 375,000 online job postings in the St. Louis MSA.
The table on the next page lists jobs, grouped by typical education or training needed
and identified with their Standard Occupational Classification (SOC) code, with the most
online advertisements from June 1, 2020 through May 31, 2021 in the St. Louis MSA.
State of the St. Louis Workforce 2021 stlcc.edu/STLworkforce 13The top posted job overall was registered nurses (21,599) followed by retail
salespersons (10,949), and heavy and tractor-trailer truck drivers (10,373).
Several occupations, such as registered nurses, sales representatives, and customer
service representatives, were among the top long-term growth jobs and in the top job
advertisements over the past year. This indicates those occupations are in demand now
and will be in demand in the future.
Top St. Louis MSA Job Advertisements in the Past Year
High School or Less and/or Short-Term Training Online Job Ads
41-2031 Retail Salespersons 10,949
43-4051 Customer Service Representatives 10,176
53-7062 Laborers and Freight, Stock, and Material Movers 7,897
35-3021 Combined Food Preparation and Serving Workers 5,493
37-2011 Janitors and Cleaners 4,936
43-5081 Stock Clerks and Order Fillers 4,720
33-9032 Security Guards 3,702
37-2012 Maids and Housekeeping Cleaners 3,119
35-3031 Waiters and Waitresses 3,032
53-3031 Driver/Sales Workers 2,946
Moderate/Long-Term Training to Associate Degree Online Job Ads
29-1141 Registered Nurses 21,599
53-3032 Heavy and Tractor-Trailer Truck Drivers 10,373
41-4012 Sales Representatives, Wholesale and Manufacturing 9,653
41-1011 First-Line Supervisors of Retail Sales Workers 6,513
49-9071 Maintenance and Repair Workers, General 4,677
31-1014 Nursing Assistants 4,279
11-9051 Food Service Managers 3,689
43-6014 Secretaries and Administrative Assistants 3,511
31-9092 Medical Assistants 3,308
29-2061 Licensed Practical and Licensed Vocational Nurses 3,270
51-9199 Production Workers, All Other 2,947
Bachelor's Degree or Higher Online Job Ads
15-1132 Software Developers, Applications 10,067
15-1199 Computer Occupations, All Other 9,451
11-9199 Managers, All Other 7,333
11-9111 Medical and Health Services Managers 4,594
11-1021 General and Operations Managers 3,382
11-2022 Sales Managers 2,963
13-2011 Accountants and Auditors 2,796
13-1071 Human Resources Specialists 2,643
13-1111 Management Analysts 2,611
Source: Online Job Ads from June 1, 2020 through May 31, 2021. Burning Glass Technologies.
14 State of the St. Louis Workforce 2021 stlcc.edu/STLworkforceSkills and Certificates
Basic skills are requested in the majority of job advertisements, with communication
skills being the top demand of employers, requested in nearly one-third (31%) of total
job postings. The number one specialized skill was customer service, followed by
scheduling, and sales. Microsoft Office and its component products Word, Excel,
PowerPoint, and Access are the most requested software skills across all occupations
and industries. Other top requested software and programming skills included SQL,
software development, and Java.
Top Basic Skills Online Top Specialized Skills Online
Job Ads Job Ads
Communication 120,302 Customer Service 63,613
Teamwork / Collaboration 62,333 Scheduling 46,933
Physical Abilities 56,882 Sales 38,718
Organizational Skills 52,740 Cleaning 37,728
Detail-oriented 49,536 Patient Care 24,084
Problem-solving 44,808 Customer Contact 23,783
Microsoft Excel 38,108 Budgeting 22,914
Planning 37,606 Repair 22,910
Microsoft Office 35,290 Retail Industry Knowledge 21,955
Computer Literacy 34,278 Data Entry 21,107
Source: Online Job Ads from June 1, 2020 through May 31, 2021. Burning Glass Technologies.
The top requested certificate was a valid driver’s license, followed by registered nurse
and commercial driver’s license. One-half of the top requested certificates were
healthcare related. Several of the top certificates are available through short-term
training or through courses offered at a community college.
Top Certificates Online Top Software and Online
Job Ads Programming Skills Job Ads
Driver's License 46,092 SQL 9,962
Registered Nurse 18,672 Software Development 8,513
Commercial Driver's License 10,063 Java 8,466
First Aid CPR AED 6,999 Python 6,489
Security Clearance 6,324 Oracle 6,020
Basic Life Saving (BLS) 5,171 SAP 5,793
Advanced Cardiac Life Support 4,202 Software Engineering 5,211
Licensed Practical Nurse (LPN) 3,975 JavaScript 5,095
Basic Cardiac Life Support 3,868 Linux 4,546
American Heart Association Cert. 3,501 Salesforce 4,379
Source: Online Job Ads from June 1, 2020 through May 31, 2021. Burning Glass Technologies.
State of the St. Louis Workforce 2021 stlcc.edu/STLworkforce 15Hard-to-fill Jobs
Hard-to-fill jobs are those that are in high demand based on number of job postings
relative to total job postings in the St. Louis MSA. These are jobs that are in high or very
high demand in the St. Louis MSA with the longest time to fill, grouped by typical
education or training needed. Heavy and tractor-trailer drivers had the longest time to
fill at 50 days. Management and information technology occupations are most common
in the top hard-to-fill occupations.
St. Louis MSA Top Hard-to-fill Jobs
STL MSA Average Average Time
O*NET Occupation Annual Wage to Fill
High School Education or Less and/or Short-Term Training
Waiters and Waitresses $24,520 47 days
Home Health Aides $26,780 46 days
Landscaping and Groundskeeping Workers $32,720 44 days
Construction Laborers $57,750 42 days
Combined Food Preparation and Serving Workers, Incl. Fast Food $24,310 40 days
Janitors and Cleaners $31,340 40 days
Maids and Housekeeping Cleaners $24,840 37 days
Personal Care Aides $26,780 37 days
Light Truck or Delivery Services Drivers $43,390 36 days
Retail Salespersons $33,020 31 days
Moderate/Long-Term Training to Associate Degree
Heavy and Tractor-Trailer Truck Drivers $50,700 50 days
Insurance Sales Agents $70,650 44 days
Web Developers $70,990 43 days
Food Service Managers $58,950 42 days
Preschool Teachers, Except Special Education $35,060 42 days
Sales Representatives, Wholesale and Manufacturing $77,840 41 days
Cooks, Restaurant $46,060 39 days
Maintenance and Repair Workers, General $54,750 36 days
Licensed Practical and Licensed Vocational Nurses $48,120 37 days
Automotive Specialty Technicians $48,310 37 days
Bachelor's Degree or Higher
Loan Officers $88,330 46 days
Sales Agents, Financial Services $89,250 44 days
Software Developers, Applications $100,450 43 days
Marketing Managers $141,200 41 days
Financial Managers, Branch or Department $144,970 41 days
Market Research Analysts and Marketing Specialists $70,370 41 days
Database Administrators $88,260 41 days
Information Security Analysts $94,450 40 days
Sales Managers $149,410 38 days
Accountants $76,500 38 days
Sources: St. Louis MSA Hard-to-fill Jobs from June 1, 2020 through May 31, 2021. Burning Glass Technologies.
Wages from U.S. Bureau of Labor Statistics Occupational Employment Statistics.
16 State of the St. Louis Workforce 2021 stlcc.edu/STLworkforceProjected Job Demand
It is important to look into what jobs will be in demand in the future to ensure the
workforce is prepared. Employment projections through the year 2028, developed by
the Missouri Economic Research and Information Center (MERIC) in partnership with
the U.S. Department of Labor, estimate the jobs expected to be in greatest demand over
Jobs by 2028 with the Most Projected Openings
High School or Less and/or Short-Term Training Annual Openings
Combined Food Preparation and Serving Workers 6,022
Personal Care Aides 5,384
Cashiers 4,198
Retail Salespersons 4,045
Waiters and Waitresses 3,580
Customer Service Representatives 2,837
Laborers and Freight, Stock, and Material Movers 2,764
Janitors and Cleaners 2,223
Office Clerks, General 1,872
Stock Clerks and Order Fillers 1,706
Moderate/Long-Term Training to Associate Degree Annual Openings
Registered Nurses 2,502
Secretaries and Administrative Assistants 2,474
Cooks, Restaurant 1,895
Nursing Assistants 1,855
Heavy and Tractor-Trailer Truck Drivers 1,659
Bookkeeping, Accounting, and Auditing Clerks 1,376
Sales Representatives, Services, All Other 1,265
Sales Representatives, Wholesale and Manufacturing 1,212
First-Line Supervisors of Food Preparation and Serving Workers 1,169
Medical Secretaries 1,029
Fitness Trainers and Aerobics Instructors 980
Bachelor's Degree or Higher Annual Openings
General and Operations Managers 1,764
Accountants and Auditors 1,203
Business Operations Specialists, All Other 743
Software Developers, Applications 711
Market Research Analysts and Marketing Specialists 661
Elementary School Teachers, Except Special Education 621
Secondary School Teachers, Exc. Special & Career/Technical Education 612
Human Resources Specialists 579
Computer Systems Analysts 579
Source: Long-Term Occupational Projections 2018-2028, St. Louis Workforce Development Area, MERIC.
State of the St. Louis Workforce 2021 stlcc.edu/STLworkforce 17a ten-year period. The table shows the occupations, by typical education or training
needed, with top job openings by the year 2028 for the St. Louis Workforce
Development Area.
Occupations with the most openings are determined by looking at openings created by
new job (net) growth, as well as those created through the need for replacement
workers. Replacement openings occur due to retirement, turnover, or transferring to
another occupation. The top long-term jobs with the most projected openings are
combined food preparation and serving workers, personal care aides, and cashiers. Six
of the top 10 occupations in each of these training and education categories are clerical
occupations, while food service, sales, and business and financial each have four
occupations in the top 10.
18 State of the St. Louis Workforce 2021 stlcc.edu/STLworkforceEMPLOYER SURVEY
This 2021 employer survey marks our 13th annual telephone survey of companies
throughout the St. Louis metropolitan area. As in past years, our goal is to understand
the business climate, hiring trends, occupational skills, and demands from businesses
across the St. Louis region. This year’s survey targeted 516 employers in 16 employer
categories across 23 industry segments as defined by the North American Industry
Classification System (NAICS). These industries were selected because they represent a
composite picture of the regional economy.
A statistically significant sample was surveyed from each of the industry categories in
the ratio to that industry’s proportional representation in the St. Louis Metropolitan
Statistical Area (MSA). Geographically, the firms interviewed also represented the entire
St. Louis MSA. The number of employers surveyed in each industry category are listed in
the Methodology section.
Although the companies interviewed reflect a wide range of sizes as measured by
number of employees, most respondents for this year’s survey consisted of small- and
mid-sized businesses with fewer than 50 employees. This is in line with the
2021 Employer Survey Categories
State of the St. Louis Workforce 2021 stlcc.edu/STLworkforce 19respondents in past years.
Companies employing fewer
than five employees were not
selected for interview.
Each employer was asked a
series of 16 questions, several
with multiple parts, to
understand their hiring outlooks
and challenges, as well as
practices that either created
barriers to or opportunities for
employment and advancement. This is a reduction in the total number of questions from
the 2020 survey, where we added a number of questions specifically about the
immediate impact of the COVID-19 pandemic on employers’ hiring and workforce
decisions, but is still an increase from the number of questions asked in surveys before
the pandemic. New questions surrounding remote work, types of background checks
performed, significant employment level changes due to COVID-19, workforce
initiatives, and concerns for the future were retained in this year’s survey.
20 State of the St. Louis Workforce 2021 stlcc.edu/STLworkforceHiring Trends
It is no surprise that employers continued to cut back hiring sharply during the past 12
months compared to pre-pandemic years.
The Past Year
Only 23% of companies reported increased employment in 2021, a percentage point
lower than 2020 and significantly less than the 37% return in 2019. The number of
employers reporting unchanged employment levels during the past 12 months stayed
roughly consistent with the two previous years at 47%, but was lower in comparison
with past all-industry surveys where this response ranged 52% to 56%.
Change in Employment Levels over the Last 12 Months
A much larger percentage of employers (14%) reported significant staffing decreases
during the last year compared with any year since 2013. This response was
considerably higher than the 2020 results (8%), which is logical since last year’s survey
included both pandemic and pre-pandemic hiring in the 12-month look back. Decreases
overall (31%) were more than double the pre-pandemic rate and were higher than the
2020 results (29%).
However, just as we saw in 2020, some companies continued to hire into the pandemic,
with employers reporting significantly increased employment levels at a higher rate
(7.4%) than last year (6.5%). This was higher than the 2013 and 2015 results (6 and 7%
respectively), but lower than the 2019 rate (10%). Sixty-five percent of employers that
reported significant changes in employment levels attributed them to COVID-19, down
slightly from the 2020 results (69%).
Our first hiring look back that encompassed a full 12 months of the COVID-19 pandemic
was expected to show a negative trend, and the results confirm this has been the case
State of the St. Louis Workforce 2021 stlcc.edu/STLworkforce 21for the majority of regional employers. Just as they did last year, some companies
continued to add workers despite pandemic conditions, and as shown in the next
section, optimism about future economic conditions is high.
Looking Ahead
Last year, more than half (51%) of employers indicated that they expected to increase
staffing during the next 12 months. Optimism for 2021 is even greater, with nearly 63%
of employers reporting they plan to increase employment levels—the highest level
reported since our survey began. Twenty-one percent said they will increase
employment significantly, which is 7% greater than in 2020 and more than triple the
level reported in each of the four prior surveys. Continuing the trend seen last year,
considerably less than half of employers (35%) indicated that they expected hiring
levels to remain the same, once again indicating that most do not expect to be facing the
current economic conditions for long.
2021 survey responses indicated only half as many employers anticipated slightly
decreasing employment compared to 2020 (1.6% to 3.2%), while less than one percent
(0.6%) believe they will significantly decrease staffing levels.
Future Plans to Change Employment Levels in the Next 12 Months
Optimism is typical when employers are asked about planned changes to employment
levels, and this year’s survey results are no exception. But it appears that the
uncertainty around the pandemic had an outsized impact. When last year’s projection is
contrasted with the 2021 survey’s 12-month look back, it seems employers did not
expect the pandemic to last as long as it has. For example, in 2020, 14% of employers
expected to increase hiring significantly, while only 7% actually did so. Thirty-seven
percent stated they planned to increase slightly, while only 15% did. And in 2020 only
22 State of the St. Louis Workforce 2021 stlcc.edu/STLworkforce4% of employers said they expected to be decreasing employment over the next 12
months, while a massive 31% actually cut jobs.
Future Business Concerns
Starting last year, we asked employers to rate the importance of future business
concerns. Using a five-point scale—with 1 indicating no concern and 5 indicating very
concerned—we calculated the average importance of a variety of potential challenges in
the year to come.
While last year the COVID-19 pandemic was top of mind for most of the employers
surveyed, this year concerns about COVID ranked eighth. Employers are much more
concerned about normal business cycle issues such as attracting or retaining talent
(3.95), financial impacts on operations (3.73), and supply chain disruptions (3.71).
Employers reported being less concerned about workforce reductions (2.71) and tax or
trade uncertainties (2.8), although the importance of these issues was higher than in the
previous year. Of the 13 possible concerns, only two (consumer concerns about COVID
and employee concerns about COVID) were reported as less important than in 2020,
while attracting or retaining talent, lack of information for decision making, and lower
productivity jumped more than an entire point in importance. It is worth noting that the
average level of importance for all these business concerns shifted significantly higher
from 2.66 in 2020 to 3.28 in 2021.
Employer’s Top Concerns for the Future
Expanding Employment
The State of the St. Louis Workforce survey asked employers about perceived barriers to
expanding employment.
Skills Gaps
Since 2015, a shortage of workers with knowledge or skills has been the most common
response and 2021 was no exception, with nearly six in ten employers (58%) citing this
as a barrier. This represented a 17% increase compared to the 2020 response and was
the highest level reported since the survey was started.
State of the St. Louis Workforce 2021 stlcc.edu/STLworkforce 23You can also read