State of Vermont Deferred Compensation Plan 940050
←
→
Page content transcription
If your browser does not render page correctly, please read the page content below

State of Vermont
                                          Deferred
                                          Compensation Plan
                                          940050
                                          Plan Summary

                                          Presented by: Gabriel D’Ulisse
                                          Vice President and Managing Director

                                          As of: June 30, 2019

                                          Report contains information up
                                          through the last business day of
                                          the period end.

For Plan Sponsor or Consultant Use Only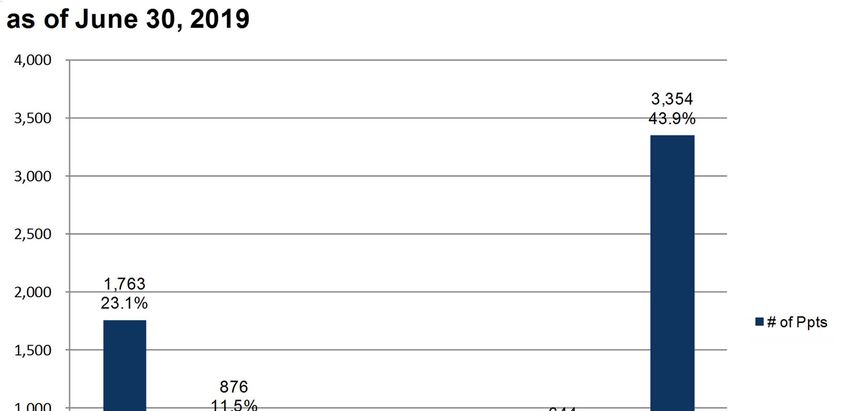
State of Vermont

Table Of Contents

 Section I:         Plan Summary
 Section II:        Economic Outlook

                                                             2
For Plan Sponsor or Consultant Use Only
State of Vermont

                                            Section I:
                                          Plan Summary

                                                             3
For Plan Sponsor or Consultant Use Only
State of Vermont

           Plan Summary and Benchmark Trends

                                                             4
For Plan Sponsor or Consultant Use Only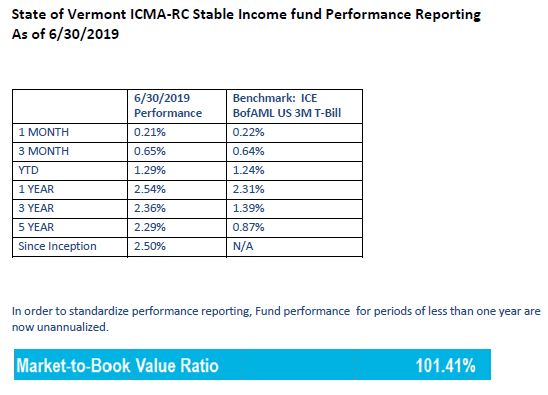
Historical Plan Statistics                                                     State of Vermont

Historical Plan Statistics                                                             12/31/2018
                                                                                   1/1/2018 -
                                                                                  12/31/2018
  Total Participants Balances                                                       $454,463,915
  Contributions*                                                                     $21,862,250
  Distributions*                                                                    ($28,796,971)
  Cash Flow                                                                          ($6,934,721)
Account Balances
  Average Participant Balance                                                            $60,660
  National Average Benchmark**                                                          $102,586
Participation / Deferrals
  Participation Rate                                                                        83.4%
  National Average Benchmark**                                                              79.2%
  Average Contribution Rate (%)                                                                 0.0%
  National Average Benchmark**                                                                  6.8%
  Total Participants w ith a Balance                                                        7,492
Asset Allocation
  % of Plan Assets in Stable Value                                                          22.3%
  Prudential % of Plan Assets in Stable Value                                              25.8%
  % of Plan Assets for GoalMaker Participants                                                   6.5%
  Participation Rate in GoalMaker                                                           13.8%
  Number of Participants in GoalMaker                                                       1,030
  Number of Participants in One Fund                                                        1,781
  Number of Participants in Four or More Funds                                              4,251
Distributions
  Number of Distributions*                                                                  3,229
  Amount of Distributions Representing Rollovers                                     $18,952,253
  % of Assets Distributed*                                                                      6.3%

   *Includes Rollovers                                                                                 5
   **External Benchmark Source: PLANSPONSOR Defined Contribution Annual Survey
Plan Summary State of Vermont
Plan Demographics Summary 3/31/2019 1/1/2019
1/1/2019- 4/1/2019-
3/31/2019 6/30/2019
Total Participants* 7,582 7,648
Active Participants 5,538 5,602
Terminated Participants 2,033 2,035
Suspended Participants 2 2
Multiple Status Participants*** 9 9
Average Participant Balance $64,919 $66,144
Average Account Balance for Active Participants $53,390 $54,315
Median Participant Balance $24,665 $24,753
Median Participant Balance for Active Participants $19,457 $19,718
Participants Age 50 and Over 4,441 4,464
Total Assets for Participants Age 50 and Over $410,747,495 $422,178,520
Total (Contributions + Rollovers In) $7,551,923 $7,561,145
Employee Contributions $6,143,692 $5,570,418
Employer Contributions $0 $0
Rollovers In $1,408,231 $1,990,727
Total Distributions ($9,942,004) ($9,210,861)
Percentage of Assets Distributed 2.0% 1.8%
Market Value Gain / Loss**** $41,549,804 $17,295,961
Total Participant Balances $492,215,407 $505,870,924
*Participant(s) with an account balance greater than $0.
*** Participant(s) with an account balance greater than $0 in more than one participant status category (e.g.
Active status in one subplan but Terminated status in another subplan).
****This is not the equivalent of a plan level return on investment due to the timing of additions, distributions
and underlying investment performance.
Rollovers In is the total dollars credited to participant accounts within the period defined that originated in
other qualified retirement plan accounts.
For Plan Sponsor or Consultant Use Only | Please refer to the end of this section for important notes and disclaimers.
6Plan Summary State of Vermont
Plan Features Participant Activity
GoalMaker 3/31/2019 6/30/2019 1/1/2019 - 4/1/2019 -
Call Center / Website Statistics
Plan Assets for Participants in GoalMaker $35,725,810 $42,838,872 3/31/2019 6/30/2019
% of Plan Assets for GoalMaker Participants 7.3% 8.5% Total Call Volume 859 632
# of Participants in GoalMaker 1,218 1,405
Participation Rate in GoalMaker 16.1% 18.4%
Prudential % of Participants in GoalMaker - As of 12/31/2018 50.8%
Roth 3/31/2019 6/30/2019
Roth Assets $11,145,607 $12,067,613
# of Participants in Roth 1,308 1,355
Participation Rate in Roth 17.3% 17.7%
Prudential % of Participants in Roth - As of 12/31/2018 12.5%
Stable Value 3/31/2019 6/30/2019
Participation Rate in Stable Value 60.9% 60.6%
% of Plan Assets in Stable Value 20.5% 20.0%
Prudential % of Plan Assets in Stable Value - As of 12/31/2018 25.8%
Transaction Summary Enrollment by Age Group
4/1/2019-6/30/2019
1/1/2019 - 4/1/2019 - Less Grand
Transactions 3/31/2019 6/30/2019 than 25 25-34 35-44 45-54 55-64 65+ Total
Total Enrollees* 174 179 Total 19 59 45 29 23 4 179
Number of Participants w ith Transfers 1,282 1,285
Distributions 854 864
*Number of participants that w ere enrolled into the plan w ithin the reporting period. This can
include those individuals w ho self enrolled or auto enrolled, if applicable on the plan. Rehires
may not be included if their original enrollment date falls outside the reporting period.
For Plan Sponsor or Consultant Use Only | Please refer to the end of this section for important notes and disclaimers. 7Plan Summary State of Vermont
Benchmark Trends – Plan Features
Prudential Book of Industry Plan Sponsor Plan Sponsor
Plan Features Your Plan
Business Average* Survey 2018** Survey 2019***
Auto Enrollment
No 52.4% 34.4% 41.3% 46.3%
(Administered Through Prudential)
Auto Enrollment Default Rate NA 3% (46.3% of Plans) 29.6% 40.7% 38.9%
Contribution Accelerator
No 49.6% 23.4% 33.6% 37.8%
(Administered Through Prudential)
GoalMaker® Yes 69.5% NA NA NA
Investment Options 24.0 13.3 26.3 22.8 24.9
IncomeFlex® No 25.2% 19.8% 7.1% 9.9%
Loans No 63.5% 78.1% 79.3% 91.6%
Plan Allows Roth Yes 31.0% 56.0% 68.5% 71.8%
Plan Allows Catch-Up Contributions
Yes 48.1% NA NA NA
(Administered Through Prudential)
This information should not be considered an offer or solicitation of securities, insurance products or services. No offer is intended nor should this material be construed as an offer of any product.
The information is being presented by us solely in our role as the plan’s service provider and/or record keeper.
© 2019 Prudential Financial, Inc. and its related entities. Prudential, the Prudential logo, the Rock symbol and Bring Your Challenges are service marks of Prudential Financial, Inc., and its related entities,
registered in many jurisdictions w orldw ide.
Prudential’s Book of Business averages are as of 12/31/2018
External Benchmark Source: PLANSPONSOR Defined Contribution Annual Survey
*Annual Survey, 2019 (Industry Specific Results) – Government County
**2018 Annual Survey, 2018 (Overall)
***2019 Annual Survey, 2019 (Overall)
8
For Plan Sponsor or Consultant Use OnlyPlan Summary State of Vermont
Benchmark Trends – Participant Behavior
Prudential Book of Industry Plan Sponsor Plan Sponsor
Plan Features Your Plan
Business Average* Survey 2018** Survey 2019***
Participation Rate 80.4% 71.0% 66.7% 79.3% 79.2%
Average Contribution Rate (%) NA 7.4% 6.7% 6.6% 6.8%
Average Account Balance $66,144 $64,203 $73,643 $97,903 $102,586
Median Account Balance $24,753 $64,672 $53,025 $75,000 $77,204
% of Plan Assets in Stable Value 20.0% 25.8% NA NA NA
% of Plan Assets in Day One Funds NA 0.8% NA NA NA
Average # of Funds Held 5.4 5.5 5.2 5.7 5.5
% of 55+ Participants Utilizing IncomeFlex® N/A 9.2% NA NA NA
% of Participants Utilizing GoalMaker® 18.4% 50.8% NA NA NA
% of Participants have Outstanding Active Loans N/A 14.2% 15.4% 13.0% 13.5%
Average Loan Balance N/A $7,665 $9,101 $10,189 $10,257
This information should not be considered an offer or solicitation of securities, insurance products or services. No offer is intended nor should this material be construed as an offer of any product.
The information is being presented by us solely in our role as the plan’s service provider and/or record keeper.
© 2019 Prudential Financial, Inc. and its related entities. Prudential, the Prudential logo, the Rock symbol and Bring Your Challenges are service marks of Prudential Financial, Inc., and its related entities,
registered in many jurisdictions w orldw ide.
Prudential’s Book of Business averages are as of 12/31/2018
External Benchmark Source: PLANSPONSOR Defined Contribution Annual Survey
*Annual Survey, 2019 (Industry Specific Results) – Government County
**2018 Annual Survey, 2018 (Overall)
***2019 Annual Survey, 2019 (Overall) 9
For Plan Sponsor or Consultant Use OnlyPlan Summary State of Vermont
Asset Allocation/Net Activity By Age
April 1, 2019 to June 30, 2019
Less than 25 25-34 35-44 45-54 55-64 65+ Total
Total Participant Balances $236,856 $8,327,981 $34,512,475 $100,784,609 $178,544,749 $183,464,254 $505,870,924
% Assets 0.0% 1.6% 6.8% 19.9% 35.3% 36.3% 100.0%
Contributions $41,121 $502,321 $856,362 $1,652,640 $2,010,886 $507,088 $5,570,418
Rollovers In* $1,735 $62,154 $204,320 $387,825 $570,818 $763,875 $1,990,727
Total (Contributions + Rollovers In) $42,856 $564,475 $1,060,682 $2,040,464 $2,581,704 $1,270,963 $7,561,145
Cash Distributions $0 $0 ($61,565) ($941,259) ($663,069) ($1,525,586) ($3,191,478)
Rollovers Out $0 ($2,580) ($129,185) ($702,779) ($2,638,196) ($2,546,643) ($6,019,383)
Total (Cash Distributions + Rollovers Out) $0 ($2,580) ($190,750) ($1,644,038) ($3,301,265) ($4,072,228) ($9,210,861)
Net Activity $42,856 $561,895 $869,932 $396,426 ($719,561) ($2,801,265) ($1,649,716)
Total Participants 80 913 1,312 1,874 2,038 1,433 7,650
Average Account Balance $2,961 $9,122 $26,305 $53,780 $87,608 $128,028 $66,127
Median Account Balance $1,712 $4,235 $13,414 $25,830 $43,454 $65,552 $24,753
Prudential Avg. Account Balance as of 12/31/2018 $2,900 $13,375 $39,050 $76,411 $106,786 $113,266 $64,203
*Rollovers In is the total dollars credited to participant accounts w ithin the period defined that originated in other qualified retirement plan accounts.
10
For Plan Sponsor or Consultant Use Only | Please refer to the end of this section for important notes and disclaimers.State of Vermont
Retirement Readiness
11
For Plan Sponsor or Consultant Use Only | Please refer to the end of this section for important notes and disclaimers.Plan Summary State of Vermont
Participation Rate 4/1/2019-6/30/2019
1/1/2019-3/31/2019 4/1/2019-6/30/2019
2.5%
Total Eligible To Contribute Population 5,735 5,808 17.2%
Contributing (A) 4,620 4,668
Enrolled Not Contributing (B) 965 997
Eligible Not Enrolled (C) 150 143
1/1/2019-3/31/2019 4/1/2019-6/30/2019
Participation Rate * 80.6% 80.4%
80.4%
Prudential Book of Business 12/31/2018 71.0%
Plan Sponsor Survey 2019 - National Average 79.2%
* Participation Rate is calculated by A/(A+B+C) Contributing Enrolled Not Contributing Eligible Not Enrolled
Definitions:
Contributing – Count of participants w ho are active/eligible and a contribution w as received to an employee source (w ithin the reporting period).
Enrolled Not Contributing – An individual w ho is enrolled in the plan, but did not have a contribution to an employee source (w ithin the reporting period).
Eligible Not Enrolled – An individual w ho meets the requirements to join the plan, but has not enrolled in the plan (as of close of business on the last business day of the
period).
Due to rounding, pie chart may not equal 100%
For Plan Sponsor or Consultant Use Only | Please refer to the end of this section for important notes and disclaimers.
12Plan Summary State of Vermont
Retirement Income Calculator (RIC) Analysis
4/1/2019 - 6/30/2019
Total Retirement Income Calculator Completions 509
Unique Completions 417
Contribution Rate Increase 0
Since Inception for Currently Active Participants as of 6/30/2019
Average Balance, RIC Participant $71,174
Average Balance, Non-RIC Participant $45,683
Average Contribution Rate, RIC Participant 0.00%
Average Contribution Rate, Non-RIC Participant 0.00%
Total Count of Participants w ith a RIC Gap 1,350
Average RIC Gap $2,885
Total Count of Participants w ith a RIC Surplus 540
Average RIC Surplus $3,875
Average Income Replacement, RIC Participant 71%
Average Income Replacement, Non-RIC Participant 0%
Total Retirement Income Calculator Completions - Number of RIC completions for the given time period. If a single participant completed the RIC multiple times within
the given time period, they would be counted multiple times.
Unique Completions: Total number of unique active/eligibles that completed the retirement income calculator during the reporting period
Contribution Rate Increases: Total number of active/eligibles that completed the retirement income calculator and increased their contribution rate.
Average Balance RIC Participant - For participants who have a balance greater than $0 that have previously completed the RIC - The total balance of active
participants divided by the total count of active participants
Average Balance Non-RIC Participant - For participants who have a balance greater than $0 that have NOT previously completed the RIC - The total balance of
active participants divided by the total count of active participants
Average Contribution Rate RIC Participant - For participants who have completed the RIC - The total of all contribution rates (%) for active participants who have
completed the RIC divided by the number of active participants that have completed the RIC who have non-zero contribution rates.
Average Contribution Rate Non RIC Participant - For participants who have NOT completed the RIC - The total of all contribution rates (%) for active participants who
have completed the RIC divided by the number of active participants that have completed the RIC who have non-zero contribution rates.
Average Income Replacement, RIC Participant - Calculated by summing the income replacement percentages of all active, eligible & suspended participants who
have completed the RIC divided by the total count of all those active, eligible & suspended participants that have completed the RIC. Individuals not enrolled in the
plan are excluded from the calculation.
Average Income Replacement, Non- RIC Participant - Calculated by summing the income replacement percentages of all active, eligible & suspended participants
who have not completed the RIC divided by the total count of all those active, eligible & suspended participants that have completed the RIC. Individuals not enrolled
in the plan are excluded from the calculation.
Participant - An individual who has enrolled in the plan and has a non-zero account balance.
13
For Plan Sponsor or Consultant Use Only | Please refer to the end of this section for important notes and disclaimers.State of Vermont
Plan Activity
14
For Plan Sponsor or Consultant Use Only | Please refer to the end of this section for important notes and disclaimers.Plan Summary State of Vermont
Contributions by Fund
INVESTMENT OPTIONS 1/1/2019 - 3/31/2019 % 4/1/2019 - 6/30/2019 % Change %
STATE OF VERMONT STABLE VALUE FUND $771,453 12.6% $692,168 12.4% ($79,285) -10.3%
VANGUARD INSTITUTIONAL INDEX FUND INSTITUTIONAL SHARES $515,995 8.4% $476,608 8.6% ($39,387) -7.6%
VANGUARD DEVELOPED MARKETS INDEX FUND INSTITUTIONAL SHARES $440,676 7.2% $432,769 7.8% ($7,908) -1.8%
AMERICAN FUNDS THE GROWTH FUND OF AMERICA CLASS R-6 $475,685 7.7% $423,546 7.6% ($52,139) -11.0%
VANGUARD MID-CAP INDEX FUND INSTITUTIONAL SHARES $443,533 7.2% $410,443 7.4% ($33,091) -7.5%
VANGUARD VALUE INDEX FUND INSTITUTIONAL SHARES $436,220 7.1% $383,178 6.9% ($53,042) -12.2%
T. ROWE PRICE RETIREMENT I 2030 FUND I CLASS $417,256 6.8% $370,646 6.7% ($46,610) -11.2%
T. ROWE PRICE RETIREMENT I 2020 FUND I CLASS $401,193 6.5% $364,324 6.5% ($36,869) -9.2%
VANGUARD TOTAL BOND MARKET INDEX FUND INSTITUTIONAL SHARES $369,109 6.0% $357,598 6.4% ($11,511) -3.1%
T. ROWE PRICE SMALL-CAP STOCK FUND I CLASS $370,513 6.0% $343,722 6.2% ($26,791) -7.2%
T. ROWE PRICE RETIREMENT I 2040 FUND I CLASS $297,093 4.8% $247,435 4.4% ($49,659) -16.7%
DODGE & COX BALANCED FUND $220,220 3.6% $207,492 3.7% ($12,729) -5.8%
DODGE & COX INTERNATIONAL STOCK FUND $178,192 2.9% $154,427 2.8% ($23,766) -13.3%
VANGUARD FTSE SOCIAL INDEX FUND INSTITUTIONAL SHARES $144,279 2.4% $132,094 2.4% ($12,185) -8.4%
T. ROWE PRICE RETIREMENT I 2050 FUND I CLASS $119,872 2.0% $120,476 2.2% $604 0.5%
LAZARD EMERGING MARKETS EQUITY PORTFOLIO INSTITUTIONAL SHARES $107,292 1.8% $97,158 1.7% ($10,134) -9.4%
T. ROWE PRICE RETIREMENT I 2010 FUND I CLASS $127,023 2.1% $94,198 1.7% ($32,825) -25.8%
CALVERT BOND FUND CLASS I $75,958 1.2% $65,387 1.2% ($10,570) -13.9%
PIMCO TOTAL RETURN ESG FUND INSTITUTIONAL CLASS $58,803 1.0% $56,631 1.0% ($2,172) -3.7%
FPA NEW INCOME FUND $53,333 0.9% $42,992 0.8% ($10,341) -19.4%
PAX BALANCED FUND INDIVIDUAL INVESTOR CLASS $38,927 0.6% $36,381 0.7% ($2,546) -6.5%
T. ROWE PRICE RETIREMENT BALANCED I FUND I CLASS $53,005 0.9% $33,435 0.6% ($19,570) -36.9%
PAX GLOBAL ENVIRONMENTAL MARKETS FUND INSTITUTIONAL CLASS $28,059 0.5% $27,311 0.5% ($748) -2.7%
Total Assets Contributed $6,143,692 100.0% $5,570,418 100.0% ($573,274) -9.3%
For Plan Sponsor or Consultant Use Only | Please refer to the end of this section for important notes and disclaimers. 15Plan Summary State of Vermont
Participant Distribution Statistics
Total Amount of Withdrawals Taken # of Withdrawals
1/1/2019 - 4/1/2019 - 1/1/2019 - 4/1/2019 -
Distribution Type 3/31/2019 6/30/2019 Change % Change 3/31/2019 6/30/2019 Change % Change
Termination $8,091,940 $7,299,070 ($792,870) -10% 281 329 48 17%
Direct Transfer $426,099 $588,694 $162,595 38% 8 9 1 13%
Death Distribution $529,423 $441,518 ($87,906) -17% 32 26 (6) -19%
Installment Payment $476,419 $476,619 $200 0% 443 448 5 1%
Required Minimum Distribution $322,170 $240,270 ($81,899) -25% 78 46 (32) -41%
QDRO $29,983 $135,401 $105,418 352% 1 3 2 200%
In-Service Withdraw al $47,943 -$463 ($48,405) -101% 8 1 (7) -88%
Hardship Withdraw al $18,010 $29,752 $11,743 65% 2 2 0 0%
Gross Adjustment $18 $0 ($18) -100% 1 0 (1) -100%
Grand Total $9,942,004 $9,210,861 ($731,142) -7% 854 864 10 1%
4/1/2019 - 6/30/2019
Amount of Withdraw als Taken # of Withdraw als
Distribution Sub-Type Age < 50 Age >= 50 Total Age < 50 Age >= 50 Total
Rollover $492,820 $5,526,563 $6,019,383 12 54 66
Cash $304,747 $2,886,731 $3,191,478 13 785 798
Grand Total $797,567 $8,413,294 $9,210,861 25 839 864
Termination - A w ithdraw al that is taken w hen the participant is active and terminating from employment or is already in a 'Terminated' status.
Direct Transfer - Non-taxable transfer of participant assets from one type of tax-deferred retirement plan or account to another.
Death Distribution - Distribution taken by a beneficiary. This could include required minimum distributions, installment payments, etc.
Installment Payment - An Installment distribution is a payment option that disburses funds over time (i.e. monthly, quarterly, yearly).
Required Minimum Distribution - Minimum amounts that a participant must w ithdraw annually upon reaching a certain age or retirement. This w ould exclude any beneficiary or QDRO accounts.
QDRO - Distribution taken by the recipient of a QDRO. This could include required minimum distributions, installment payments, etc.
In-Service Withdraw al - A distribution that is taken w hile the participant is still active, before termination from employment.
Hardship Withdraw al - A distribution w hich is requested by a participant because of an immediate and heavy financial need that cannot be satisfied from other resources.
Gross Adjustment - The total of all adjustments made to an account or plan in absolute terms, regardless of w hether or not the adjustments w ere positive or negative.
16
For Plan Sponsor or Consultant Use Only | Please refer to the end of this section for important notes and disclaimers.Plan Summary State of Vermont
Participant Transaction Statistics
7/1/2018 - 10/1/2018 - 1/1/2019 - 4/1/2019 -
9/30/2018 12/31/2018 3/31/2019 6/30/2019
Call Center
Unique Callers 579 674 541 411
Total Call Volume 938 1,120 859 632
7/1/2018 - 10/1/2018 - 1/1/2019 - 4/1/2019 -
Call Center Reason Category 9/30/2018 12/31/2018 3/31/2019 6/30/2019
Account Explanations 243 210 195 150
Allocation Changes & Exchange 20 22 16 7
Contributions 16 19 19 22
Disbursements 400 591 410 329
Enrollments 5 1 3 1
Forms 11 3 0 3
Fund Information 6 8 21 9
Hardships 12 18 11 14
IFX 3 5 4 0
IVR or Web Assistance 122 170 50 17
Loans 4 1 6 2
Other 2 1 10 19
Payment Questions 0 0 0 0
Plan Explanations 29 22 18 18
Regen Reg Letter 0 0 0 0
Status of Research 11 13 7 3
Tax Information 0 0 45 7
Website Processing 54 36 44 31
Total 938 1,120 859 632
Definitions:
Unique Callers – The number of individuals that spoke to a Participant Service Center Representative during the reporting period (e.g., If the same individual called five
times during the reporting period, they would only be counted once).
Total Call Volume – The number of calls to a Participant Service Center Representative during the reporting period (e.g., If the same individual called five times during
the reporting period, they would be counted five times).
For Plan Sponsor or Consultant Use Only | Please refer to the end of this section for important notes and disclaimers. 17Plan Summary State of Vermont
Roth Summary
Roth Assets Roth Participants
$12,200,000 $12,067,613 1,360 1,355
$12,000,000 1,350
$11,800,000 1,340
$11,600,000 1,330
$11,400,000 1,320
$11,145,607 1,308
$11,200,000 1,310
$11,000,000 1,300
$10,800,000 1,290
$10,600,000 1,280
3/31/2019 6/30/2019 3/31/2019 6/30/2019
3/31/2019 6/30/2019
Roth Assets $11,145,607 $12,067,613
# of Participants in Roth 1,308 1,355
Partcipation Rate in Roth 17.3% 17.7%
Prudential % of Participants in Roth - As of 12/31/2018 12.5%
For Plan Sponsor or Consultant Use Only | Please refer to the end of this section for important notes and disclaimers. 18State of Vermont
Investment Diversification
19
For Plan Sponsor or Consultant Use Only | Please refer to the end of this section for important notes and disclaimers.Plan Summary State of Vermont
Assets by Asset Class and Age Asset Allocation
as of June 30, 2019
Asset Class Your Plan Assets as of 6/30/2019 Your Plan % as of 6/30/2019
100%
90% Stable Value $100,973,536 20.0%
80% Fixed Inc-Domestic $36,797,753 7.3%
70% Allocation $115,326,416 22.8%
60%
Equity - U.S. Large $150,441,738 29.7%
50%
Equity - U.S. Mid/Small $64,178,496 12.7%
40%
Equity - Glbl / International $37,654,561 7.4%
30%
20% Alternative / Other $498,424 0.1%
10% Total Participant Balances $505,870,924 100.0%
0%
Less than 25 25-34 35-44 45-54 55-64 65+
Stable Value Fixed Inc-Domestic Allocation
Equity - U.S. Large Equity - U.S. Mid/Small Equity - Glbl / International
Alternative / Other
Fund Utilization By Age
as of June 30, 2019
Less than 25 25-34 35-44 45-54 55-64 65+ Total
Participants Invested in Only One Fund 21 157 289 388 484 424 1,763
Average # of Funds per Participant 5.3 6.8 6.4 5.7 4.9 4.0 5.4
Prudential Participants Avg. # of Funds per Participant as of 12/31/2018 6.1 6.0 5.8 5.6 5.4 4.1 5.5
% of Plan Assets in Stable Value 7.5% 2.6% 5.3% 9.3% 21.7% 27.7% 20.0%
Prudential % of Plan Assets in Stable Value as of 12/31/2018 11.3% 10.1% 12.3% 17.5% 29.3% 47.1% 25.8%
20
For Plan Sponsor or Consultant Use Only | Please refer to the end of this section for important notes and disclaimers.Plan Summary State of Vermont
Utilization by Fund
as of June 30, 2019
Ppts Using as Sole
INVESTMENT OPTIONS Balance % Invested in Fund # of Ppts Investment
STATE OF VERMONT STABLE VALUE FUND $100,973,536 20.0% 4,633 534
VANGUARD INSTITUTIONAL INDEX FUND INSTITUTIONAL SHARES $57,718,621 11.4% 2,720 91
AMERICAN FUNDS THE GROWTH FUND OF AMERICA CLASS R-6 $40,288,070 8.0% 3,911 19
DODGE & COX BALANCED FUND $36,333,146 7.2% 1,143 53
T. ROWE PRICE SMALL-CAP STOCK FUND I CLASS $34,611,515 6.8% 3,935 6
VANGUARD VALUE INDEX FUND INSTITUTIONAL SHARES $33,492,828 6.6% 3,810 8
VANGUARD MID-CAP INDEX FUND INSTITUTIONAL SHARES $29,566,981 5.8% 3,877 12
T. ROWE PRICE RETIREMENT I 2020 FUND I CLASS $29,262,273 5.8% 613 238
T. ROWE PRICE RETIREMENT I 2030 FUND I CLASS $20,053,929 4.0% 601 238
VANGUARD FTSE SOCIAL INDEX FUND INSTITUTIONAL SHARES $18,942,220 3.7% 663 25
VANGUARD TOTAL BOND MARKET INDEX FUND INSTITUTIONAL SHARES $18,583,847 3.7% 2,757 1
VANGUARD DEVELOPED MARKETS INDEX FUND INSTITUTIONAL SHARES $15,783,272 3.1% 3,077 0
DODGE & COX INTERNATIONAL STOCK FUND $13,032,103 2.6% 2,002 4
T. ROWE PRICE RETIREMENT I 2040 FUND I CLASS $11,629,380 2.3% 500 240
T. ROWE PRICE RETIREMENT I 2010 FUND I CLASS $9,484,673 1.9% 277 104
LAZARD EMERGING MARKETS EQUITY PORTFOLIO INSTITUTIONAL SHARES $6,951,905 1.4% 1,881 6
PIMCO TOTAL RETURN ESG FUND INSTITUTIONAL CLASS $6,714,561 1.3% 1,807 2
FPA NEW INCOME FUND $6,633,993 1.3% 375 7
CALVERT BOND FUND CLASS I $4,865,353 1.0% 1,526 2
T. ROWE PRICE RETIREMENT BALANCED I FUND I CLASS $4,159,612 0.8% 236 39
PAX BALANCED FUND INDIVIDUAL INVESTOR CLASS $2,299,841 0.5% 195 2
T. ROWE PRICE RETIREMENT I 2050 FUND I CLASS $2,103,563 0.4% 253 127
PAX GLOBAL ENVIRONMENTAL MARKETS FUND INSTITUTIONAL CLASS $1,887,280 0.4% 626 3
SELF DIRECTED BROKERAGE ACCOUNT $498,424 0.1% 9 0
Total $505,870,924 100.0%
The funds in bold type denote inclusion in the GoalMaker® product.
21
For Plan Sponsor or Consultant Use Only | Please refer to the end of this section for important notes and disclaimers.Plan Summary State of Vermont
Investment Utilization
Due to rounding, bar graph may not equal 100%
22
For Plan Sponsor or Consultant Use Only | Please refer to the end of this section for important notes and disclaimers.Plan Summary State of Vermont
GoalMaker® Participation
as of 6/30/2019
9/30/2018 12/31/2018 3/31/2019 6/30/2019 Percentage of Assets by
Plan Assets for Participants in GoalMaker $26,837,624 $29,484,307 $35,725,810 $42,838,872 GoalMaker® Participation Portfolio -
# of Participants in GoalMaker 881 1,030 1,218 1,405 As of 6/30/2019
Participation Rate in GoalMaker 11.9% 13.8% 16.1% 18.4%
% of Plan Assets for GoalMaker Participants 5.4% 6.5% 7.3% 8.5%
15.4%
26.5%
Prudential Book of Business For Plans Offering GoalM aker – As of 12/31/2018
The participation rate in GoalMaker is 50.8%.
The percentage of plan assets for GoalMaker participants is 20.7%.
Conservative Moderate Aggressive
Participant Age Range Total
Active/Suspended Terminated Active/Suspended Terminated Active/Suspended Terminated
Less than 25 1 0 11 3 21 1 37
25-34 14 0 146 5 166 5 336
35-44 20 0 155 6 122 3 306
58.1%
45-54 43 0 214 6 102 3 368
55-64 55 10 175 13 42 5 300
65+ 19 5 17 10 5 2 58 Conservative Moderate Aggressive
Total 152 15 718 43 458 19 1,405
Conservative Moderate Aggressive
Participant Age Range Total
Active/Suspended Terminated Active/Suspended Terminated Active/Suspended Terminated
Less than 25 $2,039 $0 $47,519 $5,090 $44,608 $829 $100,085
25-34 $32,127 $0 $832,203 $8,046 $1,289,113 $55,104 $2,216,594
35-44 $196,567 $0 $2,824,616 $93,299 $2,762,418 $6,339 $5,883,238
45-54 $1,275,517 $0 $6,566,935 $157,767 $3,632,727 $180,055 $11,813,001
55-64 $2,477,289 $1,111,681 $8,141,173 $1,319,562 $2,250,047 $588,359 $15,888,111
65+ $707,260 $793,388 $2,485,095 $2,427,354 $201,654 $323,091 $6,937,843
Total $4,690,799 $1,905,070 $20,897,540 $4,011,119 $10,180,567 $1,153,778 $42,838,872
0.0% 0.8 Years 18.4%
average contribution rate (%) for active average length of time GoalMaker GoalMaker participation rate for those who
GoalMaker participants participants have been enrolled in actively elected GoalMaker
GoalMaker
Due to rounding, pie chart may not equal 100%
For Plan Sponsor or Consultant Use Only | Please refer to the end of this section for important notes and disclaimers. 23Plan Summary State of Vermont
Asset Allocation by Age Group
100%
90%
80%
70%
60%
50%
40%
30%
20%
10%
0%
Less than 25 25-34 35-44 45-54 55-64 65+
Stable Value Fixed Inc-Domestic Allocation
Equity - U.S. Large Equity - U.S. Mid/Small Equity - Glbl / International
Alternative / Other
As of June 30, 2019
Asset Class Less than 25 25-34 35-44 45-54 55-64 65+ Total
Stable Value $17,846 $213,641 $1,818,951 $9,381,589 $38,793,230 $50,748,278 $100,973,536
Fixed Inc-Domestic $7,501 $357,396 $1,834,104 $6,251,887 $15,669,154 $12,677,710 $36,797,753
Allocation $43,987 $1,649,154 $10,699,347 $26,925,921 $41,154,676 $34,853,331 $115,326,416
Equity - U.S. Large $61,375 $2,441,755 $9,083,032 $32,257,932 $50,529,611 $56,068,032 $150,441,738
Equity - U.S. Mid/Small $48,372 $1,712,397 $6,033,248 $16,452,782 $20,537,178 $19,394,519 $64,178,496
Equity - Glbl / International $57,775 $1,953,637 $5,029,097 $9,431,922 $11,797,295 $9,384,834 $37,654,561
Alternative / Other $0 $0 $14,696 $82,575 $63,605 $337,549 $498,424
Total Assets $236,856 $8,327,981 $34,512,475 $100,784,609 $178,544,749 $183,464,253 $505,870,924
% of Assets 0.0% 1.6% 6.8% 19.9% 35.3% 36.3% 100.0%
Total Participants 80 913 1,312 1,874 2,038 1,433 7,650
Avg Account Balance $2,961 $9,122 $26,305 $53,780 $87,608 $128,028 $66,127
For Plan Sponsor or Consultant Use Only | Please refer to the end of this section for important notes and disclaimers.
24Plan Summary State of Vermont
Rep Stats
7/1/2018 - 10/1/2018- 1/1/2019- 4/1/2019-
9/30/2018 12/31/2018 3/31/2019 6/30/2019 Total
Group Presentations 16 12 17 16 61
Individual Participant Meetings 412 306 585 694 1,997
New Enrollments as a result of Group/Individual Meeting* 106 76 109 119 410
GoalMaker as a result of Group/Individual Meeting* 147 108 132 215 602
Contribution Rate Increases 170 101 188 173 632
Number of Rollovers 16 18 15 37 86
Rollover Dollars $573,213 $661,534 $792,431 $1,990,726 4,017,904
*Enrollments above obtained by TDA Education Representatives
25
For Plan Sponsor or Consultant Use Only | Please refer to the end of this section for important notes and disclaimers.Plan Summary State of Vermont For Plan Sponsor or Consultant Use Only | Please refer to the end of this section for important notes and disclaimers. 26
Plan Summary                                                State of Vermont

 Assets and contributions reflect actual participant account balances and do not include outstanding loan balances, forfeitures, and / or expense account assets.
 Customer should promptly report any inaccuracy or discrepancy to the brokerage firm(s).
 All oral communications should be re-confirmed in writing to protect the customer’s legal rights, including rights under the Securities Investor Protection act (SIPA).
 This information should not be considered an offer or solicitation of securities, insurance products or services. No offer is intended nor should this material be
 construed as an offer of any product. The information is being presented by us solely in our role as the plan’s service provider and or record keeper.
 Retirement products and services are provided by Prudential Retirement Insurance and Annuity Company, Hartford, CT, or its affiliates.
 © 2019 Prudential Financial, Inc. and its related entities. Prudential, the Prudential logo, the Rock symbol and Bring Your Challenges are service marks of
 Prudential Financial, Inc., and its related entities, registered in many jurisdictions worldwide.
 Prudential’s Book of Business averages are as of 12/31/2018.

                                                                                                                                                                       27
For Plan Sponsor or Consultant Use Only                                                                                                                      27
State of Vermont
Section II: Economic Outlook
28
For Plan Sponsor or Consultant Use OnlyECONOMIC OUTLOOK:
FREQUENTLY ASKED QUESTIONS
by Robert F. DeLucia, CFA
Consulting Economist
The equity market faces Summary and Major Conclusions:
certain headwinds in the
▪ The recent truce between China and the US reached at the G-20 summit in Osaka
short term but should rally must be kept in perspective. In the plus column, the two countries agreed to a freeze
on tariffs for an unspecified period and to resume negotiations.
later this year and 2020.
Most likely catalysts for a ▪ In the negative column, the most crucial strategic trade issues involving technology
theft remain unresolved and could require years of negotiations. The most likely
shift in equity momentum
medium-term outcome would be an agreement to open China’s markets in exchange
include a more substantive for a phase-out of US tariffs.
and durable US-China
▪ Following an outright boom in 2018, US corporate earnings slowed abruptly in
agreement on trade; positive recent quarters, and have currently stabilized on a lofty plateau. While the growth
rate has peaked for this cycle, the absolute level of company earnings has not
surprises in company
peaked and should increase in both 2020 and 2021.
earnings reports; policy rate
▪ Wall Street warnings of severe weakness in the domestic economy are not supported
cuts by the Federal Reserve
by the facts. Real wages are increasing at a solid pace; consumer and service sector
at both its July and spending is strong; payrolls are expanding; the US banking system is the healthiest
in decades; and credit conditions are extremely favorable.
September FOMC meetings;
a strengthening in US ▪ Monthly employment data from the Labor Department are notoriously volatile, as
evidenced in recent reports. A smoothed average covering a several-month timeframe
manufacturing; and
reveals a moderate but steady decline in new job creation over the past six months.
concrete news of a rebound
▪ Many economists have been surprised by the unusual stability in inflation because of
in Chinese imports.
their failure to understand the unique long-term structural forces that continue to
exert downward pressure on inflation. The most important of these forces is fierce
global competition that deprives businesses of pricing power.
▪ Persistently low inflation can also be explained by the rapid pace of technological
innovation that has resulted in steadily declining operating costs. Companies
continue to adopt new business models that emphasizes cost-reduction in the
production and distribution of goods and services.
29▪ The central theme with respect to the housing market is a fundamental shortage of
single-family homes at a time of significant pent-up demand for housing. The supply
of single-family homes for sale is hovering near all-time lows.
▪ Falling mortgage rates, rapid growth in household incomes, a strong rebound in
household formations, and a healthy labor market should boost the demand for
single-family homes.
▪ The equity market faces certain formidable headwinds in the short term but should
rally later this year and in 2020. Most likely catalysts for a shift in equity momentum
include a more substantive and durable US-China agreement on trade; positive
surprises in company earnings reports; a strengthening in US manufacturing; and
news of a rebound in Chinese imports.
World financial markets continue to be jolted by rapidly changing economic,
political, policy, and geopolitical developments, each of which has contributed to
increased volatility in asset prices. This week’s Economic Perspective responds to
common questions regarding the outlook for the economy.
HOW SHOULD INVESTORS INTERPRET RECENT DEVELOPMENTS INVOLVING
US TRADE POLICY?
The recent truce between China and the US reached at the G-20 summit in
Osaka must be kept in perspective. In the plus column, the two countries agreed
to freeze tariffs for an unspecified period, and to resume negotiations that broke
down in early May. China also agreed to increase its imports of US agricultural
goods. Mutual agreement of the status quo means continuation of US tariffs of
25% on roughly $315 billions of Chinese exports and retaliatory Chinese tariffs
of 25% on $115 billions of US exports.
In the negative column, the agreement was no more than a handshake, and the
most crucial strategic trade issues — those involving a broad range of unfair
trade practices on the part of the Chinese government — remain unresolved.
These include intellectual property theft; forced technology transfers imposed on
US subsidiaries doing business in China; dumping of Chinese-made goods onto
the world market at below-cost prices; and various arbitrary non-tariff restrictions
placed on Chinese imports.
What should investors expect from here? My low-conviction assumption is that
the two countries will ultimately accept a more comprehensive agreement,
whereby China will agree to open its markets and remove various restrictions on
US exports. The result is likely to be a significant increase in the current $125
billions of US exports. In exchange, the US will agree to phase out the current
25% tariffs on $315 billions of Chinese imports. However, a substantive
agreement on critical technology-related issues could require years of
negotiations.
30HAVE CORPORATE PROFITS PEAKED FOR THE CURRENT BUSINESS CYCLE?
Following an outright boom in 2018, corporate earnings slowed abruptly in
recent quarters and have stabilized on a lofty plateau. Business profits tend to
move in tandem with nominal (current dollar) US GDP, which is currently in a
slowdown phase. Therefore, based upon my expectations for a solid recovery in
US GDP in 2020, profit growth should accelerate once again next year.
Major conclusions with respect to US company earnings are as follows:
Earnings growth peaked in 2018 at an annual rate of 25%
The absolute level of earnings has not peaked: Following the current period
of stabilization, another upleg in company earnings should begin in 2020
Following a period of minimal growth during most of this year, company
earnings could expand at a 10% to 15% rate in 2020 and by 5% to 10%
in 2021
A RECENT REPORT FROM MORGAN STANLEY CONCLUDED THAT “BUSINESS
CONDITIONS ARE AT THEIR WORST LEVEL SINCE THE 2008 FINANCIAL
CRISIS.” DOES THIS ANALYSIS HAVE MERIT?
I am unable to find any tangible evidence to support such an extreme analysis. It
is true that the rate of economic growth is in a slowdown phase that could persist
for a while longer. It is also true that the manufacturing sector is in a slump and
that growth in monthly employment data has been in a slowing trend. These
conditions can best be captured in the recent slowdown in trendline GDP growth
from 3% in 2018 to only 2% this year. However, these factors on their own do
not equate to a recession any time soon.
The underlying strength of the US economy can be best measured by the
following factors:
Real wages are increasing at the fastest rate in several years
Spending in the service and household sectors is growing at a 2.5% pace
Various measures indicate that the demand for labor remains strong
The US banking system is the healthiest in many decades
Credit conditions are extremely favorable as measured by credit availability
Housing construction appears to be on a recovery path
The small business sector is expanding at a solid pace
31 Although currently on a plateau, measures of corporate profitability — such
as profit margins and return on shareholders’ equity — are at multi-year
highs
In short, I find it very difficult to accept the conclusion that current business
conditions are at their worst level since the 2008 financial crisis. The
performance of the US economy in 2018 was the best since the 1990s; current
underlying conditions are slightly less favorable, but are expected to improve
steadily as 2020 unfolds.
HOW SHOULD INVESTORS INTERPRET THE RECENT VOLATILITY IN
EMPLOYMENT DATA?
Monthly employment data from the Labor Department are notoriously volatile, as
evidenced in recent reports. For example, monthly increases in the number of
workers on nonfarm payrolls are as follows: 224,000 (June), 72,000 (May),
216,000 (April), 153,000 (March), 56,000 (February), and 312,000 (January).
As I have discussed on numerous occasions, a smoothed average over a several-
month timeframe paints a more accurate picture.
A smoothed average calculated over recent months reveals the following: An
average increase in net new jobs of 172,000 over the past three months; an
average of 180,000 over the past six months; and an average of 195,000 over
the past 12 months. This monthly trend portrays a slowing trend over the past 12
months — but is far from a collapse.
There are two primary questions for investors: How fast is the labor market
weakening, and what are the reasons for the slowdown? A composite of
employment data suggests that the slowdown in hiring is occurring at a moderate
pace and that the labor market remains healthy. The single most reliable gauge
of the health of labor markets is the weekly report on initial claims for
unemployment insurance, which has stabilized at a 50-year low.
With respect to causes, there are several factors that might explain the mild
slowdown in hiring, but the most obvious is the anxiety and confusion
surrounding US trade policy. In principle, most firms are inherently reluctant to
expand operations during periods of uncertainty. It seems reasonable to assume
that net job creation will continue to moderate in coming months until there is
greater clarity regarding trade policy.
32WHY HAS INFLATION FALLEN SHORT OF ECONOMIST FORECASTS?
The primary explanation is that most economists have not considered various
long-term structural forces that are exerting downward pressure on inflation.
These forces fall into three categories:
Fiercely competitive conditions within the global economy that have
deprived businesses of pricing power
The rapid pace of technological innovation resulting in rapid substitution of
capital for labor resulting in steadily declining operating costs
Widespread implementation of new business models that emphasize
cost-reduction in the production and distribution of goods and services
The Internet provides a readily available source of price comparisons for
consumers, thereby reinforcing price restraint among producers. E-commerce, as
exemplified by Amazon, offers more cost-effective delivery and distribution
channels. The growing use of robots to automate factories, retail stores, and
warehouses achieve cost efficiencies that can be passed on to consumers in the
form of lower selling prices.
An additional factor is the extraordinary strength of the US dollar, which recently
rose to its highest level since 2002. A rising dollar exerts downward pressure on
import prices; competitive pressures force domestic producers to match the lower
prices of imported goods. US import prices are currently declining at a 2%
annual rate.
Business cycle-related forces will eventually trigger a temporary rise in inflation,
but not within the next year. Inflation is a lagging indicator and should continue
to soften in lagged response to global economic weakness and a strong dollar. A
cyclical rise in inflation next year should push core consumer inflation back to
2%, with a possible cyclical peak of 2.5% in 2022.
WHY SHOULD INVESTORS BE OPTIMISTIC REGARDING THE OUTLOOK FOR
RESIDENTIAL CONSTRUCTION?
An expected rebound in the housing market has not yet occurred, as depicted in
disappointing monthly data on housing sales and new construction. Nonetheless,
there is cause for optimism, based upon simple supply and demand analysis.
The central theme with respect to the residential housing market is that there is
currently a fundamental shortage of single-family homes at a time of significant
pent-up demand for housing. This conclusion is reflected in several data points:
33 The number of existing homes for sale currently numbers 1.75 million, the
lowest in more than two decades. The number of unsold homes is the
equivalent of only four months’ supply, more than 35% below its long-term
average.
The vacancy rate for single-family rental homes has plunged to 1.45%, the
lowest level in more than 25 years.
New construction has failed to keep pace with household formation, the
ultimate determinant of the underlying demand for housing. New
household formation has averaged 1.35 million over the past several years,
and has recently accelerated to 1.5 million over the past two years, well in
excess of housing starts of 1.2 million.
Because of financial constraints, young adults are currently renting to a
larger extent than ever before. The mix of rental and ownership is in the
process of shifting back to ownership, although this reversal could unfold
at a slow pace.
Applications for mortgage loans are at the highest level since 2007.
Falling mortgage rates and a healthy labor market should boost the demand
for single-family houses. Thirty-year fixed-rate mortgage rates have
declined from 5% to less than 4% in recent months.
My forecast assumes that residential construction will increase at an 8-10% rate
in 2020, augmenting real GDP growth by 0.5%.
WHAT CATALYSTS ARE NEEDED TO SPARK A SUSTAINED RALLY IN WORLD
EQUITY MARKETS?
By way of background, my forecast assumes that the economy is experiencing an
interim slowdown that will not culminate in a recession. I also assume that the
rate of economic growth will accelerate later this year and in 2020, accompanied
by a recovery in company earnings. With the Federal Reserve in an
accommodative mode for an extended period, the path of least resistance for the
equity market should be upward.
That said, the equity market faces certain formidable economic and geopolitical
headwinds in the short term. Most likely catalysts for a shift in equity momentum
include the following:
A more substantive agreement on trade between China and the US,
perhaps involving Chinese initiatives to open its market and to purchase
more US goods in exchange for a rollback of US tariffs
34 Positive surprises in company earnings reports along with more optimistic
forward guidance for investors regarding business prospects in 2020
A bottoming and subsequent rebound in US manufacturing indicators
Policy rate cuts by the Federal Reserve at both its July and September
FOMC meetings
News of a rebound in China’s economy, most notably import demand,
which would be a signal to investors that the world economy would also
recover with a time lag
The bottom line is that a combination of investor concerns over trade policy, US
and world economic weakness, and profit margin pressures is likely to act as
headwinds for the equity market for a while longer. I continue to believe that
2020 will be a good year for both the economy and the financial markets.
35Robert F. DeLucia, CFA, was formerly Senior
Economist and Portfolio Manager for Prudential
Retirement. Prior to that role, he spent 25 years at
CIGNA Investment Management, most recently serving
as Chief Economist and Senior Portfolio Manager. He
currently serves as the Consulting Economist for
Prudential Retirement. Bob has 45 years of
investment experience.
This material is intended to provide information only. This material is not intended as advice or recommendation about investing or managing your retirement
savings. By sharing this information, Prudential Retirement® is not acting as your fiduciary as defined by the Department of Labor or otherwise. If you need
investment advice, please consult with a qualified professional.
The opinions and recommendations herein do not take into account individual client circumstances, objectives, or needs and are not intended as
recommendations of particular securities, financial instruments or strategies to particular clients or prospects. No determination has been made regarding
the suitability of any securities, financial instruments or strategies for particular clients or prospects. For any securities or financial instruments mentioned
herein, the recipient(s) of this report must make its own independent decisions.
Certain information contained herein may constitute “forward-looking statements,” (including observations about markets and industry and regulatory
trends as of the original date of this document). Due to various risks and uncertainties, actual events or results may differ materially from those reflected or
contemplated in such forward-looking statements. As a result, you should not rely on such forward-looking statements in making any decisions. No
representation or warranty is made as to future performance or such forward-looking statements.
The financial indices referenced herein are provided for informational purposes only. You cannot invest directly in an index. The statistical data regarding
such indices has been obtained from sources believed to be reliable but has not been independently verified.
Bloomberg Barclays U.S. Treasury Inflation-Protected Securities (TIPS) Index: Measures the performance of rules based, market value-weighted
inflation protected securities issued by the U.S. Treasury. It is a subset of the Global Inflation-Linked Index (Series-L).
CBOE Volatility Index: An index of implied equity market volatility, reflecting the market estimate of future volatility for the S&P 500 Stock
Index over the next 30 days, using options.
MSCI Emerging Market Index: An index of equity market performance for developing markets, primarily in Asia, Latin America, and Eastern
Europe. The index tracks both large-cap and small-cap stocks and is weighted by market capitalization.
MSCI World Ex US Index: Measures the performance of the large and mid cap segments of world, excluding US equity securities. It is free float-adjusted
market-capitalization weighted.
Russell 2000 Small-Cap Index: Is an index measuring the performance of approximately 2,000 small-cap companies within the United
States.
S&P 500® Index: Measures the performance of 500 widely held stocks in US equity market. Standard and Poor's chooses member companies for the index
based on market size, liquidity and industry group representation. Included are the stocks of industrial, financial, utility, and transportation companies. Since
mid 1989, this composition has been more flexible and the number of issues in each sector has varied. It is market capitalization-weighted.
State Street Investor Confidence Index: measures investor confidence or risk appetite quantitively by compiling actual buying and selling
patterns of institutional investors.
US Trade-Weighted Dollar Index: An index that measures the value of the US dollar in relationship with other currencies, statistically
weighted on the basis of importance to the US as trading partners.
These materials are not intended as an offer or solicitation with respect to the purchase or sale of any security or other financial
instrument or any investment management services and should not be used as the basis for any investment decision. Past performance is
not a guarantee or reliable indicator of future results.
The information provided is not intended to provide investment advice and should not be construed as an investment recommendation by Prudential
Financial or any of its subsidiaries.
©2019 Prudential Financial, Inc. and its related entities. Prudential, the Prudential logo, the Rock symbol and Bring Your Challenges are service marks of
Prudential Financial, Inc., and its related entities, registered in many jurisdictions worldwide.
36280 Trumbull Street Hartford, CT 06103 © 2019 Prudential Financial, Inc. and its related entities. Prudential, the Prudential logo, the Rock symbol and Bring Your Challenges are service marks of Prudential Financial, Inc., and its related entities, registered in many jurisdictions worldwide.
You can also read